Global aviation – both passenger flights and freight – emits around one billion tonnes of carbon dioxide (CO2) each year. This was equivalent to around 2.4% of CO2 emissions in 2018.
How do global aviation emissions break down?
The chart gives the answer. This data is sourced from the 2019 International Council on Clean Transportation (ICCT) report on global aviation.1
Most emissions come from passenger flights – in 2018, they accounted for 81% of aviation’s emissions; the remaining 19% came from freight, the transport of goods.
Sixty percent of emissions from passenger flights come from international travel; the other 40% come from domestic (in-country) flights.
When we break passenger flight emissions down by travel distance, we get a (surprisingly) equal three-way split in emissions between short-haul (less than 1,500 kilometers); medium-haul (1,500 to 4,000 km); and long-haul (greater than 4,000 km) journeys.
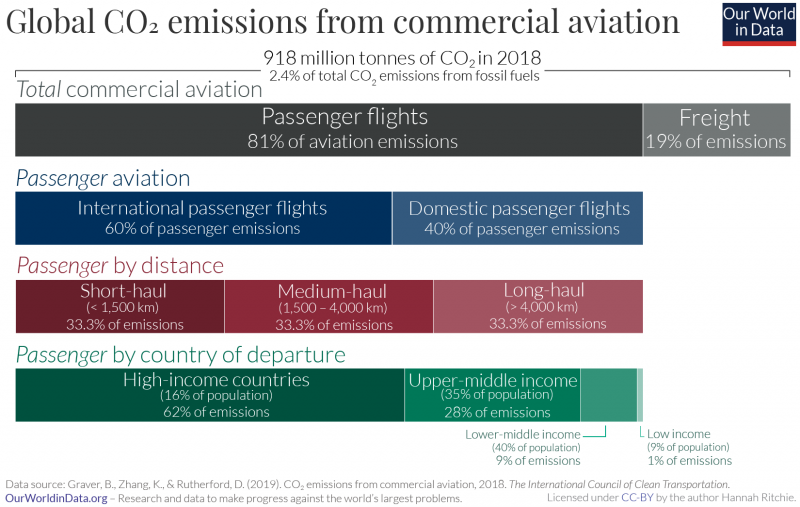
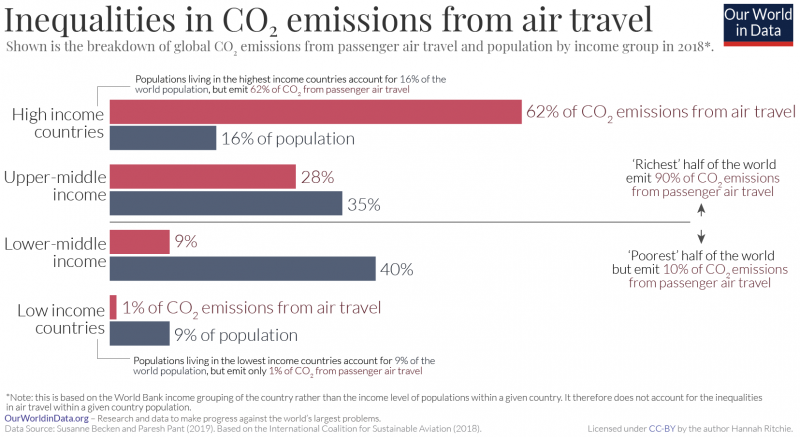
The global inequalities in how much people fly become clear when we compare aviation emissions across countries of different income levels. The ICCT split these emissions based on World Bank’s four income groups.
A further study by Susanne Becek and Paresh Pant (2019) compared the contribution of each income group to global air travel emissions versus its share of world population.2 This comparison is shown in the visualization.
The ‘richest’ half of the world (high and upper-middle income countries) were responsible for 90% of air travel emissions.3
Looking at specific income groups:
- Only 16% of the world population live in high-income countries yet the planes that take off in those countries account for almost two-thirds (62%) of passenger emissions;
- Upper-middle income countries are home to 35% of the world population, and contribute 28% of emissions;
- Lower-middle income countries are home to the largest share (40% of the world), yet emit the planes taking off there just account for 9%;
- The poorest countries – which are home to 9% of the world population – emit just 1%.
In an upcoming article we will look in more detail at the contribution of each country to global aviation emissions.