This entry presents available data and empirical evidence on corruption—an important problem imposing political, economic, and environmental costs on societies around the world.
Corruption is a phenomenon involving many different aspects, and it is therefore hard to give a precise and comprehensive definition. However, at the core of most definitions of corruption is the idea that a corrupt act implies the abuse of entrusted power for private gain. Classic examples include bribery, clientelism, and embezzlement. Other, often more subtle and sometimes even legal examples of corruption include lobbying and patronage.
While long-run data on corruption is very limited, historical examples suggest that corruption has been a persistent feature of human societies over time and space. Two such examples are the sale of parliamentary seats in ‘rotten boroughs’ in England before the Reform Act of 1832, and ‘machine politics’ in the US at the turn of the 19th century (Aidt 2003).1
The unethical and often illegal nature of corruption makes measurement particularly complicated. Corruption data usually comes from either direct observation (e.g. law enforcement records and audit reports), or perception surveys (e.g. public opinion surveys, or expert assessments). In this entry we discuss data from both sources, and discuss their underlying limitations.
As we show, although precise corruption measurement is difficult, there is a clear correlation between perception and behavior; so available corruption data does provide valuable information that, when interpreted carefully, can both tell us something important about our world as well as contribute to the development of effective policies.
For example, the data from perception surveys suggests that corruption correlates with human development, and a number of studies exploiting rich data from law enforcement records have shown that education is an important element explaining this relationship. Specifically, the data provides support for the idea that voters with more education tend to be more willing and able to monitor public employees and to take action when these employees violate the law.
The non-governmental organization Transparency International (TI) estimates a ‘Corruption Perception Index’, which is arguably the most widely used indicator of corruption worldwide and shown in the map here.
The Corruption Perception Index scores countries on a scale of 0-100, where 0 means that a country is perceived as highly corrupt and 100 means that a country is perceived as very clean. The indicator is representative of expert opinion, as it is constructed by taking the averages of various standardized expert surveys, including those from the Bertelsmann Foundation, the World Economic Forum, the World Bank, and many others.2
While TI’s Corruption Perception Index has been estimated since 1995, the methodology has been changed recurrently up until 2012. As such, the data presented here starts in 2012. You can explore country-specific trends by clicking on the ‘Chart’ tab, then clicking ‘
Add country
’ in the upper-right corner.
As we can see, the five countries with the highest scores (and thus perceived as most ‘clean’) are Denmark, New Zealand, Finland, Singapore and Sweden. At the other extreme, the countries with the lowest scores (and highest perceived corruption) are Somalia, Syria, South Sudan, Yemen, and North Korea.
Over the time period 2012-2018, we can see that scores are fairly stable, and drastic changes in ranking are not very common. There are, however, some clear exceptions: Myanmar, for example, improved its score from 15 to 29 in the period 2012-2018 (which corresponds to a change in world ranking from 171 to 136); meanwhile, Bahrain’s score fell from 51 to 36.
Where do people perceive corruption to be a major problem?
The data visualized here relies on the perception of experts (e.g. business people, country analysts, etc.). Now we analyze data representing the perceptions of everyday people confronting corruption around the world.
The Global Corruption Barometer, also produced by Transparency International, surveys individuals around the world, asking them about their opinions and experiences regarding corruption. The visualization shows the average national perception of corruption, as rated on a scale of 1 to 5 by respondents asked the question: “To what extent do you think that corruption is a problem in the public sector in this country?”. The data is from 2013.
The map shows that everyday people’s perception of the problems associated with corruption correlate with expert opinion (seen in the previous section) about how much corruption there is. However, the correlation is far from perfect, indicating that these two indicators present us with different perspectives. An important example is Sudan, which according to the Global Corruption Barometer has one of the lowest average ratings (meaning that average people do not consider corruption in the public sector to be a major problem). This stands in stark contrast to expert opinion, which regards Sudan as having among the highest levels of public sector corruption.
The fact that the perception of experts and other citizens diverge is at the heart of perception measures: experts and non-experts have different reference points against which they assess whether corruption is a problem. Indeed, in countries where the public finds corruption extremely intolerable, the perception of its implications may be extreme, even if baseline corruption levels are lower than in other countries.
Corruption is sometimes hard to tackle precisely because it is common, so people perceive it to be a natural economic transaction: it is easier to act corruptly if there are many other individuals who think it is fine to be corrupt. This is the rationale behind ‘big-push’ policies that aim to shift norms and perceptions.
Which institutions do people perceive as most corrupt?
The Global Corruption Barometer produced by Transparency International asks individuals across countries whether they perceive specific institutions to be corrupt. The chart presents, by institution, the global aggregate figures. The numbers correspond to the percentage of survey respondents who think that “Most” or “All” of each institution is corrupt in their home country.
The estimates show that, globally, people perceive domestic police forces and the legislature to be particularly corrupt. Detailed data by region, including survey answers for other institutions, are available from the corresponding Global Corruption Barometer Report.
This visualization digs deeper into corruption perceptions, specifically in the context of politics.
The data is from the 2013 report – since this was broken down by country – and the map shows the percentage of survey respondents in each country who think that political parties are “corrupt or extremely corrupt”.
As we can see, there is substantial cross-country heterogeneity, and patterns again show differences with respect to general corruption perception. In Greece and Italy, for example, around 90% of survey respondents consider that political parties are very corrupt. This ranks them among the top-ten countries with the highest perception of political corruption.
Where are people more likely to pay bribes to access public services?
Bribery is one of the most common forms of corruption. The following visualization shows the share of people who report having paid a bribe to access public services in the 12 months prior to the survey. The data comes from the Global Corruption Barometer, produced by Transparency International, and the public services in question are: education; judiciary; medical and health; police; registry and permit services; utilities; tax revenue and/or customs; and land services.
Once again, cross-country heterogeneity stands out. In countries such as India, Yemen, Liberia and Vietnam, at least two out of three survey respondents report having paid a bribe within the past year. In Japan, the UK, and Sweden, only one in a hundred (or fewer) reports having paid a bribe in the same window of time.
While these results do show that in some countries bribe paying is very rare, we have to take into account that these estimates come from ordinary people interacting locally. As we show below, many countries where ordinary people do not frequently pay bribes, have far-from-perfect international records when it comes to international private-sector bribery.
How does petty corruption affect the income of the poor?
For those without money and connections, paying even small bribes to access basic public services such as public health or police, can have important consequences. In fact, petty corruption in the form of bribes often acts as a regressive tax, since the burden typically falls disproportionately on the poor.
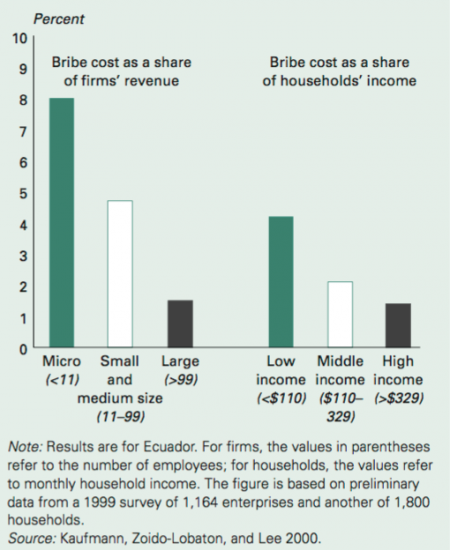
This visualization, taken from the World Development Report (2011), uses data from Ecuador to estimate the cost of bribes paid relative to income. More specifically, the right panel shows the self-reported cost of bribes paid by households (as share of household income), while the left panel shows the self-reported cost of bribes paid by firms (as share of firm revenue). The presented estimates are in percent and come from a 1999 survey of 1,164 enterprises and another of 1,800 households.
As we can see from this example, petty corruption seems to act as a regressive tax: poor households tend to pay a larger share of their income on bribes to access public services.
Where are firms more likely to be asked for bribes?
As the visualization here shows, bribes are also requested from, and paid by, firms in the private sector. This visualization shows, for a selection of countries, the percentage of firms experiencing at least one bribe payment request during 6 transactions dealing with utilities access, permits, licenses, and taxes. The data comes from the World Bank’s Enterprise Surveys (2007-2013).
According to this source, close to 70% of firms report having been asked for bribes in Syria and Liberia. Whereas in countries such as Bhutan, Slovenia, Israel, Eritrea and Estonia, the corresponding figure is below 1%.
Which countries are perceived by business executives as more likely to ‘export corruption’?
This visualization provides evidence of the frequency with which firms are requested to pay bribes—that is, the demand side of bribing. Here we explore the supply side, using data from Transparency International’s ‘Bribe Payers Survey’.
In its most recent edition (2011), the Bribe Payers Survey asked 3,016 senior business executives in 30 countries around the world for their perceptions of the likelihood of companies, from countries they have business dealings with, to engage in bribery when doing business in the executive’s own country.
Based on the answers from the Bribe Payers Survey, Transparency International estimates the average of the scores given by all the respondents who rated each country (on a scale from 0 to 10, where 0 means firms always pay bribes in that country, and 10 means they never do). This gives the so-called ‘Bribe Payers Index’.3
Transparency International also publishes its index results by sector. According to these estimates, ‘public works contracts and construction’ is the sector where firms from industrialized countries are more likely to engage in international bribery.
The results from Transparency International reveal large heterogeneity across sectors; so it should be kept in mind that cross-country differences in the visualization reflect, to a great extent, such differences across sectors.
Many firms from high-income countries engage in bribery across the world
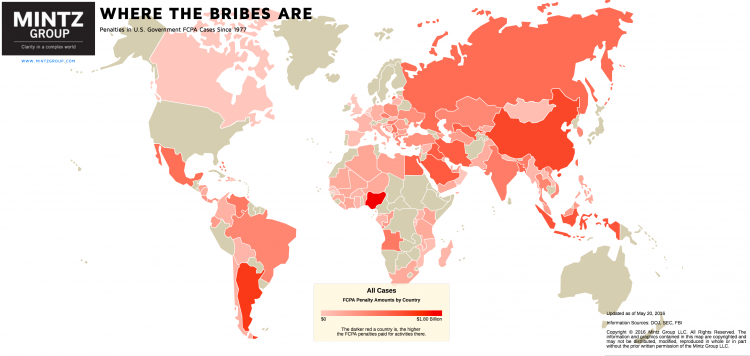
The Foreign Corrupt Practices Act (FCPA) in the US was passed in 1977 with the aim of making the bribery of foreign officials illegal. The visualization, from the Mintz Group, shows the global distribution of all penalties in US Government FCPA cases since 1977. Darker colors in the map denote larger total penalties for activities in the corresponding country. Total penalties are measured in US dollars, so this chart combines the number and magnitude of cases. In Argentina, for example, the dark color is mainly due to one very large case involving Siemens (450 Million USD penalty, in 2008). An interactive version of this map including details regarding specific penalties, is available from the Mintz Group at http://www.fcpamap.com.
These official records show that US firms have paid bribes in 80 countries since 1977—including in many OECD countries.
Diplomats from countries with high corruption perception tend to break traffic rules abroad more often
Corruption is commonly defined as “the abuse of entrusted power for private gain”. Here we provide evidence of how diplomats in New York City abused their diplomatic status to break traffic rules by parking illegally.
UN mission personnel and their families benefit from diplomatic immunity. In New York City, until November 2002, diplomatic immunity implied that UN mission personnel could park illegally and avoid paying the corresponding fines. The visualization maps average unpaid annual New York City parking violations per diplomat by the diplomat’s country of origin, over the period November 1997 – November 2002. The data comes from Fisman and Miguel (2007)5, who in turn obtained information compiled by the New York City Department of Finance.
As we cans see from the map, this ‘revealed-preference’ measure of corruption among diplomats correlates positively with the survey-based measures of corruption we have already discussed. Diplomats from countries where corruption perception is low (e.g. Denmark) seem to be generally less likely to break parking rules abroad, even in situations in which there are no legal consequences.
While the correlation is obviously not perfect (e.g. Colombia has a high corruption perception but zero unpaid parking violations in the data) Fisman and Miguel (2007) show that, statistically speaking, the positive correlation between corrupt behavior by diplomats ‘abroad’, and corruption perception ‘at home’, remains after controlling for factors such as national income in the diplomats’ home country, or the diplomats’ salaries. This evidence suggests that cultural norms are one of the factors that affect corrupt behavior.
OECD countries are increasingly providing procedures for public officials to report corruption
Corruption is not something that only affects low income countries—and in fact, many high income countries have become increasingly aware of this in recent years.
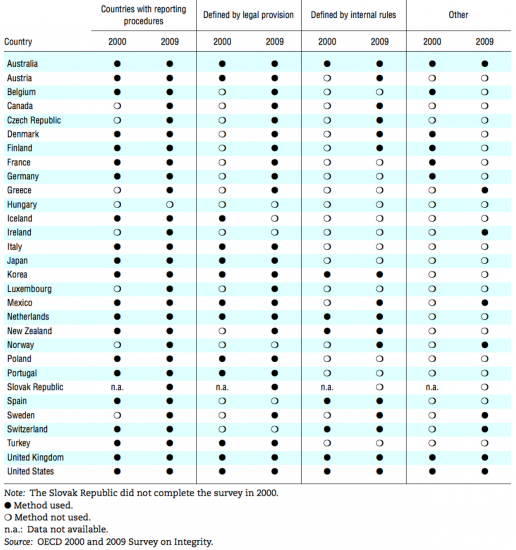
The table details a list of OECD countries and whether they have specific procedures in place for public officials to report misconduct or suspected corruption.
As we can see, since 2000 many OECD countries have developed formal mechanisms to allow public officials to expose corruption (‘whistle-blowing’) more easily. Specifically, the table shows that the share of OECD countries that reported having legal whistle-blowing procedures went up from 44.8% in the year 2000 (13 out of 29 countries in the sample), to 79.3% in 2009 (23 out of 29 countries in the sample). Today, many of these countries supplement legal provisions with internal rules (e.g. minimum requirements for whistle-blowing programs).
Procedures for public officials to report misconduct or suspected corruption (2000 vs 2009) – OECD6
What is the relationship between corruption and development?
This visualization shows the cross-country relationship between development (as measured by the United Nations Human Development Index) and corruption (as measured by Transparency International’s Corruption Perception Index).
As we can see, countries that score higher in the Corruption Perception Index (i.e. countries seen as less corrupt) tend to also have better scores in the Human Development Index.
The relationship in the visualization above is just a correlation: there are many factors that simultaneously drive corruption and development. Education is an important case in point.
The scatter plot provides evidence of the cross-country relationship between educational attainment and corruption. The horizontal axis measures corruption using Transparency International’s Corruption Perception Index; and the vertical axis measures average years of schooling.
As we can see, there is again a strong positive relationship: countries where people are more educated tend to have better scores in the Corruption Perception Index.
A number of academic studies have tried to establish the extent to which this relationship is causal. Glaeser and Saks (2006)7, for example, show that within the US, states that are better educated tend to be less corrupt—importantly, they show that this relationship holds even when using historical factors like Congregationalism in 1890 as a proxy for the current levels of schooling. In other words, they find that historical levels of education predict differences in levels of corruption across States several generations later. This is consistent with other studies that support the theory that voters with more education tend to be more willing and able to monitor public employees and to take action when these employees violate the law.
What is the relationship between corruption and accountability?
One of the most widely accepted mechanisms of controlling corruption is to ensure that those entrusted with power are held responsible for reporting their activities. This is the idea behind so-called ‘accountability’ measures against corruption.8
The visualization shows the cross-country relationship between corruption and accountability. Here, corruption is measured as the share of people who admit having paid bribes in the past 12 months (as per the estimates from the Global Corruption Barometer), and accountability is measured by the Accountability Transparency Index developed by Williams (2015)9 (this index is constructed from a number of underlying indicators which gather information about the extent of free media, fiscal transparency, and political constraints).
As we can see, people are less likely to pay bribes in countries where there are stronger institutions to support accountability.
In a recent paper, Ferraz and Finan (2011)10 show there is evidence that this relationship is causal. Specifically, they show that electoral accountability causally affects the corruption practices of incumbent politicians in Brazil. In municipalities where mayors can run for reelection there is significantly less corruption, and the positive effect of accountability via reelection is more pronounced among municipalities with less access to information and where the likelihood of judicial punishment is lower.
How effective are top-down audits to reduce corruption?
A common policy prescription to fight corruption is to increase monitoring and punishments. The logic supporting such policies is straightforward: better monitoring and harsher punishments increase the expected cost of acting corruptly, so people rationally choose not to break the rules.
To test the extent to which monitoring and punishments effectively reduce corruption, economists often rely on ‘policy experiments’, where they administer these policies to ‘treatment groups’. Olken (2007)11 follows this approach, increasing the probability of central government audits from 4 percent to 100 percent (the ‘policy treatment’), in the context of Indonesian village road projects.
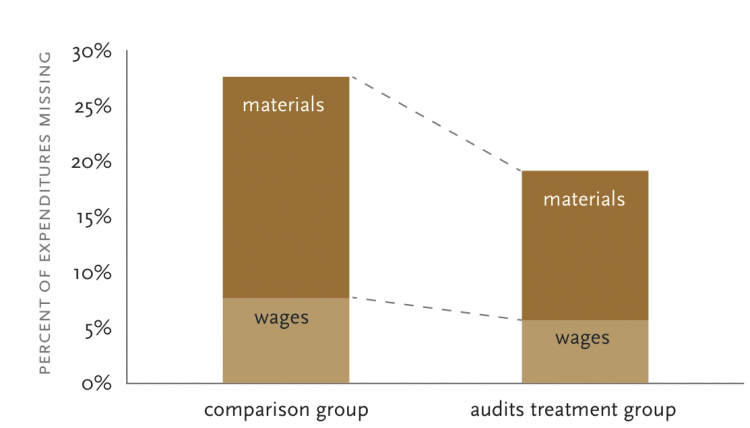
Olken (2007) compares the outcomes for villages that received this intervention with those that did not, and finds that audits significantly reduced missing expenditures, as measured by discrepancies between official project costs and an independent engineers’ estimates. The following visualization summarizes these results. The height of the bars shows the percent of expenditures that engineers found to be missing.
As we can see, missing expenditures were much lower in villages where audits were certain.
Olken (2007) provides further evidence of the extent to which officials in charge of road projects responded to private incentives: he finds that (i) audits were most effective when officials faced elections soon, and (ii) village elites shifted to nepotism (the practice of hiring family members), which is a form of corruption that was harder for audits to detect.
Effect of audits on missing expenditures in an Indonesian Randomized Control Trial – Figure 2 in J-pal Policy Briefcase (2012)12
How important is the link between cultural norms and corruption?
A recent study by Fisman and Miguel (2007)13 shows that diplomats from countries where corruption perception is low (e.g. Denmark) seem to be generally less likely to break parking rules abroad, even in situations in which there are no legal consequences.
A world map showing the number of parking violations per diplomat, across different UN diplomatic delegations in the New York, US, is available here. You can read more about the data in our section on Evidence from law-enforcement and regulation above.
Fisman and Miguel (2007) show that the positive correlation between corrupt behavior by diplomats ‘abroad’, and corruption perception ‘at home’, remains after controlling for factors such as national income in the diplomats’ home country, or the diplomats’ salaries. This evidence suggests that cultural norms are one of the factors that affect corrupt behavior.
Definitions, Measurement and Data Quality
Definition
Corruption is a phenomenon involving many different aspects, and it is therefore hard to give a precise and comprehensive definition. However, at the core of most definitions of corruption is the idea that a corrupt act implies the abuse of entrusted power for private gain. Classic examples include bribery, clientelism, and embezzlement. Other, often more subtle – and sometimes even legal – examples of corruption include lobbying and patronage.
Measurement limitations
The unethical and often illegal nature of corruption makes measurement particularly complicated. Corruption data usually comes from either direct observation (typically law-enforcement records), or perception surveys (e.g. general-population attitudinal surveys, or expert assessments).
The main disadvantage of direct observation is that corruption is, as should be clear from its definition, difficult to observe. This means that estimates are almost surely biased, and are not generally suitable for cross-country comparisons, since differences in levels may stem from differences in law enforcement, rather than actual differences in corruption.
On the other hand, the main disadvantage of measuring the perception of corruption, rather than corrupt behavior directly, is that estimates are highly sensitive to how survey respondents—both experts and everyday people—form perceptions in the first place. For instance, differences in perceived corruption between countries may stem from differences in the way corruption is defined or morally viewed, rather than from differences in actual behavior.
In any case, despite these limitations, both sources provide very valuable information regarding underlying patterns. For example, studies relying on direct observation have been widely used for within-country studies, specifically in contexts where law enforcement is considered to be broadly constant across states or municipalities (see, for example, Glaeser and Saks 2006 14, and Ferraz and Finan 201115).
Relationship between sources
This visualization shows the relationship between two different survey-based measures of corruption. In the vertical axis, perception is measured using Transparency International’s Corruption Perception Index (lower scores reflect higher perceived corruption); and in the horizontal axis, corruption is measured using self-reported bribe paying behavior (estimated as the share of survey respondents who report having paid a bribe to access public services in the last year).
As we can see from this plot, there is a clear association between both measures: countries where people report having to pay bribes often, are also countries that tend to score low in the Corruption Perception Index.
The fact that corruption perception does contain information about corrupt behavior has been corroborated by detailed case studies. Olken (2009)16, for example, shows that citizens’ perception of corruption in infrastructure projects correlate with objective measures of ‘missing expenditures’, as measured by independent engineers’ estimates in Indonesia.
Transparency International – Corruption Perception Index (CPI)
Data: Index relying on surveys and indicators from various sources, including the African Development Bank, the Bertelsmann Foundation, and the World Bank (among many others).17
Geographical coverage: Global by country
Time span: Current methodology available since 2012 (other – non-comparable –methodologies go back to 1995)
Data: Control of Corruption Index. Composite index relying on surveys and indicators from various sources (many of which intercept with TI’s Corruption Perception Index – full list available from http://info.worldbank.org/governance/wgi/#doc).
Transparency International – Bribe Payers Index (BPI)
Data: Index constructed from surveys asking business executives for their perceptions of the likelihood of companies, from countries they have business dealings with, to engage in bribery.
Geographical coverage: Selected countries (28 of the world’s largest economies)
Transparency International – Global Corruption Barometer (GCB)
Data: Global opinion survey asking people about their experiences and perceptions regarding corruption. It addresses people’s direct experiences with bribery and details their views on corruption in the main institutions in their countries
Geographical coverage: Global by country
Time span: Yearly editions since 2003, but some questions have not been repeated in multiple editions
Data: Firm-level survey of a representative sample of an economy’s private sector. The surveys cover a broad range of business environment topics including corruption.
Geographical coverage: Global by country
Time span: From 2007 onwards (different survey years for different countries)
Quality of Government Institute (QoG) – Assembled Dataset
Reference: Teorell, Jan, Stefan Dahlberg, Sören Holmberg, Bo Rothstein, Anna Khomenko & Richard Svensson. 2016. The Quality of Government Standard Dataset, version Jan16. University of Gothenburg: The Quality of Government Institute, http://www.qog.pol.gu.se doi:10.18157/QoGStdJan16
Data: Dataset gathering indicators from approximately 2500 variables, from more than 100 data sources. Many of the indicators described above are included in this dataset.