Testing is our window onto the Coronavirus outbreak (COVID-19). Our central metric for understanding how the virus is spreading – the number of confirmed cases – consists of all those people who have tested positively.
Crucially, then, this is dependent on how many people a country actually tests. A country that has tested very few people can only have very few confirmed cases.
But because widespread testing is also one of the key measures for tackling the pandemic, the relationship between testing and cases also goes the other way. Countries who have managed to contain their outbreak, and were able to keep the number of infections low, need to perform fewer tests to adequately monitor the outbreak than those countries where the virus has spread more widely.
For the same reasons, the timing of testing is also crucial. A high rate of testing will do more to slow the outbreak if conducted earlier on, when there are fewer infections.
As an indicator of how proactive a country’s testing response has been, the number of tests conducted to date then only tells a small part of the story. It does not consider two important, closely related questions:
- When did these tests happen?
- How extensive is testing relative to the size of the outbreak in that country?
Here we answer these two questions for four key countries: South Korea, Italy, the United Kingdom, and the United States.
From similar beginnings, the four countries followed very different paths
South Korea, Italy, UK and US all discovered their first cases in late January – you can see that in this chart. But they went on to adopt very different approaches to testing, and experienced very different outbreaks.
Below, we compare differences between the four countries in their testing strategies and in the growth of confirmed cases over time. We look in turn at three windows of time between mid-January and early May. Tips on how to read the charts shown below are given in the box on the right.
Overall we see that Korea tested early and widely to monitor the outbreak and bring it under control quickly. Italy, the UK, and the US did not.
How to read the three charts below
Below we show the same chart three times, for three different periods: firstly only up to 7th March, then up to 7th April, and finally up to 7th May.
The chart is an unusual one and it can take a few moments to understand what is going on. But it is useful because it allows you to see, at the same time, how the daily number of confirmed cases (horizontal axis) and the daily number of tests (vertical axis) in each country has changed over the course of their outbreak.
- Where a country moves in a flat line to the right, it is seeing its daily confirmed cases rise whilst testing stagnates.
- Where a country moves up vertically, it is ramping up testing whilst the number of cases found each day stays the same.
- Where the line bends to the left, daily confirmed cases are falling: the country has passed its peak.
The grey dotted lines indicate where the daily number of tests equals a certain number of times the daily number of new confirmed cases. Where only a few tests are performed for each confirmed case, this suggests that the number of confirmed cases may greatly underestimate the true number of people infected with COVID-19.
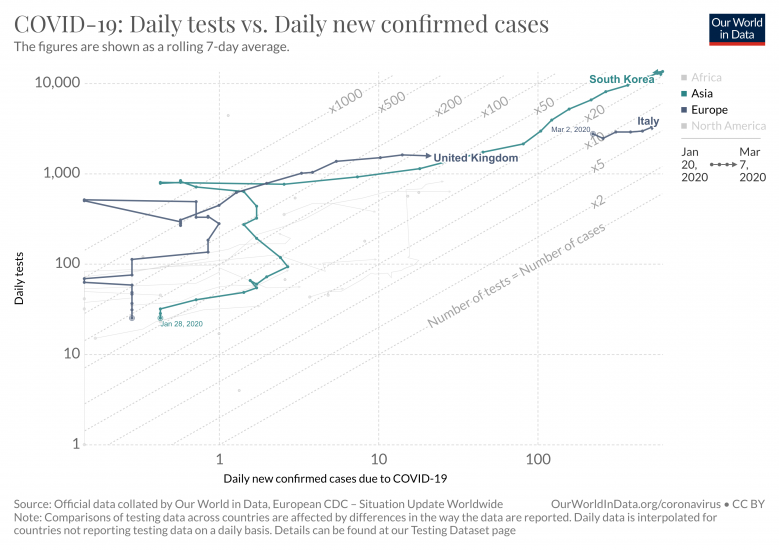
South Korea
South Korea began widespread testing very early on: in the first days of February it shifted its policy to open public testing available also to asymptomatic people; and pursuing contact tracing for all confirmed cases. As you see in the chart here, testing quickly ramped up to more than 10,000 people per day
By the middle of March, South Korea had already passed the peak of its outbreak: as you see in the chart, the country never saw much more than 600 new confirmed cases per day. As the number of new confirmed cases fell, testing continued as the same rate.
United States
For this crucial early period, no data on testing was being published in the US.1
Italy
Testing in Italy increased much more slowly. Throughout early March, the line is flat: the same number of tests per day found more and more cases. Italy’s outbreak is accelerating past South Korea’s.
As the line moves horizontally, we see the number of tests per confirmed case falling from more than 10 to around 5 (indicated by the x10 and x5 dotted grey lines). This suggests that the outbreak in Italy at this point may have been far more widespread, and growing at a faster pace, than indicated by the number of confirmed cases.2
United Kingdom
The UK got an early headstart on testing: hundreds of people were tested for every early case. Comprehensive contact tracing was in place early on.
But by early March we are beginning to see signs that testing in the UK isn’t able to keep up with the outbreak: the line bends to the right as daily confirmed cases begin to rise, but testing stagnates.
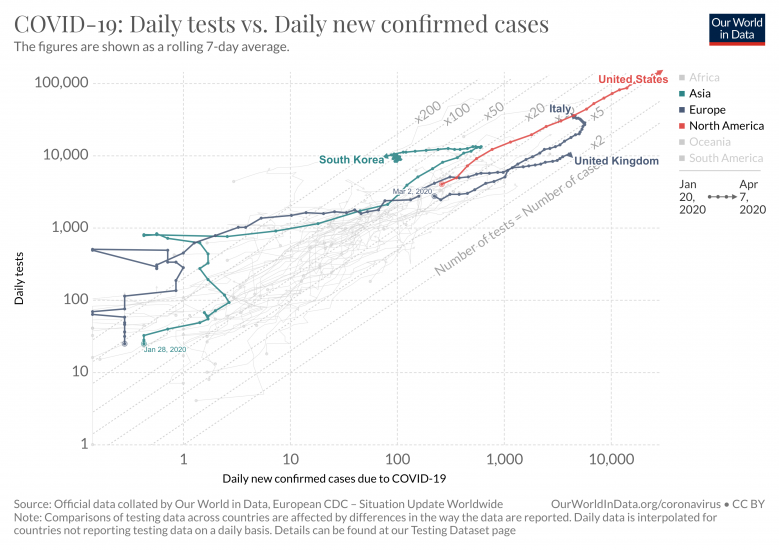
United States
Testing in the US only began in earnest in mid-March. It then increased rapidly, to more than 100,000 tests per day by the end of March.
But whilst the number of tests in the US began to outstrip other countries, so did its outbreak. In early April, the number of new confirmed cases passes 30,000 per day – 50 times higher than South Korea’s peak.
Italy
Italy has now passed its peak of 6,000 new confirmed cases per day – roughly ten times higher than at the peak of South Korea’s outbreak. The outbreak gradually slows, whilst testing continues to accelerate.
United Kingdom
By early April, testing in the UK had increased considerably in absolute terms. But the outbreak had grown far quicker. The policy of tracing contacts of confirmed cases ceased on 12th March, and testing never extended beyond symptomatic people. Of the 10,000 people tested each day in early April, roughly 4,000 were confirmed as being infected: almost every other person (indicated by the x2 dotted grey line). Such a ratio is a clear sign that many, many infections were going undetected.
South Korea
A similar level of testing continued in South Korea, despite confirmed cases having fallen to very low levels. Here, of the 10,000 people tested each day in early April, fewer than 100 were confirmed as being infected.
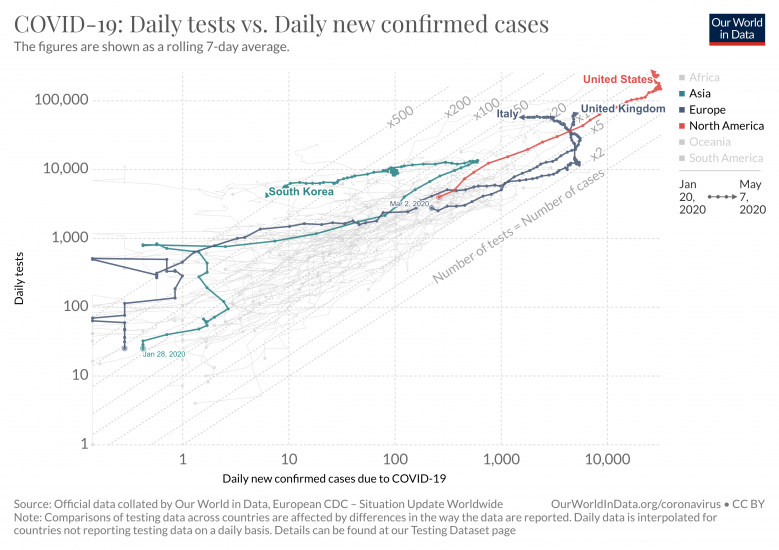
Whilst the four countries began in similar circumstances – with their first cases of COVID-19 being discovered in late January – three months later we see that each country went on to follow very different paths.
United States vs South Korea
The outbreak in the US continued to accelerate until mid-April – a whole month after the peak in South Korea. By the beginning of May, the total number of confirmed cases in the US had passed one million – already one hundred times more than the total number of confirmed cases in South Korea across the outbreak. As the number of daily confirmed cases gradually fell from mid-April, still more cases were added to that count each day than were found in South Korea over the entire outbreak.
The US continued to increase testing capacity, and it now dwarfs other countries in absolute terms. But relative to its outbreak, testing remained low by international standards. Only from late April did the number of tests per confirmed case – for the first time – begin to rise.
United Kingdom vs Italy
New confirmed cases peaked in both Italy and the UK at roughly the same level: 6,000 new cases per day. But whereas in Italy daily confirmed cases then started to fall quickly, in the UK they remained at the same level for a further month.
Again differences in testing may help to explain this difference.
In the UK, the levelling out of new confirmed cases coincided with a dramatic acceleration in testing. After two months of slow gradual growth, the number of people tested each day jumped from 10,000 to 60,000 within a fortnight. Just as the growth of the outbreak in UK was most likely understated due to limited testing, this rapid acceleration in testing may have understated the pace at which the outbreak was receding.3
What do we learn from these charts?
What these charts show us is just how closely connected testing is to the number of confirmed cases. We need the one set of data to properly interpret the other.
We cannot learn about the outbreak from the number of confirmed cases, unless we also know the extent of testing by which these cases were discovered. Where every other person tested is found to be infected – as in the UK in early April before testing capacity increased – this is a clear indication that many infected people are going untested. In this circumstance, the number of confirmed cases gives an unreliable indication of the extent of the outbreak. Where only one in 100 people tested are found to be infected – as in South Korea at the same point in time – confirmed case numbers give a much more reliable picture of the outbreak.
And it is only relative to the size of outbreak – as indicated by confirmed cases – that we can meaningfully judge how adequate countries’ testing response has been. The US, for instance, has tested far more people than any other country. But the extensive testing came much later in the outbreak than we saw, for instance, in South Korea, and only when the outbreak had already spread significantly. Testing in the US is high in absolute terms, but it remains low relative to scale of its outbreak (as of the middle of May).
Overall, we learn that to understand the pandemic, or how successful countries have been in their response to it, you cannot look at the data on confirmed cases or the data on testing in isolation. You need to look at the two together.
For this reason we are maintaining a global database on testing to complement the global data on confirmed cases and deaths. You can find the regularly updated data, more visualizations and detailed descriptions of the sources at our entry on Coronavirus Testing.