The Internet’s history goes back some decades by now – email has been around since the 1960s, file sharing since at least the 1970s, and TCP/IP was standardized in 1982. But it was the creation of the world wide web in 1989 that revolutionized our history of communication. The inventor of the world wide web was the English scientist Tim Berners-Lee who created a system to share information through a network of computers. At the time he was working for the European physics laboratory CERN in the Swiss Alps.
Here I want to look at the global expansion of the Internet since then.
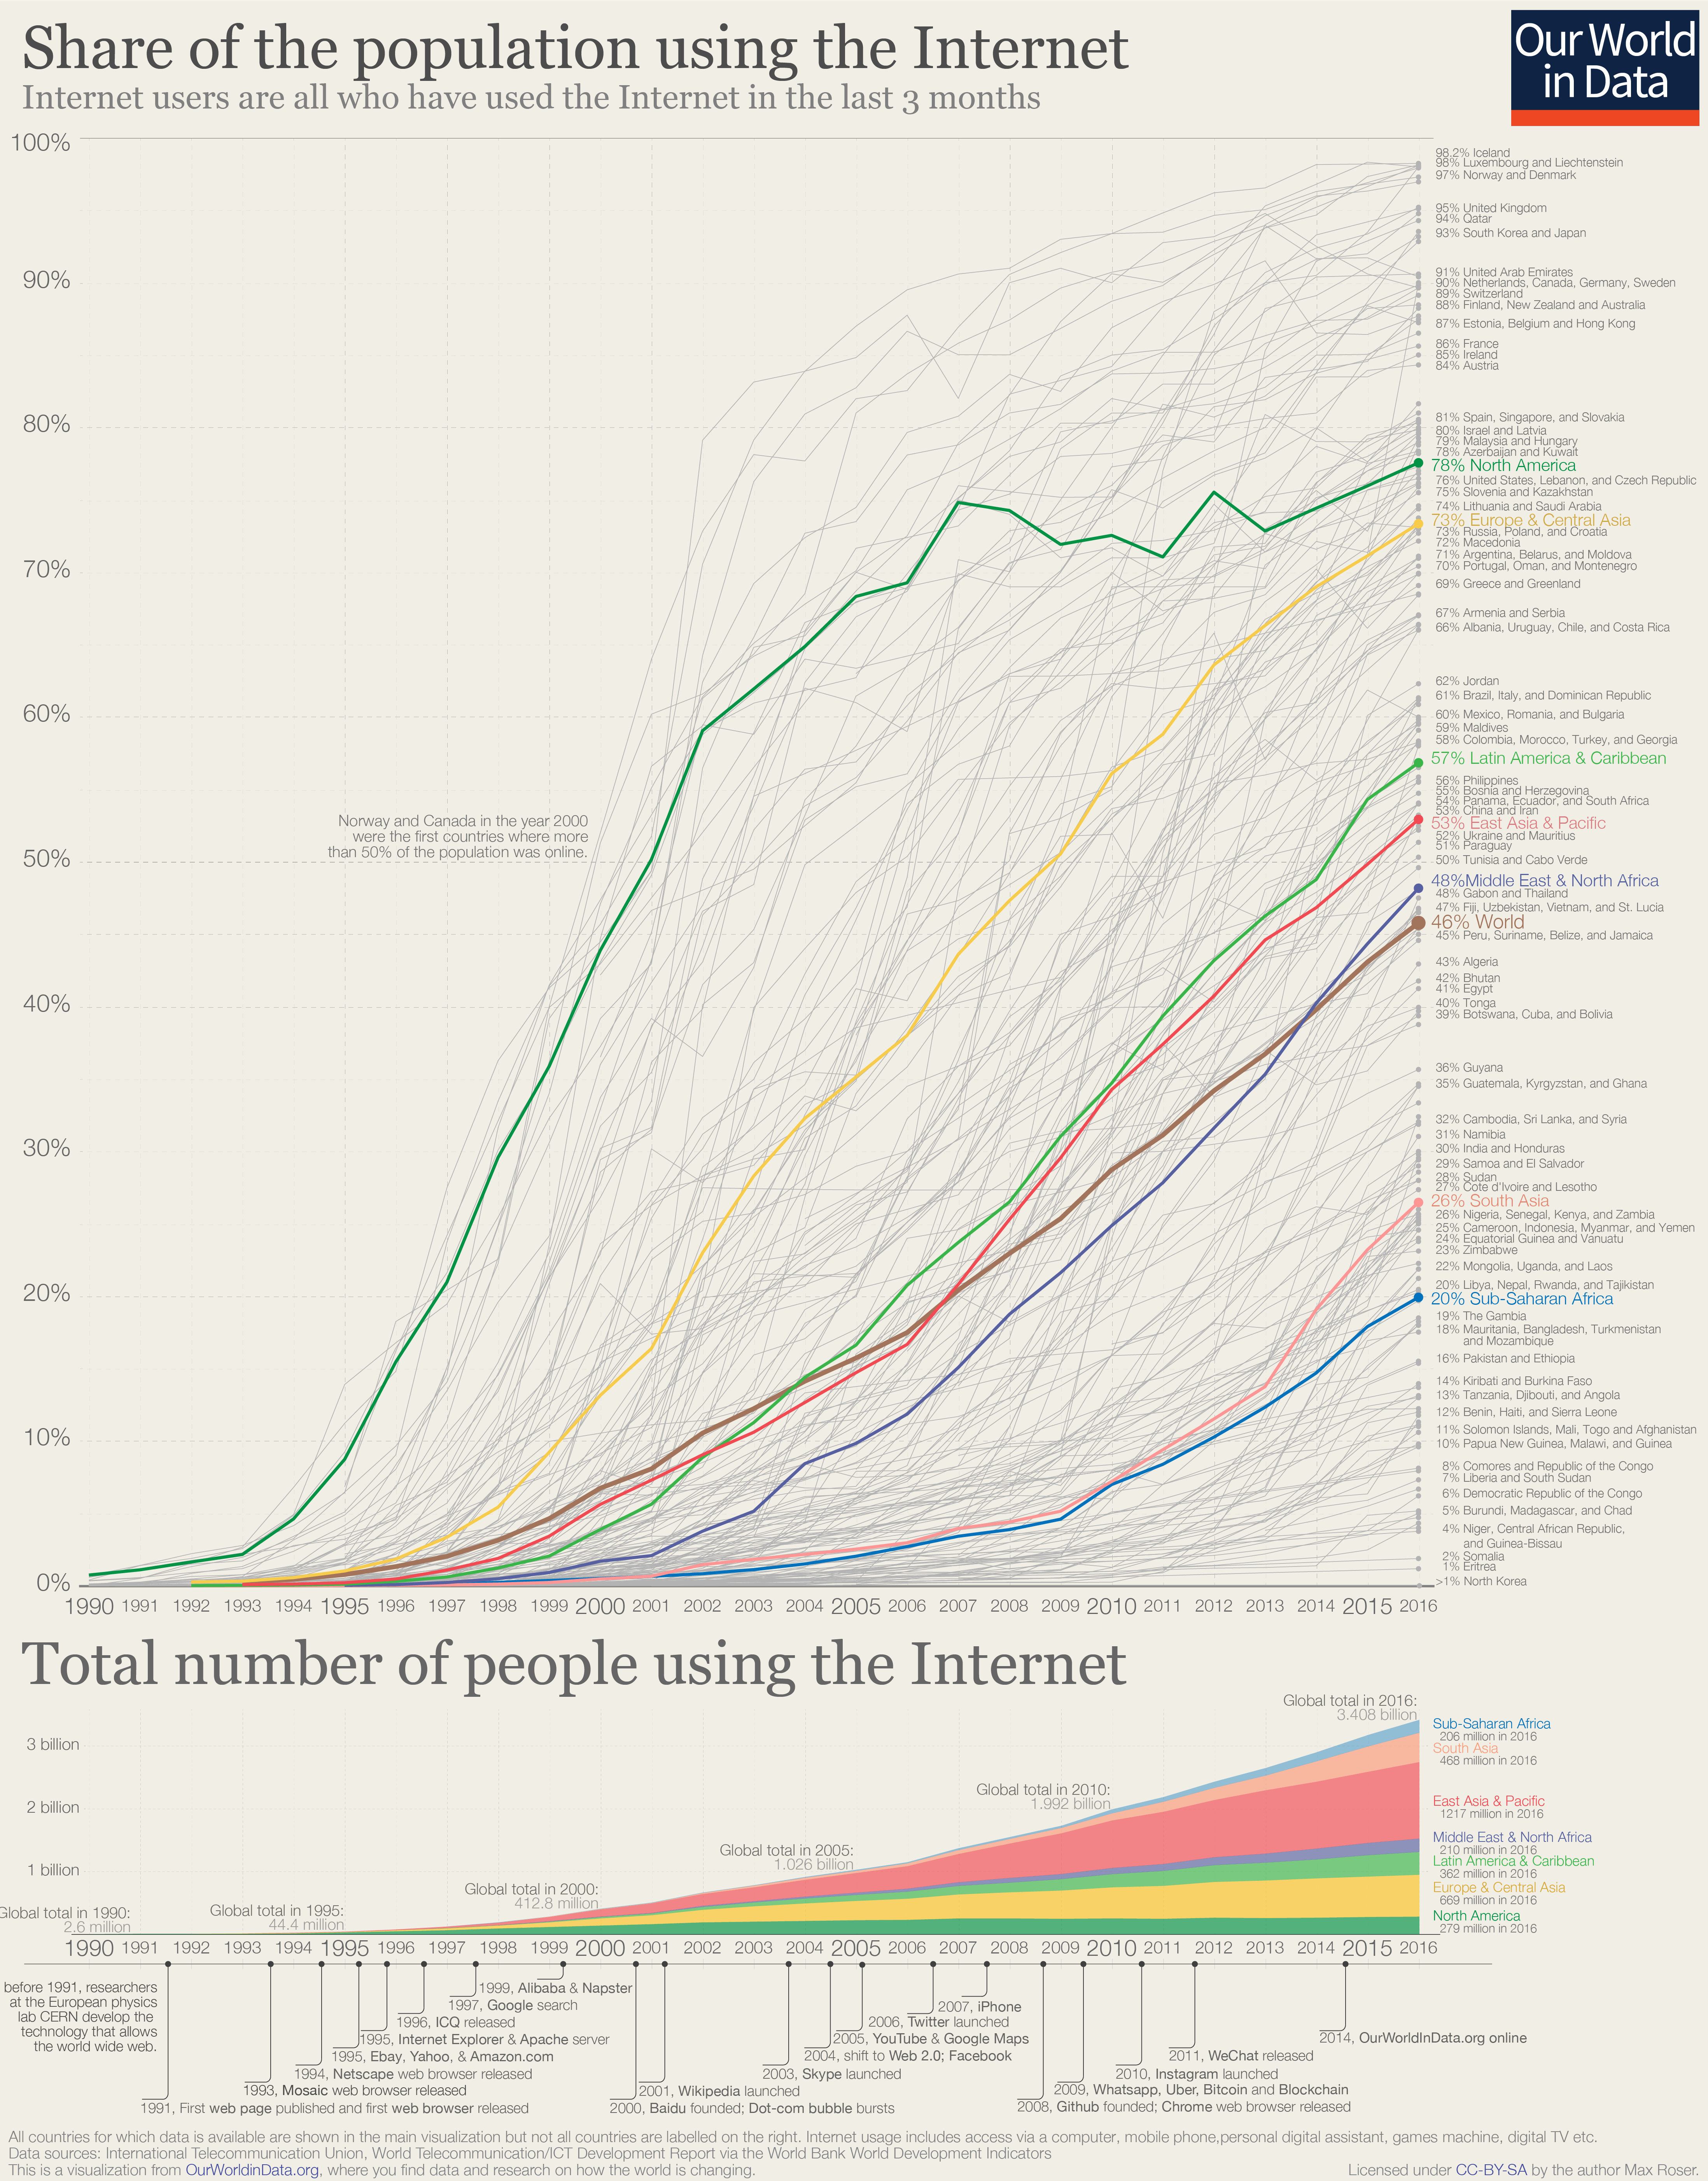
This chart shows the share and number of people that are using the Internet, which in these statistics refers to all those who have used the Internet in the last 3 months.1
The chart starts in 1990, still one year before Berners-Lee released the first web browser and before the very first website was online (the site of CERN, which is still online). At that time very few computers around the world were connected to a network; estimates for 1990 suggest that only half of a percent of the world population were online.
As the chart shows, this started to change in the 1990s, at least in some parts of the world: By the year 2000 almost half of the population in the US was accessing information through the internet. But across most of the world the internet had not yet had much influence – 93% in the East Asia and Pacific region and 99% in South Asia and in Sub-Saharan Africa were still offline in 2000. At the time of the Dot-com-crash less than 7% of the world was online.
15 years later, in 2016, three-quarters (76%) of people in the US were online and during these years countries from many parts of the world caught up: in Malaysia 79% used the internet; in Spain and Singapore 81%; in France 86%; in South Korea and Japan 93%; in Denmark and Norway 97%; and Iceland tops the ranking with 98% of the population online.2
At the other end of the spectrum, there are still countries where almost nothing has changed since 1990. In the very poorest countries – including Eritrea, Somalia, Guinea-Bissau, the Central African Republic, Niger, and Madagascar – fewer than 5% are online. And at the very bottom is North Korea, where the country’s oppressive regime restricts the access to the walled-off North Korean intranet Kwangmyong and access to the global internet is only granted to a very small elite.
But the overarching trend globally – and, as the chart shows, in all world regions – is clear: more and more people are online every year. The speed with which the world is changing is incredibly fast. On any day in the last 5 years there were on average 640,000 people online for the first time.3
This was 27,000 every hour.
For those who are online most days it is easy to forget how young the internet still is. The timeline below the chart reminds you how recent websites and technologies became available that are integrated to the everyday lives of millions: In the 1990s there was no Wikipedia, Twitter launched in 2006, and Our World in Data is only 4 years old (and look how many people have joined since then4).
And while many of us cannot imagine their lives without the services that the internet provides, the key message for me from this overview of the global history of the internet is that we are still in the very early stages of the internet. It was only in 2017 that half of the world population was online; and in 2018 it is therefore still the case that close to half of the world population is not using the internet.5
The internet has already changed the world, but the big changes that the Internet will bring still lie ahead and its history has just begun.
The share of the population and the total number of people using the Internet6