This entry is concerned with the availability of artificial light. If you live, or have lived, at a place where there is no artificial light available you know how important it is. Once the sun is down you cannot get any work done and reading a book is also not an alternative.
The history of light is a history of technological innovations in the technologies that are available – including candles, lamps, and light bulbs – the energy sources that are available, and the institutions that make these technologies possible. It is a prime example for the benefits of technological innovation and the study of socio-economic change over the long run.
Historical studies have focussed on the UK in particular and this is therefore also true in this entry.
The price of light declined dramatically and what was once a technology that was only available to a very small elite is increasingly available to poorer households across the world. Over the course of the 20th century light bulbs, powered by electricity, became the standard. And if you miss the warm light and coziness of a candle, you can still light a candle today.
How did the price of light change over time? The economic historians Roger Fouquet and Peter Pearson1
set out to reconstruct a time-series of the price over the very long run – from 1300 to today – in the UK.2
To calculate the price of lighting – today or historically – two different prices need to be known: first, the prices of the relevant energy sources and second, how efficiently the available technology at the time can turn the energy into light. The latter is referred to as the ‘lighting technology efficiency’ in the literature and is measured in units of energy used for each lumen-hour of light generated.
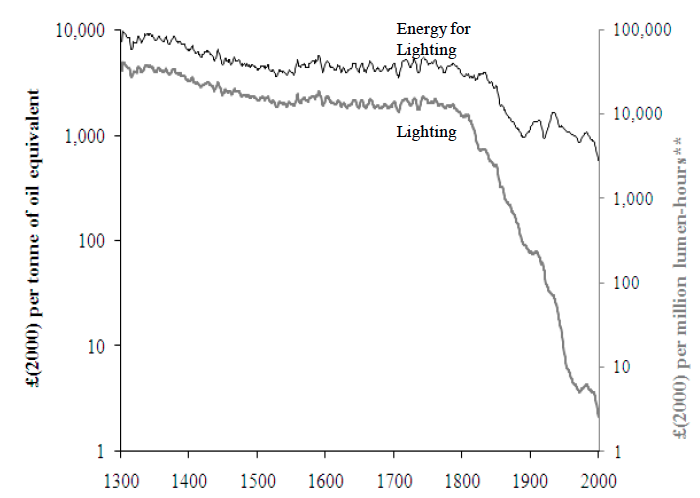
This visualization shows the effect that innovation in technology and falling prices of energy had on the price of light in the UK. In 2006 the price of 1 million lumen-hours of artificial light was £2.89. In the 14th century the price for this same luminous energy – adjusted for inflation – was around £35,000. A 12,000-fold decline of the price of a truly important service.
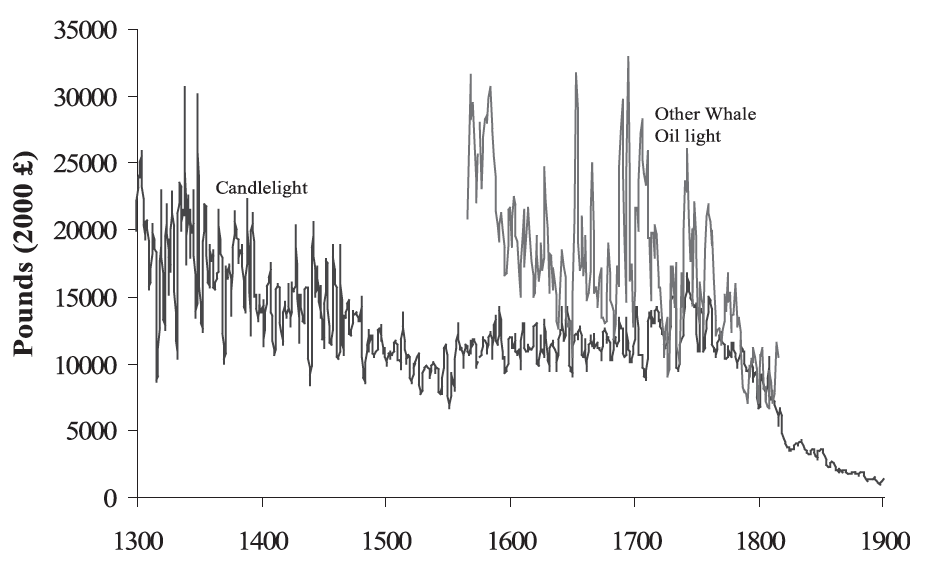
The predominant lighting technology changed hugely over these 7 centuries. According to Fouquet and Pearson there were 5 different technologies that were dominant at different points in time:
Tallow candles: Tallow candles were produced from the fat of beef or mutton and from the 14th to the 18th century tallow candles were the available source of artificial light. Compared to the very low income of people at that time the price of candles was high and this meant that candles were unaffordable for most and therefore, as the authors put it, “most people lived in near-complete darkness”. The old expression “The game isn’t worth the candle” gives insight to a time when the cost of artificial light was a big concern.
Fouquet and Pearson rely on a long list of sources to construct the time series of the price of candles in this long period. They are basing these reconstructions on the records of old English institutions, including Eton and Westminster Colleges, several Oxford and Cambridge colleges, Greenwich Hospital and the Navy.3
Gas: In the long period up to the 19th century nothing much changed and lighting stayed prohibitively expensive for most. The period of stagnation came to an end with the introduction of “town gas” which was supplied via piped distribution systems. Town gas is produced from coal, and therefore it is also referred to as ‘coal gas’. The transition from candles to town gas began in the 1810s and according to the researchers it is happening so rapidly that it was concluded by 1850. Gas lighting was attractive for several reasons: First, it was cheaper, as gas lamps are twice as efficient as candles.4 Second, gas lamps had a more pleasant light and did not emit the foul odor of burned tallow. And third, gas lamps reduced the risk of fires.5
Kerosene: Kerosene, also known as paraffin, is made from petroleum. Lamps that could burn kerosene became available in the 1860s in the UK and were cheaper than candles as soon as they became available. The lamps that could burn kerosene were also cheaper than gas lamps and in contrast to gas they did not require the high costs of installing pipes. For that reason this technology particularly benefitted the poorer households.
Electricity: With the introduction of the incandescent light bulb6 in the 1880s the ‘lighting technology’ changed again substantially. Electricity now began to compete with gas and kerosene in the market for lighting. The dominance of electricity was however not established over night and only in the 1920s did electric lighting became cheaper than gas lighting. Since then electricity is the dominant source of energy for lighting in the UK.
Compact fluorescent light bulbs: Over the course of the 20th century the incandescent light bulb and lighting efficiency changed only very little. The decline of the price of lighting in this period was driven by a decline of the price of electricity.
This period of relative stagnation in lighting technology came to an end with the introduction of compact fluorescent lights (CFLs) which are five-times more efficient than incandescent bulbs.
These developments made it possible that the per-capita consumption of lighting was 11,800-times smaller in 1800 than two centuries later (from 1,100 lumen-hours of artificial lighting per capita in 1800 to 13,000,000 lumen-hours in 2000).
Trends in the prices of energy for lighting and of lighting services, 1300-2000 – Fouquet and Pearson (2012)8
Consumption of light
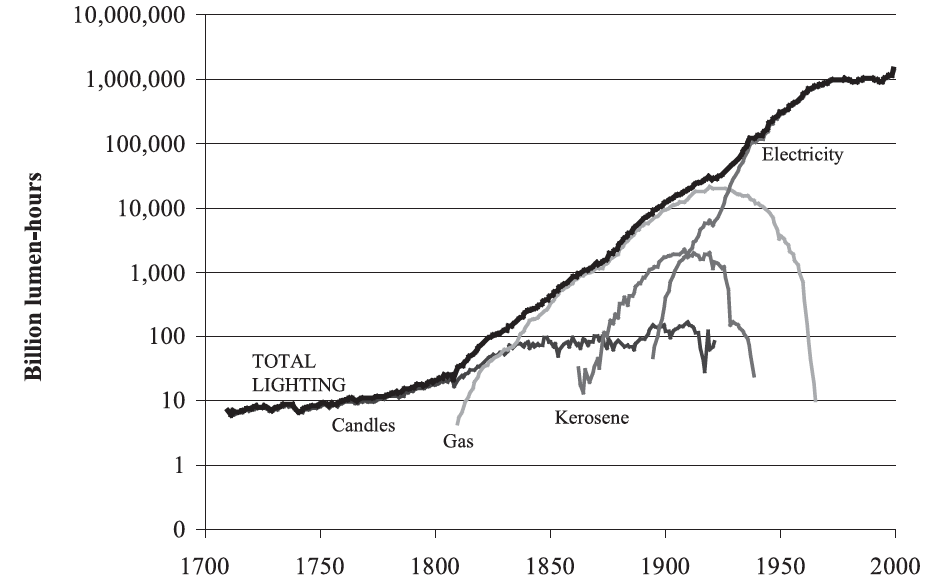
The visualization here shows the total consumption of lighting from the 18th century to today. The total consumption increased more than 100,000-fold over these three centuries in the UK. Shown is also which technologies, discussed above, became available at different times.
Consumption of lighting from candles, gas, kerosene and electricity in the United Kingdom (in billion lumen-hours), 1700-2000 – Fouquet and Pearson (2007)9
Elasticity of light consumption
Fouquet and Pearson write: “Until the mid-nineteenth century, income elasticities were about 0.7 and price elasticities about 1.2. This latter value suggests that during this period, the rebound effect was large enough to imply backfire: energy efficiency improvements led to increases in energy used for lighting. Then, between the 1840s and the 1890s income and price elasticities increased dramatically. A 10% price decrease or 10% efficiency improvement led to 17% more lighting consumption, substantially increasing energy consumption. Even more impressively, a 10% increase in per capita income appeared to generate 35% more lighting use and, all other things being constant, energy requirements. Between 1900 and 1950, income elasticity fell to unity, before dropping to between 0.25 and 0.4 at the beginning of the twenty-first century. Throughout the twentieth century, price elasticity and the rebound effect have ranged between 0.5 and 0.7, showing considerable stability.”
Global availability of artificial light
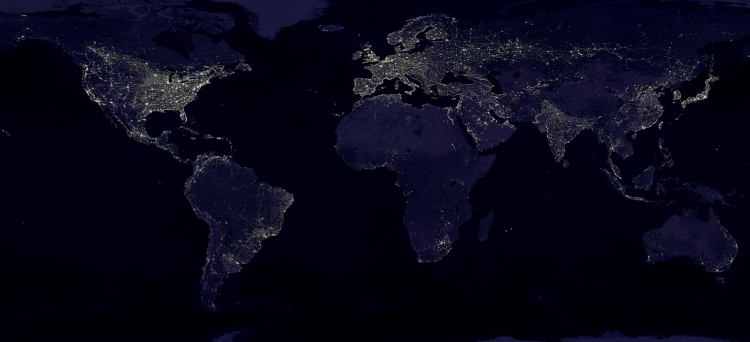
Satellite Images of the Earth at Night
The composite satellite image here shows the earth at night. It shows that richer and more densely populated parts of the world are lit up brightly at night.
Composite image of the Earth at night, 2017 – NASA10
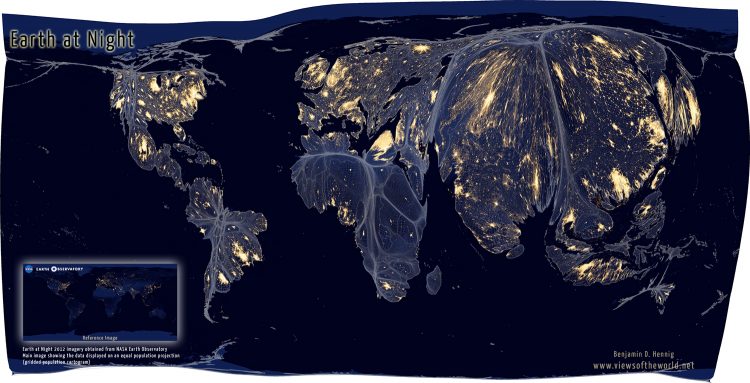
Satellite Images of the Earth at Night, adjusted for population density
In the composite image before we see areas lit up that are either more densely populated or richer or indeed both. This image distorts a similar image of the earth at night by the population density of the country’s of the world. Less densely populated countries are reduced in size, more densely populated are blown up. This way we obtain an image of the world that reveals in which parts of the world people have less or more access to light at night.
Composite image of the Earth at night, 2017 – Benjamin Hennig based on NASA11
Several papers have recently shown that light density at night reflects well standards of living. Both across geographic regions and across time. Some of these papers are:
Christopher Small & Christopher D. Elvidge (2013) – Night on Earth: Mapping decadal changes of anthropogenic night light in Asia. International Journal of Applied Earth Observation and Geoinformation. Volume 22, June 2013, Pages 40–52. Online here.
Henderson, Storeygard, and Weil (2011) – “Measuring Economic Growth from Outer Space,” American Economic Review, 102(2), 994-1028. This paper is online here.
Chen and Nordhaus (2011) – “Using Luminosity Data as a Proxy for Economic Statistics,” Proceeedings of the National Academy of Sciences, 108(21), 8589—8594.
Tilottama Ghosh, Rebecca L. Powell, Christopher D. Elvidge, Kimberly E. Baugh, Paul C. Sutton and Sharolyn Anderson (2010) – Shedding Light on the Global Distribution of Economic Activity. The Open Geography Journal, 2010, 3, 147-160 147.
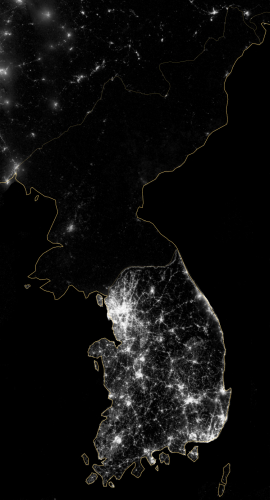
Striking is the difference between North and South Korea by night shown in the satellite image here. It illustrates the point about the correlation between night time light and living conditions in terms of health, food provision, and poverty.
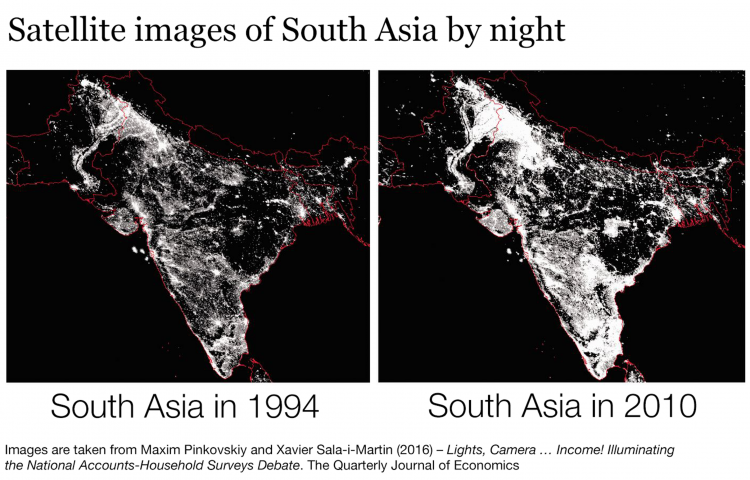
Change of night light over time to measure poverty
As a country develops the luxury of having light at night becomes available to more and more people. This simple fact was used by Maxim Pinkovskiy and Xavier Sala-i-Martin to study how poverty levels changed by studying how nighttime light – visible in satellite images – changed over time. The comparison of South Asia in 1994 and 2010 is taken from their study published in the Quarterly Journal of Economics in 2016.13 NASA’s Visible Earth catalog, online here, is a great source for night images of the earth.