Draft version
We are currently working on a dataset of war and large-scale violent events over the long run. If you want to contribute to this research please get in touch.
This entry presents an empirical perspective on the history of war and peace. We also published a data visualization history of human violence here on OurWorldInData.org which presents empirical data showing that we are now living in the most peaceful time in our species’ existence.
All our charts on War and Peace
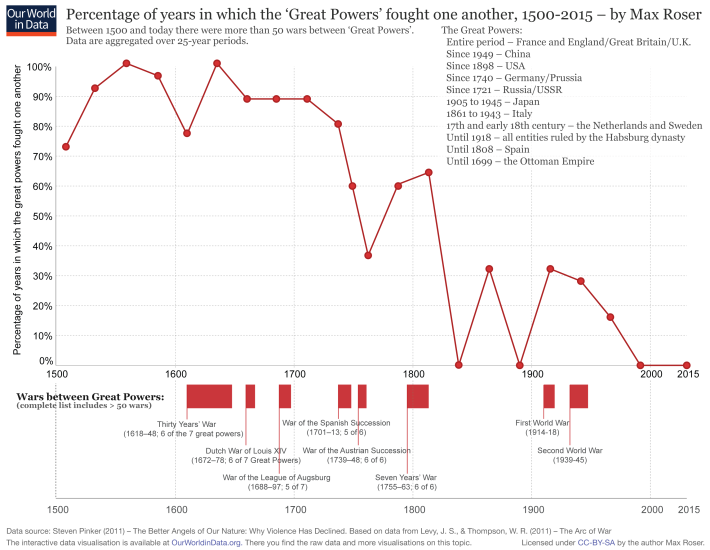
It would be wrong to believe that the past was peaceful. One reason why some people might have this impression is that many of the past conflicts feature less prominently in our memories; they are simply forgotten.
Percentage of years in which the ‘Great Powers’ fought one another, 1500-20151
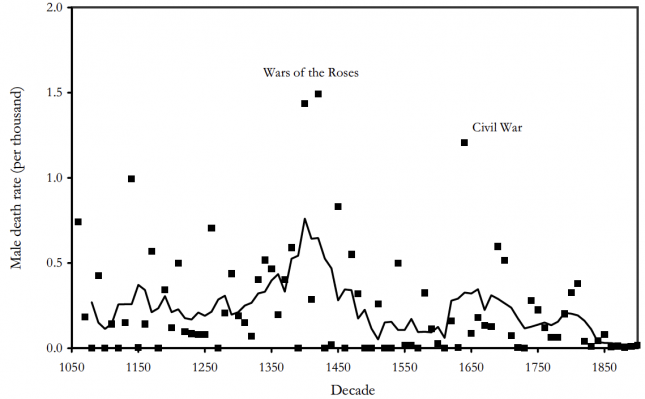
Death rates from military conflicts in England, 1170s-1900s – Clark (2008)2
CLICK HERE to see the infographic in more detail.
‘The 100 Worst Atrocities’ over the last millennia – New York Times3
![The 100 Worst Atrocities over the last Millennia - New York Times [Data from Matthew White]0](https://nightingale-owid.netlify.app/uploads/2013/08/The-100-Worst-Atrocities-over-the-last-Millennia-New-York-Times-Data-from-Matthew-White0-379x500.png)
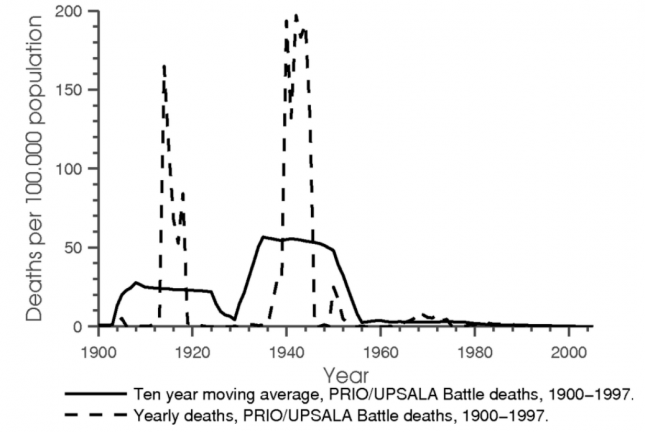
International battle deaths per 100,000 people, 20th Century – Acemoglu (2012)4
The absolute number of war deaths has been declining since 1946. In some years in the early post-war era, around half a million people died through direct violence in wars; in contrast, in 2016 the number of all battle-related deaths in conflicts involving at least one state was 87,432.
The decline of the absolute number of battle deaths can be seen in the visualization here that shows global battle deaths per year by world region. There are three marked peaks in war deaths since then: the Korean War (early 1950s), the Vietnam War (around 1970), and the Iran-Iraq and Afghanistan wars (1980s). There has been a recent increase in battle deaths driven by conflict in the Middle East, particularly in Syria, Iraq and Afghanistan.
Battle-related deaths in state-based conflicts since 1946, by world region

Other forms of large-scale violence
The chart above refers only to battle deaths occurring in conflicts that involved at least one state on one of the opposing sides. For more recent years, we show these ‘state-based’ conflict deaths alongside battle deaths in ‘non-state’ conflicts (where two or more organisations are fighting but no state is involved), and also violent deaths in ‘one-sided violence’ (where there is only one organised aggressor, such as in genocidal violence).
We see that, in recent years, state-based conflicts form the majority of such deaths, though the genocide in Rwanda in 1994 stands out for its very high death-toll.
Violent deaths in conflicts and one-sided violence since 1989

The previous two graphs showed absolute numbers, but as the world has seen rapid population growth (see our entry on global population growth), it is more appropriate to look at relative numbers. Here we show the battle death in state-based conflicts per 100,000 people per year. The figures are shown by type of conflict.
Rate of battle deaths in state-based conflicts by type of conflict, since 1946

The stacked area chart here shows the number of ongoing conflicts each year has risen. This increase however only relates to civil conflicts within states. Conflicts related to the expansion or defence of colonial empires ended with decolonisation. Conflicts between states have almost ceased to exist.
But the number of war victims varies hugely between different wars: whereas 1,200,000 died during the the Korean War (1950–1953), other wars had ‘just’ 1,000 victims. For this reason, statistics on the number of wars need to be interpreted alongside data on the size of these conflicts.
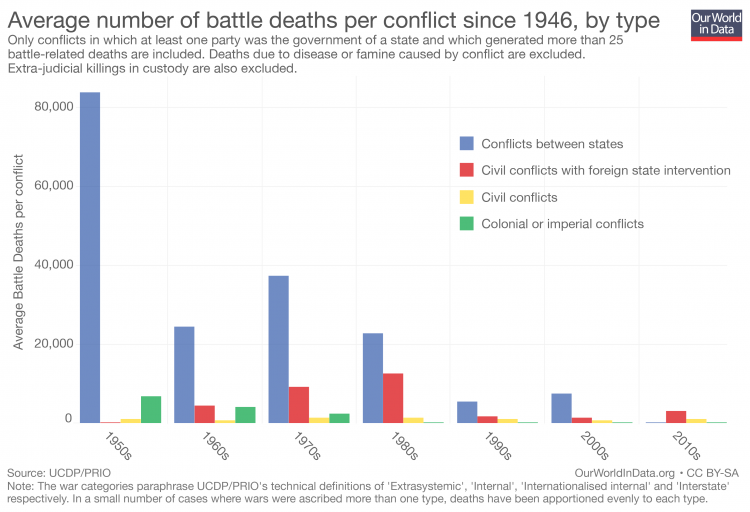
The increase in the number of wars is predominantly an increase of smaller and smaller conflicts. This follows from the previously shown facts that the number of war victims declined while the number of conflicts increased. The decreasing deadliness of conflicts can be seen in the bar chart.
Number of state-based conflicts by type, since 1946

Deadliness of wars – average battle deaths per conflict by decade, 1950-2016
Counting world conflict deaths: why do sources differ?
To answer the question of how many people die in conflicts today, and how this has changed over time, we can turn to a number of different datasets.
Here we show the world conflict death rate since 1989 according to five sources.
There are certainly similarities across the different sources. Overall they show a decline in conflict deaths into the 2000s, followed by an increase this decade.5
But there are also large differences. Most noticeably, there is a large jump in 1994 – marking the Rwandan genocide – which is present in some series, but absent from others.
If you look closely, you’ll see that there are large relative differences between the series over the entire period as well, though they are understated by the 1994 peak. If you hover over the datapoints, you can see the exact figures: the highest figure for a given year is typically well more than double the lowest.

Discrepancies between different sources of conflict deaths data are partly to do with the differences in how the underlying source information – for instance newswires, death registers, government or NGO reports, or indeed other conflict databases – are selected and interpreted.
But they also reflect conceptual differences in terms of which deaths are and aren’t included in the source’s definition.
We’ve summarised more information about the data sources and how we handled them to produce the chart above in a document, World conflict deaths since 1989: Notes on five sources.
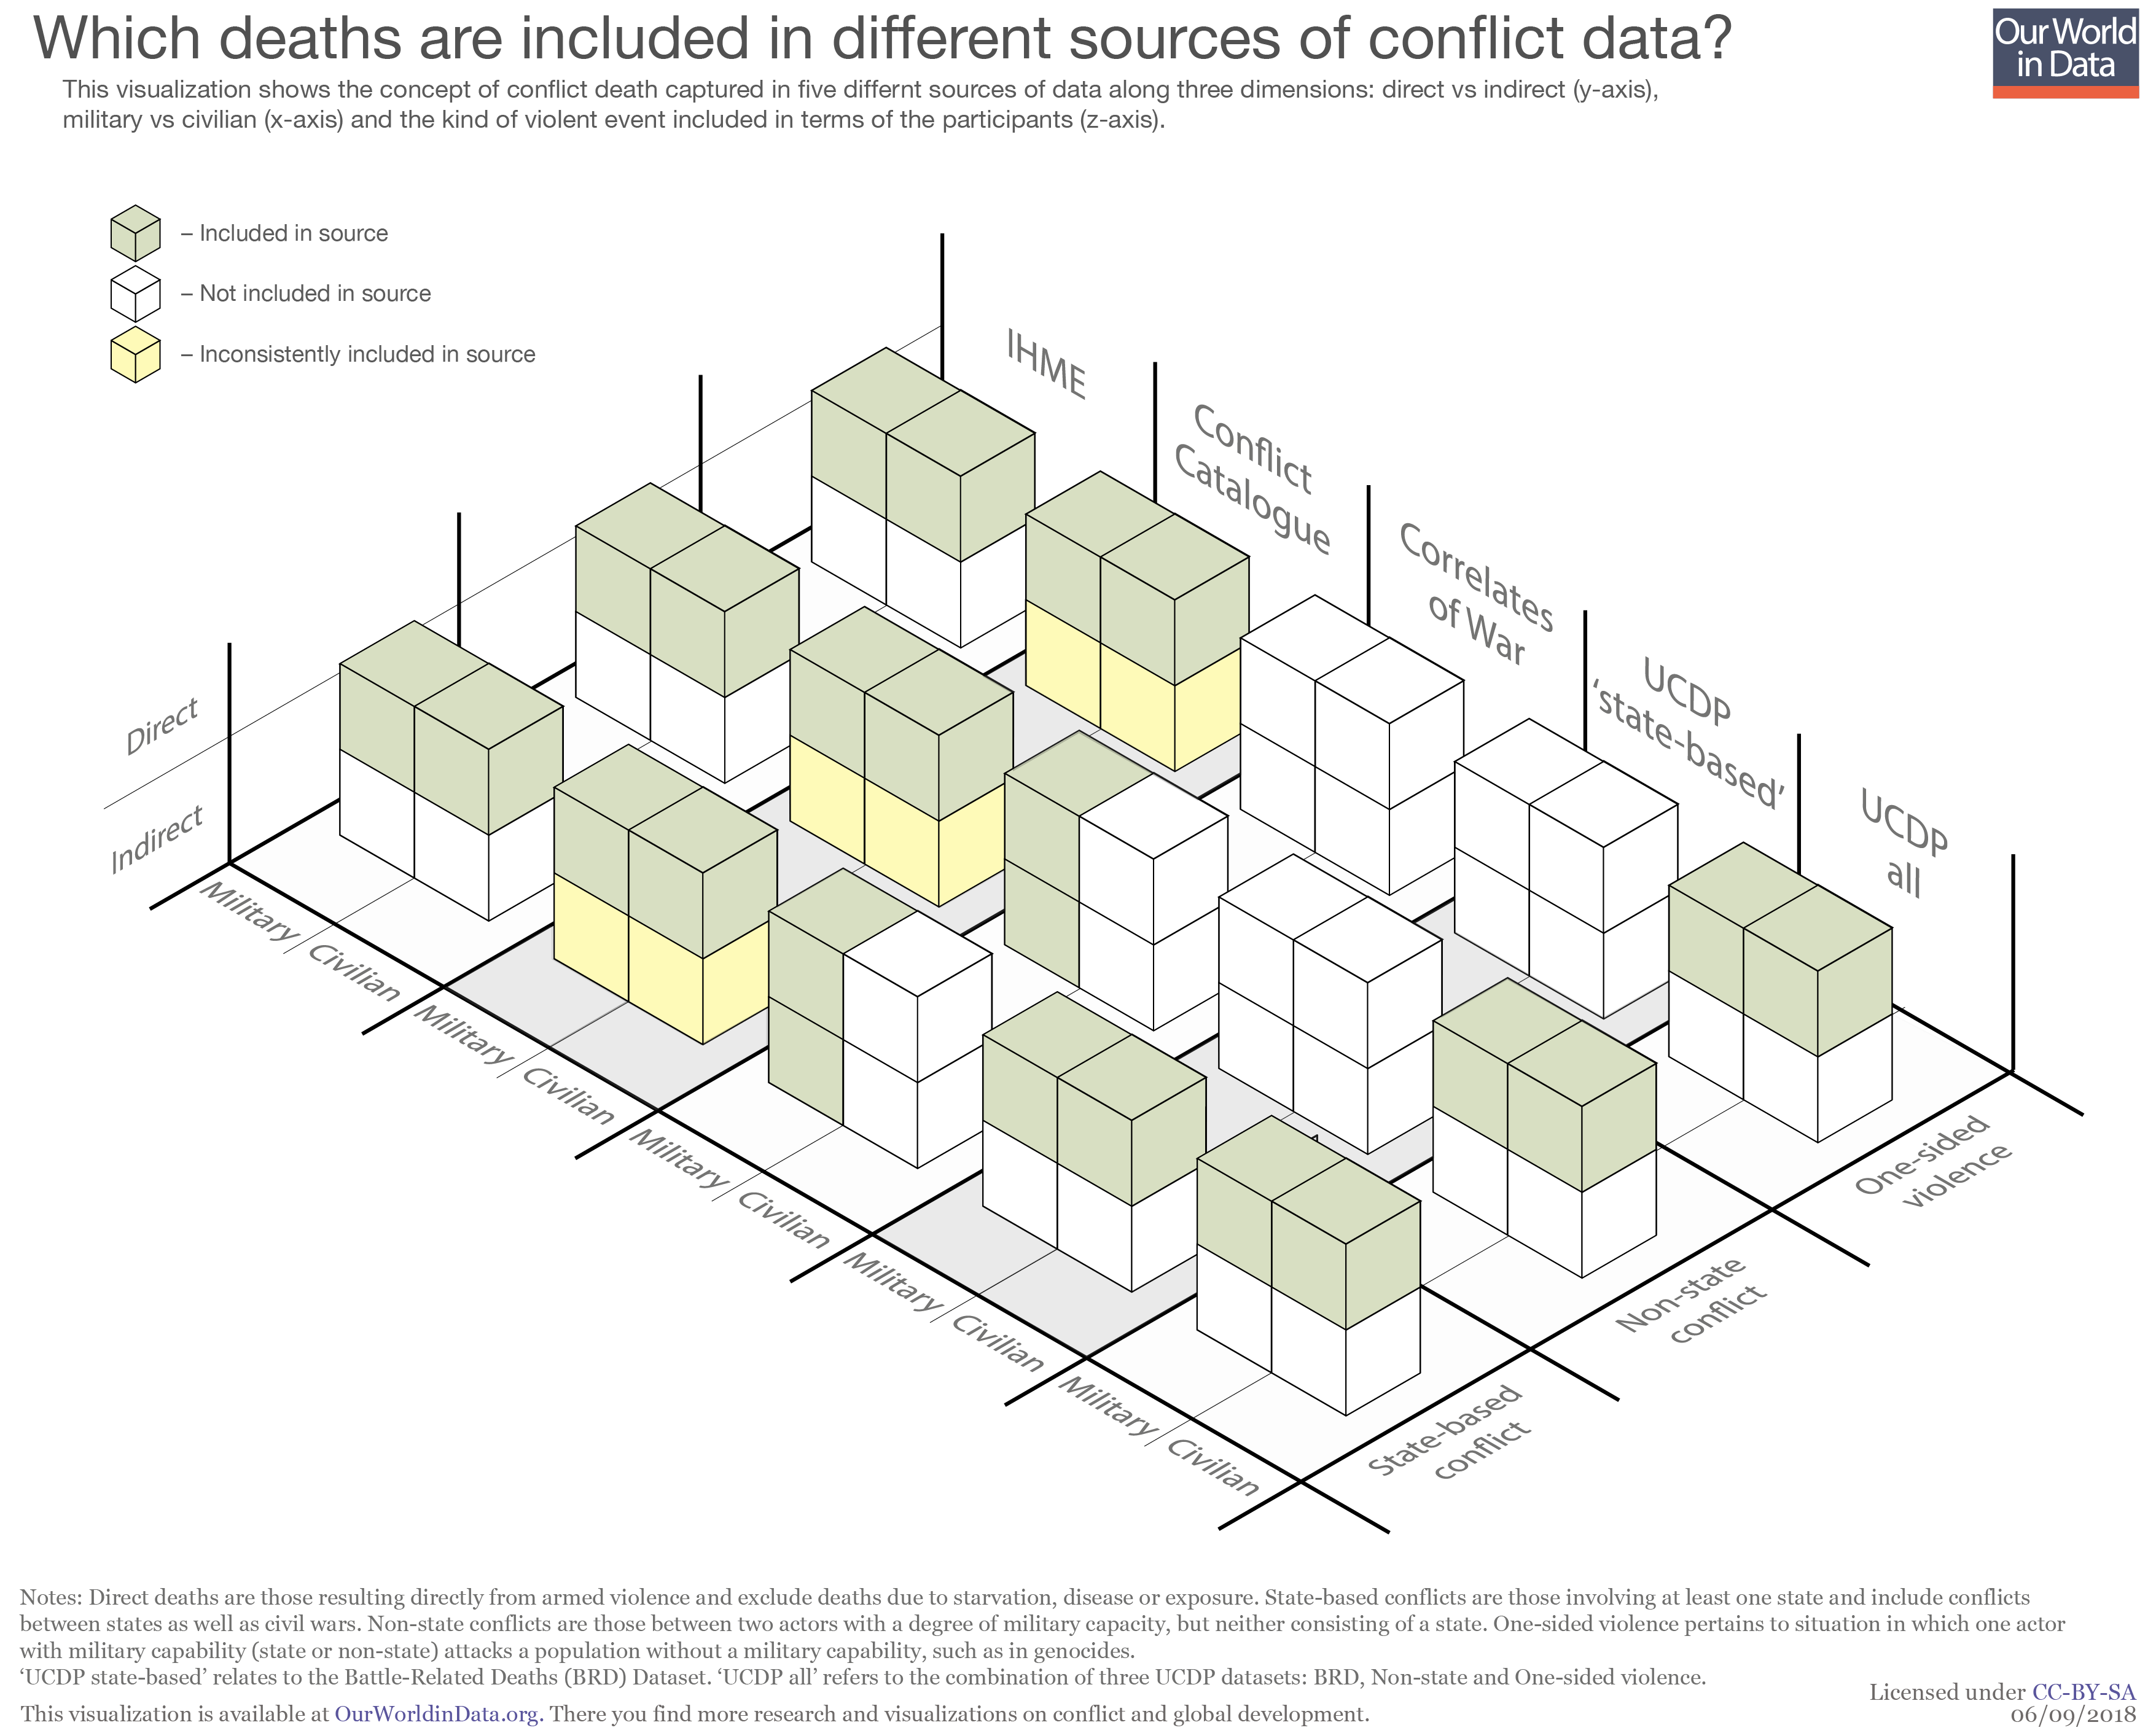
Below we relate some of the differences visible in the chart above in terms of some key conceptual differences lying along three dimensions: Who, How and What.
Who: civillian vs military deaths
The Correlates of War series aims to include only deaths of military personnel, whereas the other sources capture – at least to some extent – civilian deaths too. As we would expect then, the Correlates of War figures are generally lower than the others.
How: direct vs indirect deaths
In addition to those deaths caused directly by violence – for instance those from gunshot or explosions – a significant proportion of lives lost in conflict are indirect, due to disease, starvation or exposure. This is particularly true where conflicts lead to famine or outbreaks of disease among the civilian population. But historically, such indirect deaths were also a major cause of military fatalities.6
The UCDP and IHME data include only direct deaths. The Correlates of War series includes military personnel that died from diseases ‘contracted in the war theatre’. The Conflict Catalogue series (running to 2000 only) tries to include indirect deaths of both the military and civilian populations. Peter Brecke, the author of the dataset, however acknowledges that the degree to which this is in fact achieved varies considerably across conflicts.7
While indirect deaths represent a substantial proportion of the social costs of conflict, there is a conceptual difficulty in drawing a consistent boundary between indirect deaths attributable to the conflict and those due to other factors. For instance, whilst famines are often triggered by conflicts, many factors contribute to their onset and severity, such as the level of sanitation or the transportation infrastructure present.
Brecke does not attempt to provide a clear-cut definition, and this conceptual boundary has been largely dictated by the available primary sources he used in each estimate. Nevertheless, as we would expect, the death rates reported in the Conflict Catalogue do come out the highest.
What: state involvement and one-sided violence
Across the various sources there three broad kinds of violent event distinguished: state-based conflict, non-state conflict and one-sided violence. The kind of event depends on the type of actors involved. State-based conflict is that involving at least one state-actor, and includes conflicts between states (“inter-state” conflicts) and those between a state and non-state actor (“extra-state” conflicts), such as civil wars or colonial wars.
Non-state actors are those that demonstrate a degree of coordinated military organisation but whose identity falls short of statehood. Non-state conflicts are those between two or more non-state actors, with no state involvement.
‘One-sided violence’ on the other hand is where one organized actor (either a state or non-state group) attacks people that do not have any organized military capability to defend themselves, as in the case of genocide or ‘politicide‘.
The UCDP state-based and Correlates of War series do not include such events. It is for this reason that they do not show the jump in 1994 that marks the Rwandan genocide.
Here we picture the definitions used in the various sources across these three dimensions.
Long run perspective
- Data: Armed conflict data
- Geographical coverage: Global
- Time span: 1948-2008
- Available at: Online here
- Data: 3708 conflicts, data on parties, fatalities, date and duration
- Geographical coverage: Global
- Time span: 1400 CE to present
- Available at: Online at Clio Infra
- Notes: A list of ‘Dictionaries or Encyclopedias of Wars and Battles’ is presented by Peter Brecke in his article ‘The Long-Term Patterns of Violent Conflict in Different Regions of the World’.8
After 1945
There are two major projects that gather on wars on a global scale for the post-war period and make their finding publicly available:
1. The Correlates of War Project
2. The PRIO, UCDP & Human Security Reports PRIO and UCDP collaborate to build the data set on wars. This data set is the base for the annual publication of the Human Security Project and for most of the data in this post.
Peace Research Institute of Oslo (PRIO)
Uppsala Conflict Data Program (UCDP)
Human Security Report Project
Data on on civil conflicts for the period 1945–99 was collected by Fearon and Laitin and can be found here.