As I have shown before, there are large differences in the carbon footprint of different foods. Beef and lamb, in particular, have much higher greenhouse gas emissions than chicken,pork, or plant-based alternatives.
This data suggests that the most effective way to reduce the climate impact of your diet is to eat less meat overall, especially red meat and dairy (see here).
In this post I want to investigate whether these conclusions depend on the particular metric we rely on to quantify greenhouse gas (GHG) emissions. It could be argued that red meat and dairy have a much higher footprint because its emissions are dominated by methane – a greenhouse gas that is much more potent but has a shorter lifetime in the atmosphere than carbon dioxide. Methane emissions have so far driven a significant amount of warming – with estimates ranging from around 23% to 40% of the total – to date.1
In the box at the end of this article I discuss the debate on emissions metrics and the treatment of methane in more detail. But, here, I’ll keep it short:
Since there are many different greenhouse gases researchers often aggregate them into a common unit of measurement when they want to make comparisons.2 The most common way to do this is to rely on a metric called ‘carbon dioxide-equivalents’. This is the metric adopted by the Intergovernmental Panel on Climate Change (IPCC); and is used as the official reporting and target-setting metric within the Paris Agreement.3
‘Carbon dioxide-equivalents’ (CO2eq) aggregate the impacts of all greenhouse gases into a single metric using ‘global warming potential’. More specifically, global warming potential over a 100-year timescale (GWP100) – a timeframe which represents a mid-to-long term period for climate policy.
To calculate CO2eq one needs to multiply the amount of each greenhouse gas emissions by its GWP100 value – a value which aims to represent the amount of warming that each specific gas generates relative to CO2. For example, the IPCC adopts a GWP100 value of 28 for methane based on the rationale that emitting one kilogram of methane will have 28 times the warming impact over 100 years as one kilogram of CO2.4
To understand why the conversion factor of 28 is criticised one needs to know that different greenhouse gases remain in the atmosphere for different lengths of time. In contrast to CO2, methane is a short-lived greenhouse gas. It has a very strong impact on warming in the short-term but decays fast. This is in contrast to CO2 which can persist in the atmosphere for many centuries.5 Methane therefore has a high impact on warming in the short term, but a low impact in the long run. This means there is often confusion as to how we should quantify the climate impacts of methane.
Researchers therefore develop new metrics and methods with the aim to provide a closer representation of the warming potential of different gases.
Michelle Cain, Myles Allen and colleagues at the the University of Oxford’s Martin School lead a research programme on climate pollutants, which takes on this challenge. Dr Michelle Cain, one of the lead researchers in this area, discusses the challenges of GHG metrics and the role of a new way of using GWP which accounts for methane’s shorter lifetime (called GWP*), in an article in Carbon Brief here.
Methane’s shorter lifetime means that the usual CO2-equivalence does not reflect how it affects global temperatures. So CO2eq footprints of foods which generate a high proportion of methane emissions – mainly beef and lamb – don’t by definition reflect their short-term or long-term impact on temperature.
The question then is: Do these measurement issues matter for the carbon footprint of different foods? Are the large differences only because of methane?
In the visualization I compare the global average footprint of different food products, with and without including methane emissions.6
As in my original post, this data is sourced from the largest meta-analysis of global food systems to date, by Joseph Poore and Thomas Nemecek (2018), published in the journal Science.7 The study looks at the environmental impacts of foods across more than 38,000 commercially viable farms in 119 countries.
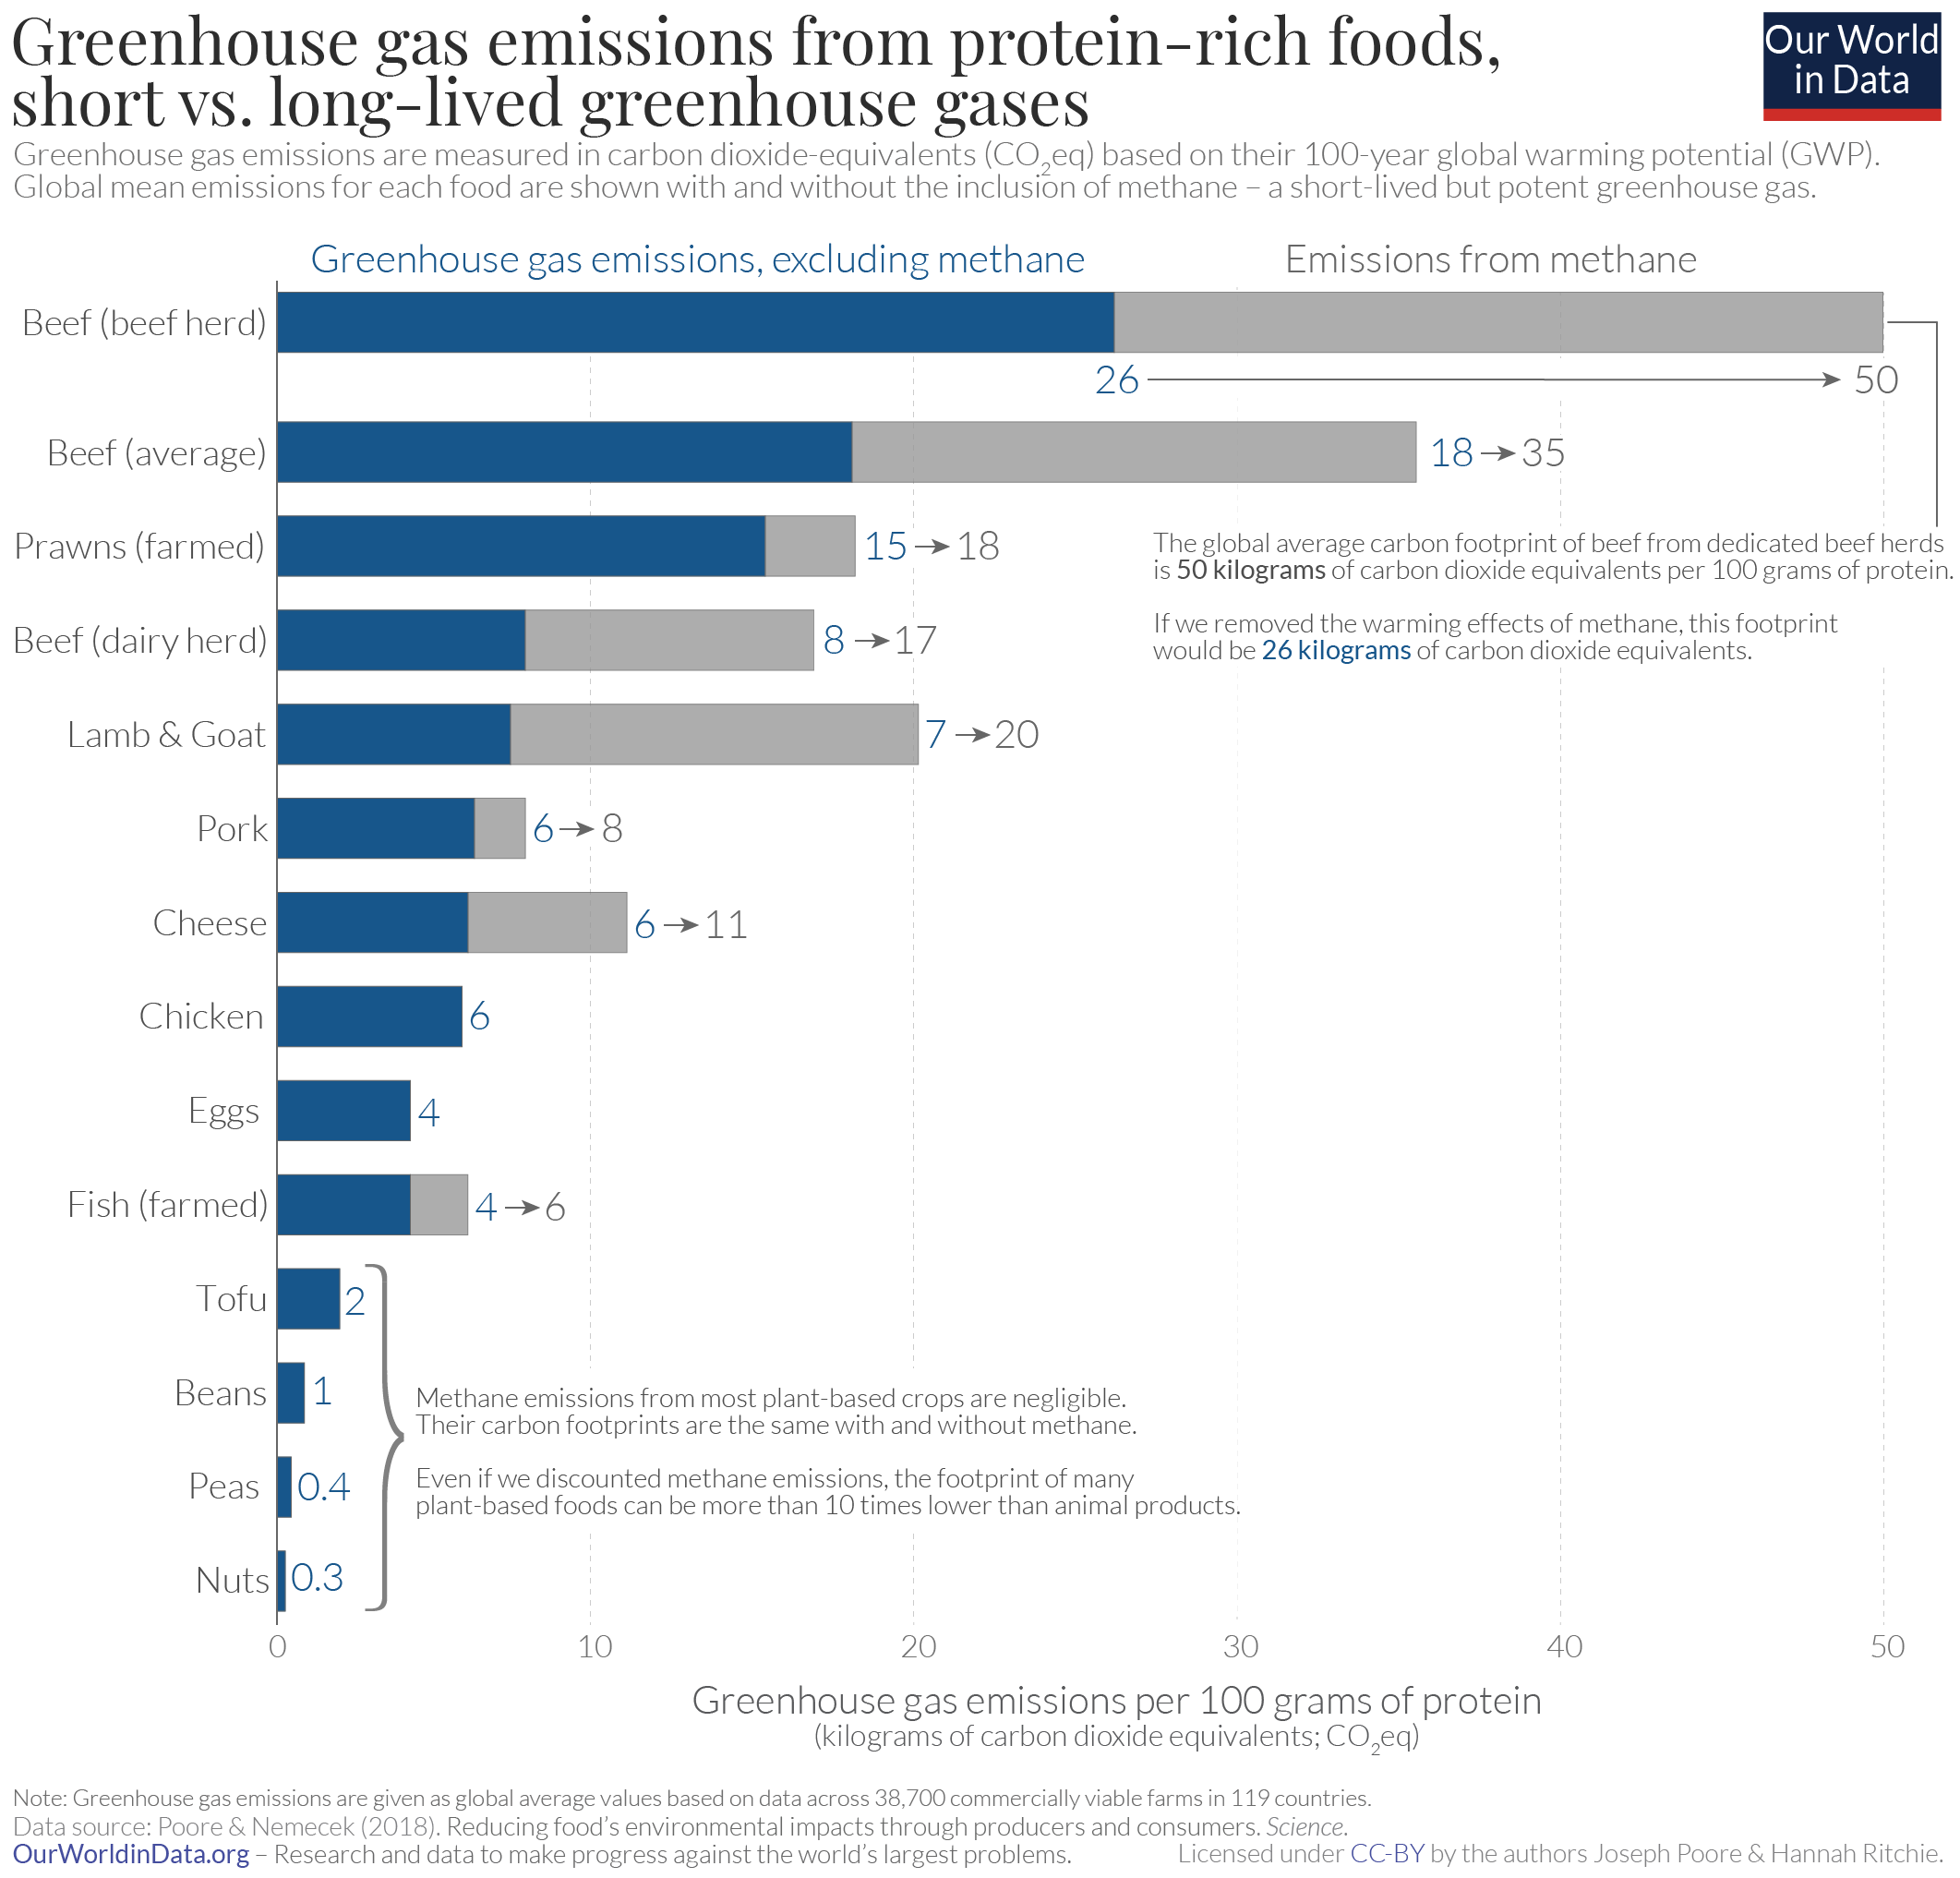
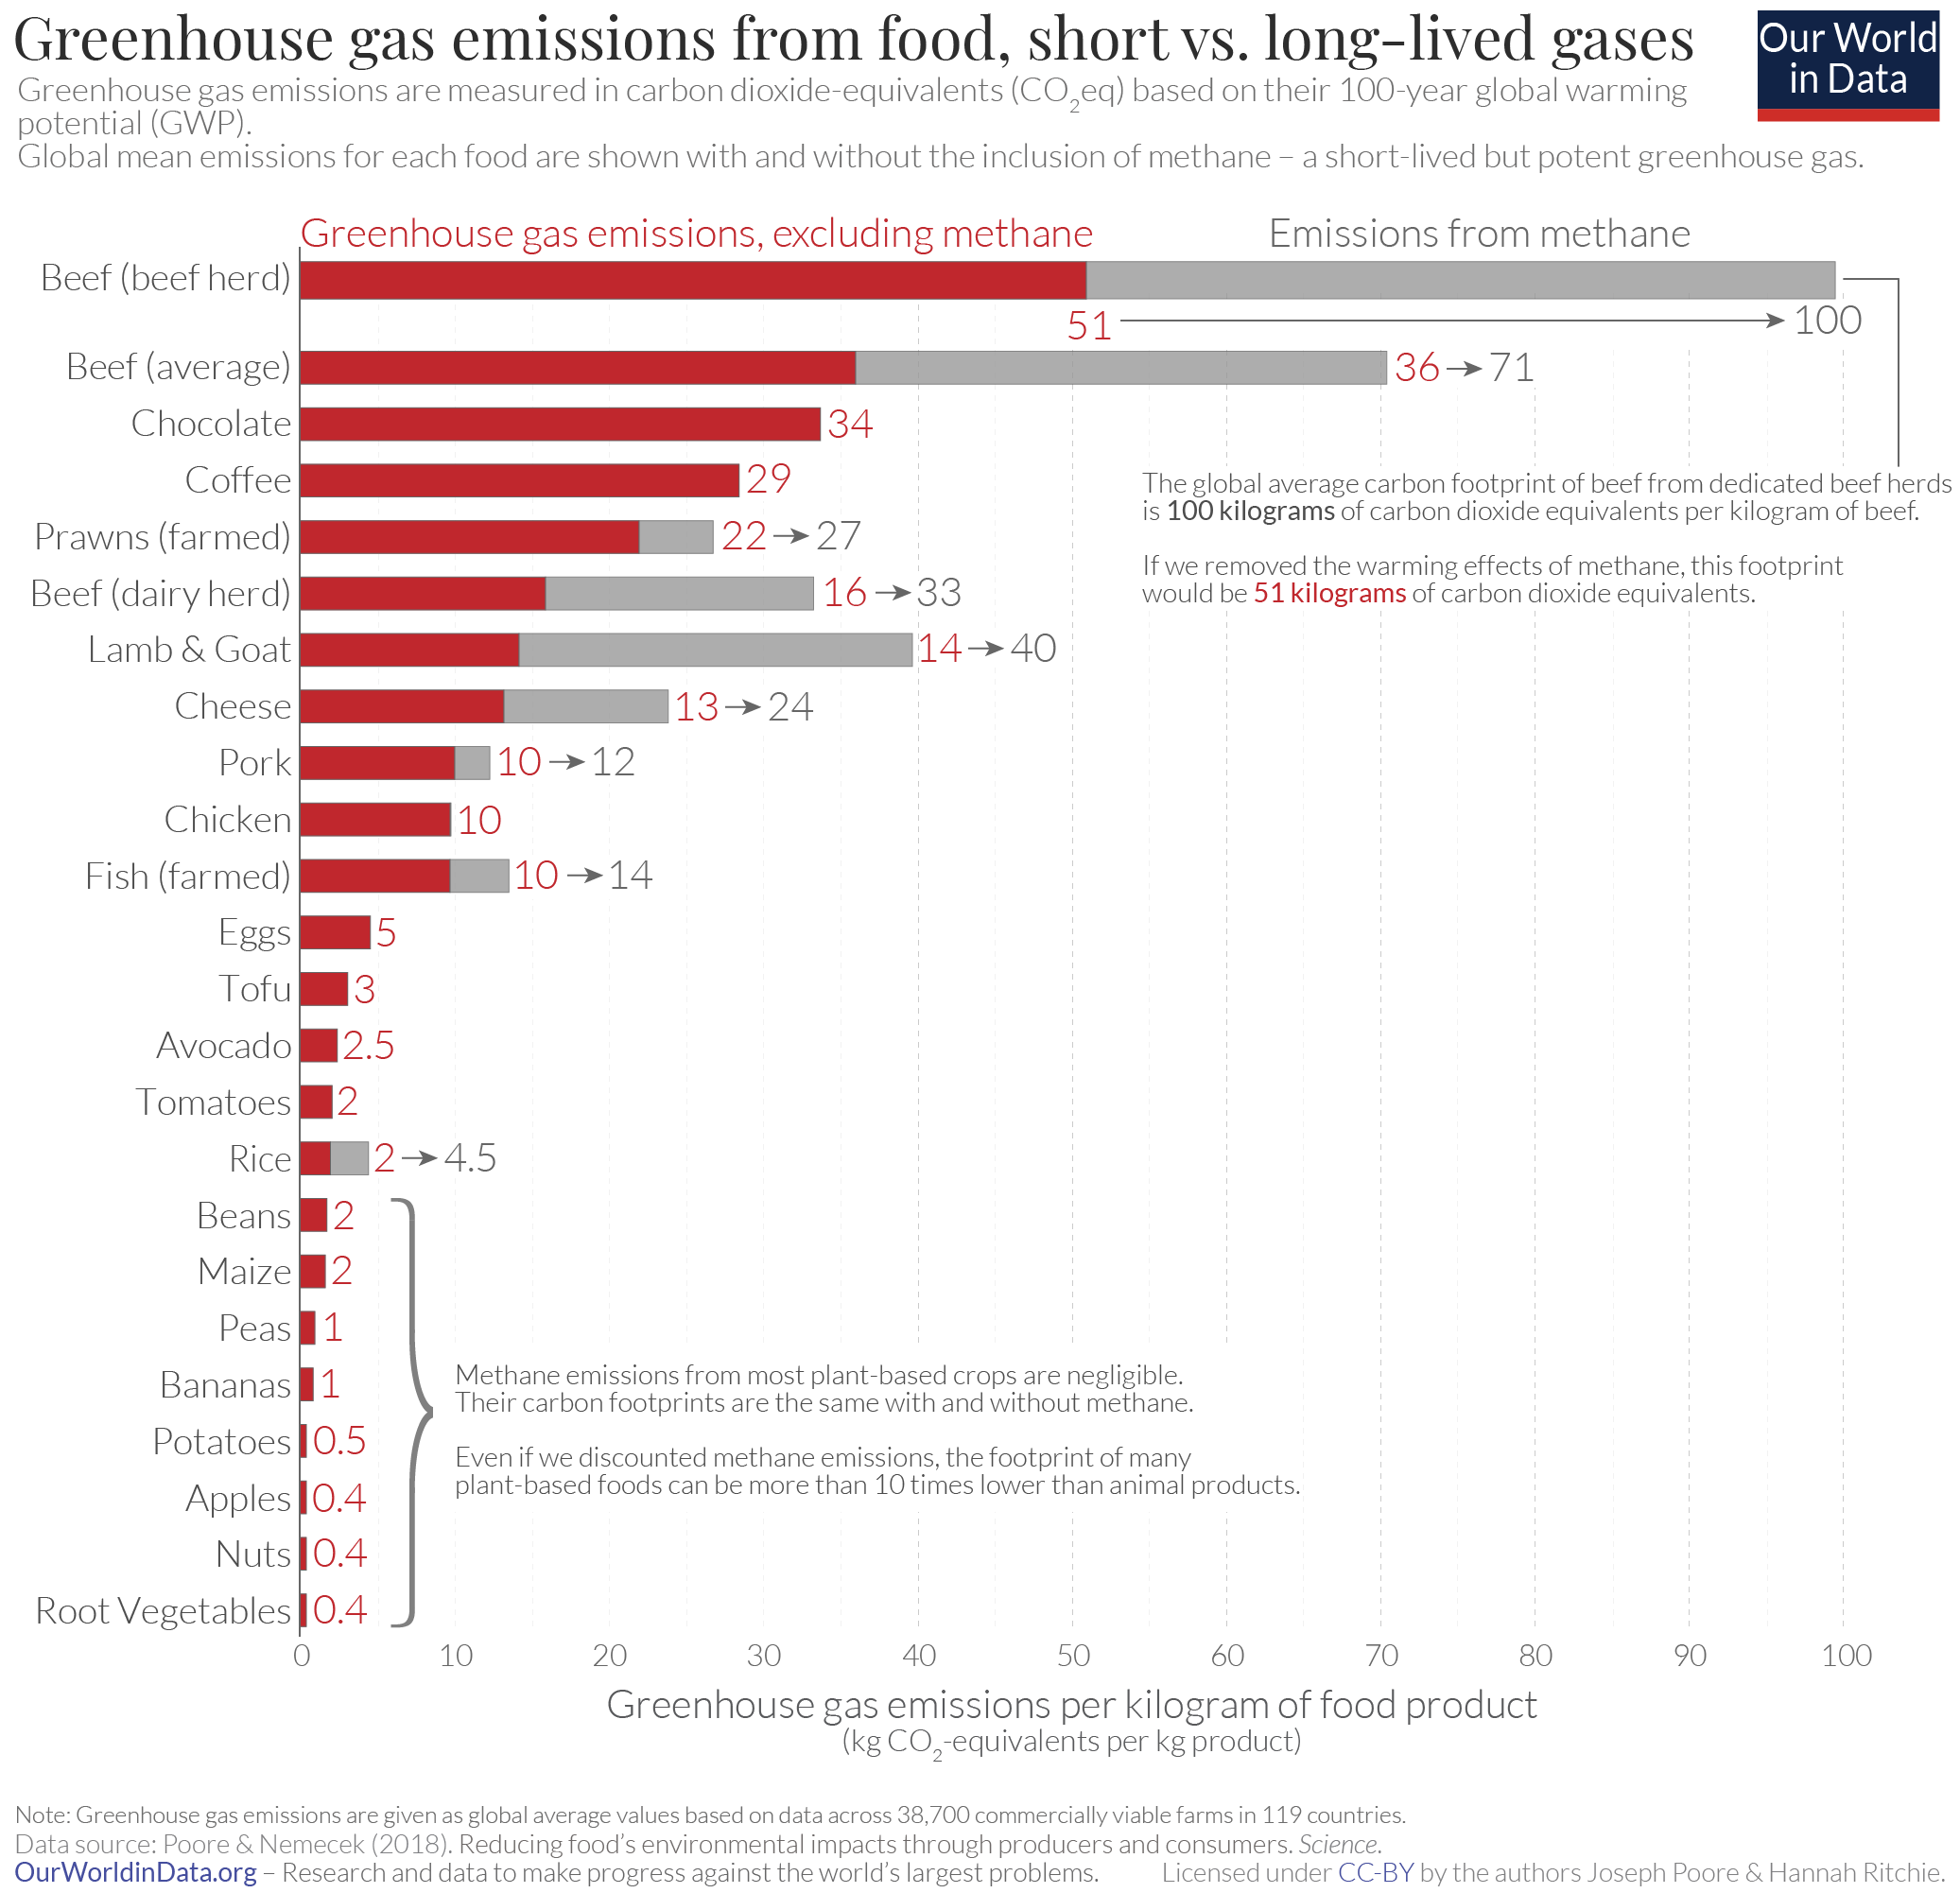
This chart compares emissions in kilograms of CO2eq produced per kilogram of food product.
The red bars show greenhouse emissions we would have if we removed methane completely; the grey bar shows the emissions from methane. The red and grey bar combined is therefore the total emissions including methane.
As an example: the global mean emissions for one kilogram of beef from non-dairy beef herds is 100 kilograms of CO2eq. Methane accounts for 49% of its emissions. So, if we remove methane, the remaining footprint is 51 kgCO2eq (shown in red).
As we see, methane emissions are large for beef and lamb. This is because cattle and lamb are what we call ‘ruminants’, in the process of digesting food they produce a lot of methane. If we removed methane their emissions would fall by around half. It also matters a lot for dairy production, and a reasonable amount for farmed shrimps and fish.
This is not the case for plant-based foods, with the exception of rice. Paddy rice is typically grown in flooded fields: the microbes in these waterlogged soils produce methane.
This means that beef, lamb and dairy products are particularly sensitive to how we treat methane in our metrics of greenhouse gas emissions. Few would argue that we should eliminate methane completely, but, as explained, there is an ongoing debate as to how to weigh the methane emissions – whether the grey bar should shrink or grow in these comparisons.
So is it true that red meat and dairy only has a large carbon footprint because of methane? As the red bars show it is not.
Although the magnitude of the differences change, the ranking of different food products does not.
The differences are still large. The average footprint of beef, excluding methane, is 36 kilograms of CO2eq per kilogram. This is still nearly four times the mean footprint of chicken. Or 10 to 100 times the footprint of most plant-based foods.
Where do the non-methane emissions from cattle and lamb come from? For most producers the key emissions sources are due land use changes; the conversion of peat soils to agriculture; the land required to grow animal feed; the pasture management (including liming, fertilizing, and irrigation); and the emissions from slaughter waste.
What about the impact of producers who are not raising livestock on converted land? Do they have a low footprint? In our related article I look in detail at the distribution of GHG emissions for each product, from the lowest to highest emitters. When we exclude methane, the absolute lowest beef producer in this large global dataset of 38,000 farms in 119 countries had a footprint of 6 kilograms of CO2eq per kilogram. Emissions in this case were the result of nitrous oxide from manure; machinery and equipment; transport of cows to slaughter; emissions from slaughter; and food waste (which can be high for fresh meat). 6 kilograms of CO2eq (excluding methane) is of course much lower than the average for beef, but still several times higher than most plant-based foods.
Is it perhaps misleading to compare foods on the basis of mass? After all one kilogram of beef does not have the same nutritional value as one kilogram of tofu.
In the other visualization I therefore show these comparisons as the carbon footprint per 100 grams of protein. Again, emissions from methane are shown in grey; but this time, emissions excluding methane are shown in blue.
The results are again similar: even if we excluded methane completely, the footprint of lamb or beef from dairy herds is five times higher than tofu; ten times higher than beans; and more than twenty times higher than peas for the same amount of protein.
The weight we give to methane matters for the magnitude of the differences in carbon footprint we see between food products. However, it doesn’t change the general conclusion: meat and dairy products still top the list, and the differences between foods remain large.