How many of the world’s children live in extreme poverty? A recent study by the World Bank tries to answer this question. This is a new and insightful exercise, since World Bank estimates are not usually disaggregated by population groups.
The short answer is that about 20% of children under age 18 live on less than $1.90 per day in low and middle income countries. This corresponds to about 385 million children. Below we discuss the evidence in more detail.
The World Bank Group has recently published a new set of poverty estimates, as part of their report Poverty and Shared Prosperity (2016). These estimates, explained in detail in Newhouse et al. (2016),1 are consistent with the official World Bank poverty figures published in Povcal and the World Development Indicators, but they are disaggregated by key demographic characteristics such as age and educational attainment.
In order to produce disaggregated estimates, the World Bank relied on new data from the Global Micro Database – an instrument that augments survey data in 89 countries, by providing a set of harmonized household characteristics, enriching the other survey instruments used by the World Bank to measure poverty.
According to Newhouse et al. (2016), the sample of 89 countries included in the Global Micro Database contains an estimated 84.2 percent of the population in low and middle income countries, and 82.1 percent of the child population.2 In this map you can see exactly which territories are covered. As the authors point out, this new set of estimates is the most updated and comprehensive source currently available to researchers and policymakers trying to understand the demographics of poverty, including child poverty – the focus of this blog post.
Children are considered to live in extreme poverty if they live in an extremely poor household (i.e. all children in poor households are assumed to be poor, while all children in non-poor households are assumed to be non-poor). A household is considered extremely poor, in turn, if the per capita consumption of its members (or per capita income, depending on the country), is less than the International Poverty Line of 1.90 international dollars (int-$). This is the standard definition of absolute extreme poverty used by the World Bank, and it accounts for non-market sources of welfare, as well as for the fact that people in different countries face different price levels (the latter being captured by the so-called ‘international dollar’ metric). You can read more about how the World Bank measures poverty in our related blog post here.
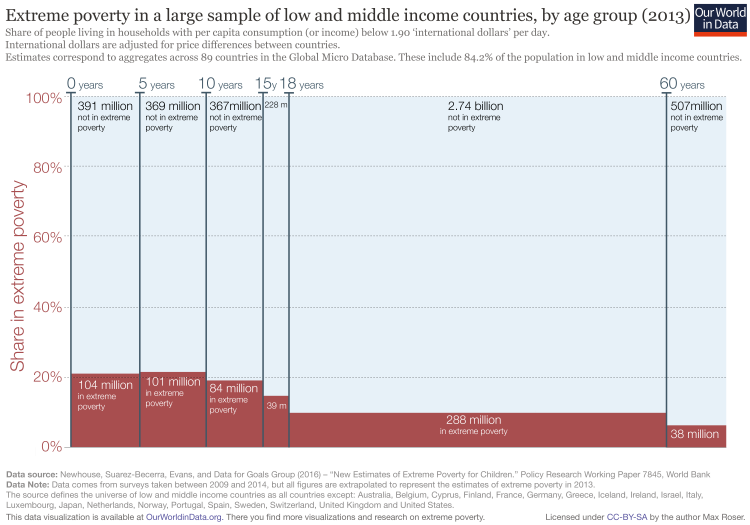
The following chart provides an overview of the data. The height of each bar in this plot shows the incidence of poverty by age group (i.e. the poverty headcount rate for each age bracket), while the width of the bars reflects the total size of each age group in the overall population. The area of each bar (hight times width) gives the number of individuals living in extreme poverty within each age bracket – these are the numbers written inside each bar.
All estimates correspond to aggregates across the set of 89 countries included in the Global Micro Database. As already mentioned, these countries cover 84.2 percent of the population in low and middle income countries.3
As we can see, extreme poverty is higher among the world’s children than among the world’s adult population: in low and middle income countries more than 20% of children under 10 years of age live with less than 1.90 int-$ per day. For adults, the corresponding figures are much lower: less than 10% of adults live with comparably low consumption levels.
By looking at the total number of people in extreme poverty (area of the bars) we can also see another important fact: virtually half of the people living in extreme poverty are under 18 years of age. This is large if we consider that those under 18 account for only around a third of the general population (width of the bars).
The data from the Global Micro Database allows us to study poverty across age groups for various poverty lines – not just the extreme 1.90 int-$ poverty line.
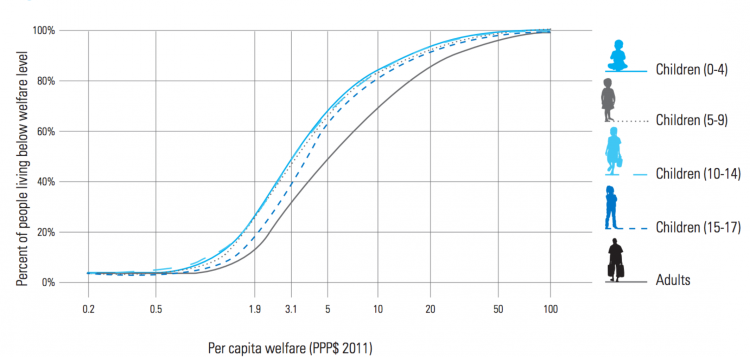
The following chart shows the cumulative distribution of welfare for different age groups. Each of the lines in this plot shows, for a different age group, the share of the population living below a given level of per capita income or consumption (after accounting for differences in prices across countries, here noted in $PPP units – a twin concept to ‘international dollars’).
From this graph, we can read the same numbers we have already discussed. If you locate the vertical line passing through $1.90 in the horizontal axis, you will see that it cuts the series for adults at around 9%. This means that around 9% of the adult population lives with consumption (or income) levels below the 1.90 int-$ poverty line. Following this logic, we can read the poverty rates at any poverty line.
As we can see, the distribution of consumption for adults is always to the right of the distribution for children. In economics lingo, what we observe is that the distribution for adults stochastically dominates that of children. This means that poverty rates for children are higher at any poverty line.
It’s important to mention that these results are not reflecting the fact that adults tend to generate more income than children. Bear in mind that these are estimates of household per capita income. That means that children living in households with rich adults are also assumed to be rich.