Notice: This is only a preliminary collection of relevant material
The data and research currently presented here is a preliminary collection or relevant material. We will further develop our work on this topic in the future (to cover it in the same detail as for example our entry on World Population Growth).
If you have expertise in this area and would like to contribute, apply here to join us as a researcher.
This entry is currently being updated and extended. Below is a draft version that may contain some inconsistencies (June 2019).
A democracy is a political system with institutions that allows citizens to express their political preferences, has constraints on the power of the executive, and provides a guarantee of civil liberties. In an autocracy, political preferences cannot be expressed and citizens are not guaranteed civil liberties. Anocracies (a term we’ll often use in this entry) are regimes that fall in between — they are neither fully autocratic nor democratic.
This entry presents the empirical research on the slow rise of democracy over the last two centuries.
The majority of the world’s countries are now democracies. The chart here depicts the slow rise of the number of democracies over the last two centuries.
The end of World War I led to the birth of many democracies. However, during the 1930s, many of these young democracies then reverted to being autocratic.
After World War II, the number of democracies began growing again. But it was the fall of the Iron Curtain circa 1989 that led to a more dramatic increase in the number of democracies.
The chart below distinguishes between six different political regimes and shows the number of people in the world governed under each. To instead see the shares of the world population governed under each regime, click on ‘Relative’.
During the 19th century, most of the world’s population lived in colonial empires, autocracies, or anocracies. The late 19th century saw a limited expansion of democracies. And since that time, there has been a general upward trend in the share of the world population living under democracies, save for the period before and during World War II.
During the second half of the 20th century, colonies gained independence and more countries became democracies. Today, more than half the world’s population live in a democracy. And of those who still live in autocracies, four-fifths are Chinese.
The world has changed. Two centuries ago, most countries were autocracies or colonies; today, most are democracies. In the map and chart below, each country receives a Polity IV score, which goes from −10 (full autocracy) to 10 (full democracy). For convenience, in this entry, we’ll refer to this as the “Democracy Score”. By default, 2015 data are shown, but you can move the slider (bottom) to see data in each of the past 200 years.
Most countries in Europe and the Americas are now democracies. Some parts of Africa — especially in the West and the South — have democratized. So too have countries in Asia, with India being the world’s largest democracy. Many countries are full democracies (score of 10), including Australia, New Zealand, Japan, and Mongolia.
The map below shows the age of each democracy at the end of 2015. (In black are countries that were not democracies in 2015.)
We see that a democratic world is a very recent achievement. Also, economic success tends to go with political freedom. The countries that democratized first were also mostly the countries that first achieved sustained economic growth. One might thus hope that the relatively high growth rates enjoyed by today’s poorer countries will lead to further political freedom.1
Countries with better education in the past are more likely to be democracies today
A long-standing theory in political science argues that education is a key determinant of the emergence and sustainability of democracy, because it promotes political participation at the individual level and fosters a collective sense of civic duty.
And so, under this theory, we should expect that education correlates positively with measures of democratization in subsequent years. This is precisely what we see in the data and chart below. Those countries that had higher average education levels in 1970 are also those countries that are more likely to be democratic today (you can read more about measures of education level in our entry on Global Rise of Education).
Again, these data should be interpreted carefully. They merely show a correlation and do not imply a causal link. That is, these data do not imply that education leads to democracy.
Nonetheless, academic work does suggest that there is such a causal link. Even after controlling for many other country characteristics, the positive relationship between education and democracy holds (see, for example, Lutz, Crespo-Cuaresma, and Abbasi‐Shavazi 20102).
Democratic countries are richer – the exception are fossil-fuel exporters
The chart below plots GDP per capita against the Democracy Score. Observe that autocracies (score between −10 and −6) that do not export large quantities of fossil fuels tend to be poor. No such country enjoys GDP per capita of more than 15,000 international-$.
The chart below plots each country’s child mortality against its Democracy Score, for the year 2015.
We see that few autocratic countries enjoy child mortality rates under 10 per 1,000. In contrast, democracies scoring 7 or more often enjoy child mortality rates below 10 or even 5 per 1,000.
Here we have considered only child mortality, but a broader analysis of countries’ health outcomes would also show that more generally, good health is linked with political freedom.
(Note though that the chart below does not take into account the age of each democratic regime. If there is indeed a link between good health and political freedom, we might expect that older democracies enjoy better health. This would entail a deeper analysis that we have not done here.)
The right to vote and determine who holds political power is in itself a fundamental right. And this right is, by definition, upheld and protected by all democracies.
But of course, there are many other human rights. Are democracies also better at protecting these other human rights?
As noted in our entry on human rights, it is difficult to measure the degree to which human rights are protected. In our opinion, the best available measure is the Human Rights Protection Score developed by Fariss (2014)3
The Human Rights Protection Score focuses on the protection of the physical integrity of citizens. In particular, it takes into account torture, government killing, political imprisonment, extrajudicial executions, mass killings and disappearances.
The chart below plots each country’s Human Rights Protection Score against its Democracy Score. There is a clear positive correlation. Countries with high Democracy Scores tend also to have high Human Rights Protection Scores. Indeed, except for Singapore and Oman, every country whose Human Rights Protection Score exceeds 0.5 has a Democracy Score is a democracy.
Mulligan, Gil, and Sala-i-Martin (2004)4 investigate the link between democratic rule and the human rights protection in a sample of 121 counties controlling for other important variables. The authors find that countries that are more democratic are less likely to execute, regulate religion, or censor the press.
Above, we mentioned that improved education might cause greater democratization. Now, is there also a reverse causal effect? That is, does democratization lead to improved education? Once again, this is a tricky question for social science, because we need to distinguish between the two arrows of causation.
Evidence that democratization leads to better education Gallego (2010)5 presents the most careful analysis that we are aware of. It presents evidence that democracy has indeed had a causal effect on primary-school enrollment.6
Other papers deal with the issue of possible reverse causality in a simpler fashion and use lagged observations of democracy as a possible determinant for the level of education. For example, Baum and Lake (2001) find that democratization increased secondary-school enrollment.7
Also, Acemoglu, Naidu, Restrepo, and Robinson (2015)8 find that democracy is associated with an increase in secondary schooling.
We now briefly discuss several channels through which democratization might improve education:
Electoral competition in democracies increases the incentive to abolish school fees Harding and Stasavage (2014)9
find that democratization has a positive effect on primary education. Their explanation is that electoral competition in democracies incentivizes politicians to abolish primary-school fees. They argue that democratization has a much smaller effect on the provision of school inputs and consequently the quality of schooling — the reason is that such actions are harder to monitor and would thus provide politicians with a smaller advantage in electoral competition.
Democratization increases educational spending Stasvage (2005)10 finds that the 1990s shift to multiparty competition in African countries increased total educational spending as a percentage of GDP. Ansell (2010)11 studies 100 countries over 40 years and finds that democratization increases both total educational spending as a share of GDP and as a share of the government budget.
Evidence that democracy improves teacher–student ratios Naidu (2011)12 studies the effects of the 19th-century disenfranchisement of black citizens in the US South through poll taxes and literacy tests. He finds that this reversal of democracy “reduced the teacher-child ratio in black schools by 10–23%, with no significant effects on white teacher-child ratios.”
Democracy improved local politics in China and lead to more educated politicians Martinez-Bravo et al. (2012)13
study the gradual introduction of local elections in China. In particular, they exploit the staggered timing of the introduction of village elections as a natural experiment. They “find that elections significantly increase public goods expenditure, the increase corresponds to demand and is paralleled by an increase in public goods provision and local taxes.” This is consistent with some of the results we’ve already discussed, including increased public education in villages with more children. Overall total public goods investment increased by 27 percent – this increase in public expenditures was funded by villagers and was accompanied by an increase in the local taxes paid by villagers.
The introduction of elections also reduced inequality. This was achieved partly through (a) land redistribution from elite-controlled enterprises to farming households; and (b) increased irrigation and hence improved agricultural productivity that is likely to “disproportionately benefit poorer households”. Martinez-Bravo et al. (2012) also find that the introduction of elections was followed by the increased turnover of village chairmen increased. Moreover, the village chairmen were now less likely to be Communist Party members and, more importantly, were better educated.
Data Quality
Why we chose Polity IV as the main source for democracy measures
Measuring democratization is a tricky business. Can something as complex as democratization really be boiled down to a single, one-dimensional metric? Many would argue that it cannot.
Nonetheless, such a metric can be convenient and useful — it allows us to compare political regimes across time and space, and to quantify the causes and effects of political regime change. For example, such a metric can help us study the link between democratization and the end of mass famines.
In this entry, we have chosen to rely heavily on Polity IV and, in particular, what we’ve called the Democracy Score as our metric for democratization. One reason for choosing Polity IV is its long-run perspective.
Another is that Polity IV’s data sources provide a detailed explanation for each country’s political regime classification in each year. You can find these explanations in the PDF files here.
Yet another reason for choosing Polity IV is that it was praised by Munck and Verkuilen (2002),14 which is a a much-cited and thorough evaluation of commonly used democracy measures. These authors argue that there is usually a trade-off between the comprehensiveness of the empirical scope and the quality of the assessment in terms of conceptualization, measurement, and aggregation. However, Polity IV constitutes a rare “partial exception” to this trade-off.
Of course, we must keep in mind that the Polity IV Democracy Score does not and cannot capture everything that matters. For example, it fails to capture corruption or human rights adequately — and in any case, it probably makes better sense for us to measure these separately.
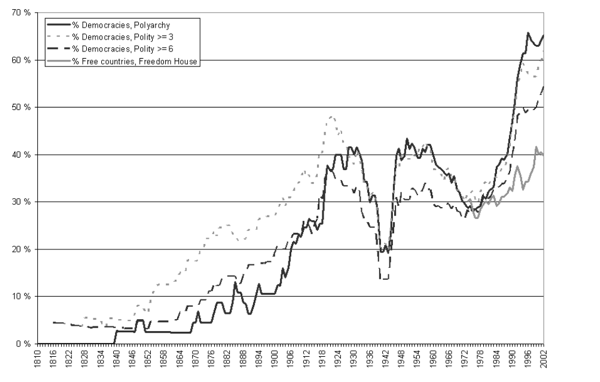
It puts together three other measures of democratization that we haven’t yet discussed in this entry. These are the Polyarchy measure, the Polity measure, and the Freedom House measure. The Polyarchy and Polity measures go back to the early 19th century. The Freedom House measure shows the percentage of independent countries that are democratic. You can see that while these measures do not exactly coincide, they do largely move together.
Share of democracies of independent countries, 1816–2002 – Wilhelmsen
The Manifesto-Project by the Wissenschaftszentrum Berlin für Sozialforschung is an effort to understand political changes in democratic countries. This project undertakes a qualitative analysis of party manifestos for 50 countries since 1945.
Long Run
Polity Index
Data: Many different measures – listed here. Most commonly used is the Polity2 measure which measures political systems on a spectrum between autocracy and democracy.16
Geographical coverage: Global – by country.
Time span: Data goes back to 1800 and is yearly updated.
Boix-Miller-Rosato dichotomous coding of democracy, 1800-2007
Data: Dichotomous democracy measure, Dichotomous indicator of sovereignty/independence, Previous number of democratic breakdowns, Consecutive years of current regime type
Criticized by Munck and Verkuilen (see last side note)
Democracy-Dictatorship Data
Data: Classification of political regimes as democracy and dictatorship; and classification of democracies as parliamentary, semi-presidential (mixed) and presidential.
Geographical coverage: Global – 202 countries.
Time span: From 1946 or year of independence to 2008.