Notice: This is only a preliminary collection of relevant material
The data and research currently presented here is a preliminary collection or relevant material. We will further develop our work on this topic in the future (to cover it in the same detail as for example our entry on World Population Growth).
If you have expertise in this area and would like to contribute, apply here to join us as a researcher.
All our charts on Educational Mobility and Inequality
In primary education

Women with no education


Changes in gender inequality in education
The following visualization shows the evolution of female-to-male ratios of educational attainment (mean years of schooling) across different world regions.
The estimates in the visualization correspond to regional averages of total year of schooling for females (15-64 years of age), divided by the corresponding regional averages for males (15-64 years of age). Regional averages are population-weighted.
As we can see, despite short periods of decline, there is generally an upward trend in the gender ratios across all regions – this implies that gender gaps in educational attainment have been going down in the long run. In fact, Latin America and Eastern Europe caught up with the group of ‘advanced economies'1 in the 1980s, and the gender gaps in these regions have already been closed almost completely (i.e. the gender ratios approximate the 100% benchmark for education gender parity).

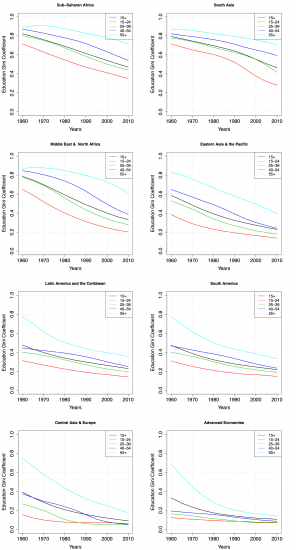
The following visualization shows the recent evolution of inequality in educational attainment, through a series of graphs plotting changes in the Gini coefficient of the distribution of years of schooling across different world regions. The Gini coefficient is a measure of inequality and higher values indicate higher inequality – you can read about the definition and estimation of Gini coefficients in our entry on income inequality. The time-series chart shows inequality by age group. It can be seen that as inequality is falling over time, the level of inequality is higher for older generations than it is for younger generations. We can also see that in the period 1960-2010, education inequality went down every year, for all age groups and in all world regions.
Have gains from historical education expansion fully materialized? The breakdown by age gives us a view into the future: as the inequality is lower among today’s younger generations, we can expect the decline of inequality to continue in the future. Thus, further reductions in education inequality are still to be expected within developing countries; and if the expansion of global education can be continued, we can speed up this important process of global convergence.
Education Gini coefficients by world region for selected age groups, 1960- 2010 – Figure 4 in Crespo Cuaresma et al. (2013)2