Notice: This is only a preliminary collection of relevant material
The data and research currently presented here is a preliminary collection or relevant material. We will further develop our work on this topic in the future (to cover it in the same detail as for example our entry on World Population Growth).
If you have expertise in this area and would like to contribute, apply here to join us as a researcher.
As countries develop, the share of the population working in agriculture is declining. While more than two-thirds of the population in poor countries work in agriculture, less than 5% of the population does in rich countries. It is predominantly the huge productivity increase that makes this reduction in labor possible.
Similarly, productivity gains makes it possible to reduce the agricultural land needed to feed a given number of people.
All our charts on Employment in Agriculture
Employment in agriculture: 1300 to today

Employment in agriculture since 1800
This visualisation shows the total number of people employed in agriculture across select European, North American and Asian countries since the year 1800. Over this period – and in particular since 1950 – we see an overall decline in agricultural employment to comparably low levels of employment today.

The map shows the share employed in agriculture country by country. Three-quarters of the labor force in a poor country like Madagascar are employed in agriculture. In rich countries like Germany or the UK it is only 1 in 100 who is employed in agriculture.

The UN Food and Agricultural Organization (FAO) aim to capture data on the role of women in agriculture and land ownership within its Gender and Land Rights Database. In this map we see the share of agricultural landowners who are female as a percentage of total agricultural landowners. As part of its definition the FAO notes that this measure is inclusive of women who own the land solely or jointly with someone else inside or outside of the household.1
Unfortunately such data is not gathered continuously or periodically across most countries, so we are limited to results from a single census year. Note that this census year is not consistent across all countries. Data for most European and North American countries is based on 2010-11 datasets, whereas other countries can extend from 1993-2011. For graphing consistency, this has been shown as a single year (e.g. assuming these figures are representative of 2011). The actual years of measurement for each country can be found in the referenced FAO report and database.
For the majority of countries, female land ownership represents less than 30 percent of total ownership. However, this has significant variation across the world, without a strict continental pattern. Overall, we see the highest rates of female ownership in Europe, however Botswana and Malawi both have ownership shares greater than 30 percent. Although some of the lowest rates are recorded in Sub-Saharan Africa and South Asia, high-income countries can also have a low incidence of female land ownership; the United States, United Kingdom, Norway and Finland all have shares below 15 percent.

In this chart, we have mapped the agriculture value added per worker (measured in 2010 constant US$). Agriculture value added per worker is calculated as the total agricultural value added divided by the number of people employed in agriculture
Overall, we see the highest rates of agricultural value added per worker in across Europe, North America and New Zealand; in 2017, several countries had a value added per worker of $70,000. In comparison, most countries across Sub-Saharan Africa and South Asia, where the value added per worker was typically less than $1,000 in 2017.

Lower share of output
These charts show that the importance of the agricultural sector in the economy decreases as countries get richer.
The connected scatter plot shows the historic decline of agriculture as a share of countries’ GDP since 1800.
The bubble chart shows the latest data across countries. In countries with a GDP per capita over 15,000 int.-$, we see that less than 10% of economic output occurs in the agricultural sector.


Lower employment, higher labour productivity

This visualisation shows the agriculture value added per worker versus gross domestic product (GDP) per capita (both measured in constant 2010 US$). Agriculture value added per worker is calculated as the total agricultural value added divided by the number of people employed in agriculture.
Overall, we see that the agriculture value added per worker is higher in higher-income nations. The same applies to most countries over time: as countries get richer, the agriculture value added per worker increases; this is likely to result from several factors including technology adoption, affordability of agricultural inputs, and the implementation of more productive practices.

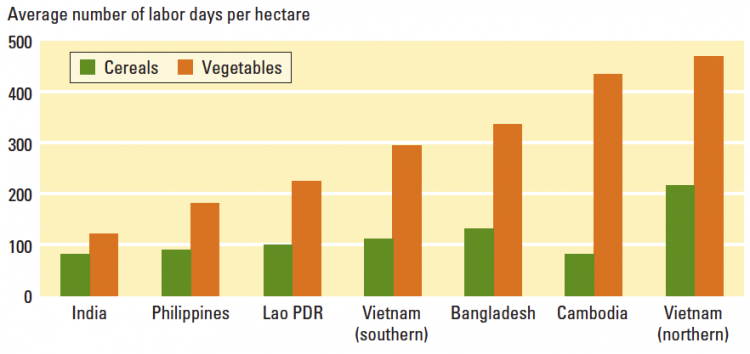
Labor requirements are considerably higher for vegetables than for cereals, as shown in this graph.
Average number of labor days per hectare for cereals and vegetables – World Development Report (2008)2
- Data: ‘Employment in agriculture (% of total employment)’ – women only, men only, total.
- Geographical coverage: Global – by country and world region.
- Time span: Since 1980
- Available at: World Bank website – ‘Employment in agriculture (% of total employment)’ is here.
- Szirmai (2005) publishes data on the agricultural labor force for some countries for the time 1950 to 2000 on his website. These data are also taken from (older publications of) the World Bank.
- Data: Agriculture workers as % of labor force
- Geographical coverage: Global
- Time span: Since 1980
- Available at: The website of the ILO – and in a ready to use format on Gapminder here.