Recently, we published a comprehensive dataset of famine mortality over the last 150 years – the outcome of several months’ work that brings together a range of sources on particular famines into one place. In this post we show that, despite the uncertainty that surrounds mortality estimates for many individual famines, the overall long-run trend is clear: in recent decades famine mortality rates have fallen abruptly to much lower levels compared to earlier periods. In a second blog, we discuss some of the reasons for this decline.
Long term trends in global famine mortality
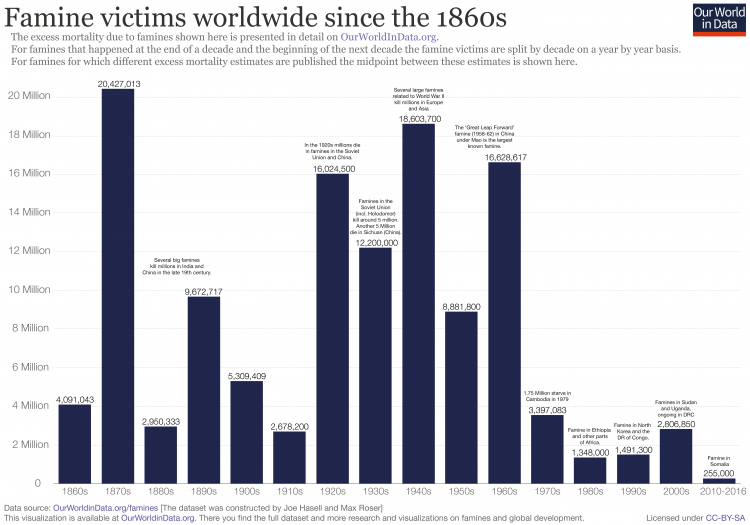
Compared to earlier historical periods, very few people have died in famines in recent decades. Here we show two bar charts based on our dataset of famines. The blue bars show the number of famine deaths in each decade since 1860. The number of famine deaths varies hugely from decade to decade depending on the occurrence of individual catastrophic famines. Nevertheless the last four decades have seen low numbers of famine deaths by historical standards.
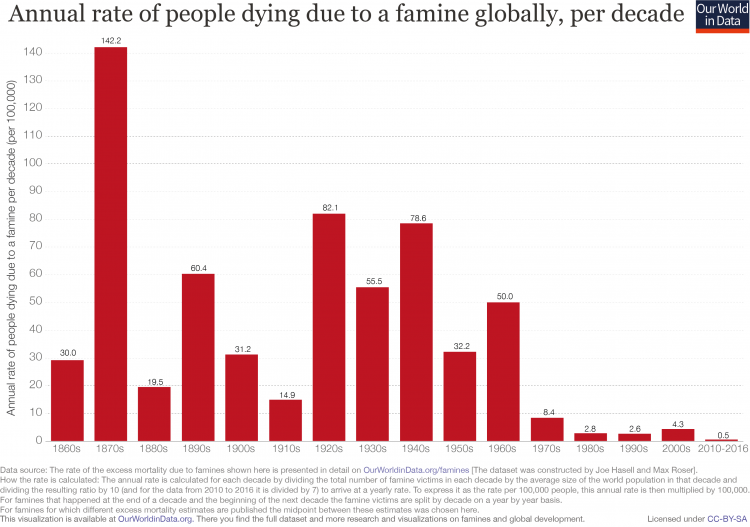
The red bars show famine mortality relative to the growing world population over this time. Viewed in this way, the trend is all the more notable. The chart shows the rate of famine deaths globally, expressed as the number of people dying each year per 100,000 people of the world population. The chart presents this rate averaged across each decade since 1860. You can see that the famine mortality rate fell to very low levels over the second half of the 20th century onwards.
The sharp reduction in famine mortality represents “one of the great unacknowledged triumphs of our lifetime”, as famine researcher, Alex de Waal describes it.1
As de Wall explains, a continued decline is by no means assured: the future of famine will depend largely on the nature and prevalence of war. However, as we discuss here, the long-run developments that have contributed to the sharp decline in famine mortality do suggest that the type of catastrophic famine seen in the nineteenth and twentieth centuries is very unlikely to return.
Famines by world region since 1860
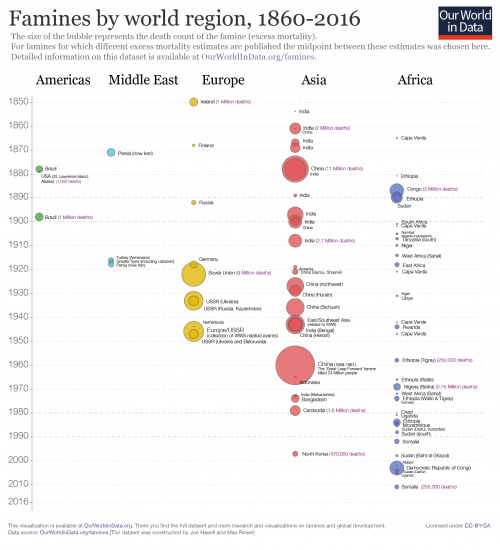
The geographic spread of famines has also reduced over this period, as we can see in these two charts, which give two ways of visualizing famine deaths by continent.
While in earlier periods Asia suffered heavily from major famines, this came to a halt over the mid-20th century. Since then, famines have almost exclusively been restricted to Africa, with the famine in North Korea being a stark exception.
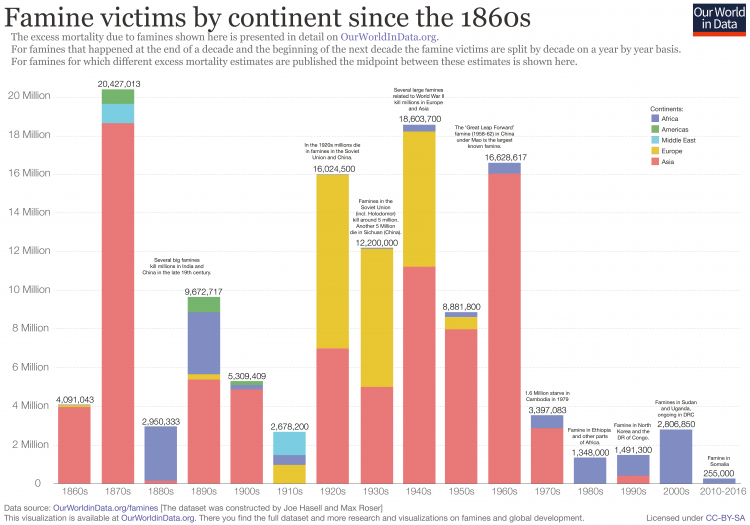
Victims of individual famines
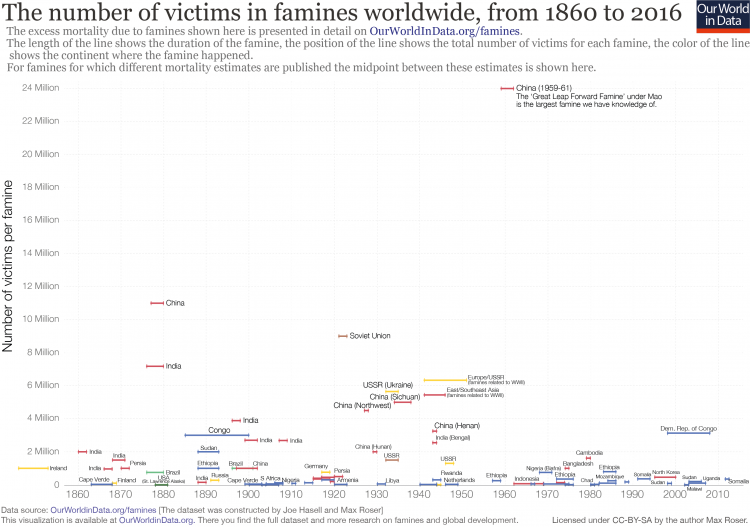
This chart shows the estimated number of people dying in individual famines since the 1860s, based on our dataset of famines. The length of each line shows the duration of the famine and the color shows the continent in which the famine occurred.
What this chart doesn’t show however is the significant uncertainty that surrounds many of these estimates. As we discuss in our section on Data Quality, historical famine estimates are frequently based on very scant demographic information, and even where such evidence is available there is still disagreement in its interpretation.
As such, many of the famines included in our dataset are associated with a wide range of plausible mortality estimates. In our data, these are represented by upper- and lower-bound estimates, with the mid-point being shown in the visualization above. Two apt examples are the famines in the Democratic Republic of Congo, which took place amidst the Second Congo War beginning in 1998, and that of North Korea from 1995 to 1999. These famines stand out in recent decades for their particularly high mortality. But in both cases, the range of mortality estimates available in the literature is large, with high and low estimates varying by several millions of deaths.7
Where such differences are present, our midpoint estimates are clearly very sensitive to our choice of upper and lower bounds. We have not simply taken the highest and lowest figures published in the public domain, given that more accurate estimates often emerge with time. As noted by the World Peace Foundation, “generally speaking, better demographic calculations lead to lower estimations of excess deaths than those provided by journalists and other contemporary observers.” Rather, we have sought to select upper and lower estimates based on the balance of opinion in commonly-cited sources, all of which are detailed (for each individual event) in our dataset of famines. Inevitably though, this meant us taking a position in some controversial cases, discussed in detail here.
But whilst the number of deaths caused by individual famines is often subject to a good deal of uncertainty, the overall trend over time is very clear: compared to earlier historical periods, far fewer people have died in famines in recent decades. Whether we consider high or low estimates, or something in between, does not affect this conclusion.
Number of deaths and duration of individual famines, 1860s-20166