→ Open the Data Explorer in a new tab.
All our charts on Fertilizers
Predictions of a global food crisis — that the world’s food production would not be able to keep pace with population growth — have a long history. In the 18th century the English cleric Thomas Robert Malthus hypothesized that gains in per capita resources would inevitably be outstripped by population until food supplies finally acted as a barrier to further growth.1
Such predictions have continued well into the 20th and 21st centuries; in his controversial 1968 book The Population Bomb, Paul Ehrlich argued that global population would continue to grow until the point of mass starvation.2
Both Malthus and Ehrlich should be surprised to see the current state of the world. Today, we can support a global population of around 7.4 billion (and growing), with many consuming far in excess of requirements.3
There are a number of scientific and technological innovations which have allowed for rapid growth in crop productivity, particularly in the second half of the 20th century. None of these had a more dramatic impact than the ability to produce synthetic nitrogen fertilizer.
In fact, it’s estimated that nitrogen fertilizer now supports approximately half of the global population. In other words, Fritz Haber and Carl Bosch — the pioneers of this technological breakthrough — are estimated to have enabled the lives of several billion people, who otherwise would have died prematurely, or never been born at all.4
It may be the case that the existence of every second person reading this attributes back to their 20th century innovation.
Understanding the significance of nitrogen fertilizer requires a brief explanation of its role in global crop production. In addition to water and sunlight, crops need three key nutrients to grow: nitrogen, phosphorous and potassium. Nitrogen is often the nutrient that is limiting to further crop production, despite Earth’s atmosphere containing more than 78 percent. This is because in the atmosphere, nitrogen exists in its largely unreactive N2 form, rather than in a reactive form which plants can utilize.
For millennia, agricultural crop had to rely on the limited quantity of reactive nitrogen which was naturally occurring in soils and ecosystems.5
This remained the case until 1908 when the German chemist Fritz Haber developed a process by which atmospheric N2 could be converted into ammonia (NH3) – a form of reactive nitrogen which plants can use.6
Carl Bosch, another German chemist and engineer, was able to take Fritz Haber’s laboratory-scale process and develop it at an industrial scale. The combined “Haber-Bosch process” remains the primary industrial method for the production of synthetic nitrogen fertilizer.
In simple terms, crops typically respond positively to nutrient inputs. As we explore in detail in our entry on Crop Yields, crop yields and fertilizer application typically show a strong positive relationship. Fertilizer application, combined with other productivity factors such as improved crop varieties, genetic breeding, irrigation and mechanization led to a significant inflection in crop yield trends across the world in the 20th century. It should be noted that this growth in agricultural output — from both industrial and organic farming — has undoubtedly resulted in important ecological and resource pressures. However, as we cover in detail in a recent blog post, organic farming (that is, agriculture without synthetic inputs) can often have a greater environmental impact than conventional agriculture.
So, how many people does synthetic nitrogen fertilizer actually feed? Below we draw upon several published estimates, which tend to converge on a similar share of the global population. Results published by Erisman et al. (2012) in the scientific magazine Nature are shown in the chart.7
These results also tie closely with Vaclav Smil’s widely-quoted estimates, which we discuss later.8
- In the chart we see the actual global population trend in blue — growing from around 1.65 billion in 1900 to almost 7.4 billion in 2015.
- The line in grey represents estimates of the number of people fed by synthetic nitrogen fertilizers. As we see, nitrogen fertilizers only became available following the commercialization of the Haber-Bosch process from 1910 onwards. Since then, Erisman et al. estimate it has supported 42 percent of global births over the past century. This amounts to 44 percent of the global population in 2000 being fed by nitrogen fertilizers, rising to 48 percent in 2008. Here we have extended this estimate to 2015 with the continuation of the assumption that 48 percent of the global population are fed by nitrogen fertilizers. Since the share supported by the process continues to rise, this may in fact be a conservative estimate. This means that in 2015, nitrogen fertilizers supported 3.5 billion people that otherwise would have died.
- The red line represents the size of the global population which would therefore be supported without the use of nitrogenous fertilizers. This is shown simply as the actual population minus the number of people reliant on them for food production. Without this innovation, global population may have been reduced to only 3.5 to 4 billion people.

Firstly, it’s important to note that these estimates are understandably difficult to derive with a high degree of certainty. This difficulty arises for several reasons. Notably there have been a number of additional contributors to productivity gains in agriculture throughout the 20th and 21st centuries, including crop breeding, irrigation, mechanization, and farm management techniques — untangling the individual role of nitrogen fertilizers alone is challenging. Secondly, the global food system is complex and geographically highly unequal: high-income countries have moved beyond the stage of aiming to meet basic nutritional requirements from food production, and now dedicate a large share of food production to meat (which is a much less efficient nitrogen converter) and bioenergy production.9
Nonetheless, general estimates tend to converge on a figure in the range of 40-50 percent of the population. Let’s look at three widely cited estimates:
- Utilizing a range of long-term evaluations, spanning a total of 362 seasons of crop production, of crop yields and nutrient budgets across the world, Stewart et al. (2005) concluded that between 30-50 percent of yield increases could be attributed to synthetic fertilizer inputs (and typically even higher in the tropics).10
Smil (2004) reached similar conclusions, suggesting with high confidence that global crop harvests would be approximately half of current levels without nitrogen fertilizer inputs.11
The complexities of the global food system make it challenging to provide a firm figure, however, it’s likely that just under half of the global population is dependent on synthetic nitrogen fertilizers. This is further shown in the chart. As a result, the Haber-Bosch process is likely to have enabled the lives of at least 3 to 3.5 billion people today.

If Fritz Haber had not discovered how to make synthetic nitrogen, would we have found alternative solutions to support a population as large as today’s?
Addressing this question partly relies on retrospective guesswork about whether, in the absence of synthetic nitrogen fertilizer, we would have managed to supply nitrogen via other methods. If Fritz Haber or Carl Bosch (or any scientist to follow) hadn’t developed a method for transforming inert atmospheric nitrogen into reactive nitrogen plants could utilize, what is the likelihood that other solutions would have filled the gap?
One solution would have been to greatly increase the production of nitrogen-fixing legume crops. As noted earlier, leguminous crops (i.e. peas, beans and other pulses) possess a unique ability to transform (or ‘fix’) atmospheric nitrogen into reactive nitrogen in the soil. Growing these crops can therefore increase soil nitrogen sources over time. Whilst this might have credibly increased the total availability of reactive nitrogen to some extent, it’s unlikely to have been a widely-scalable solution for several reasons.
Firstly, legumes tend to be lower-yielding relative to cereals and other staple crops. This is true of yields today, but also true of historical yields — in the late nineteenth century, Western European legume yields were typically less than half that of staple cereals.12
Farmers in the 19th and early 20th century would have had little incentive to widely adopt these crops. Secondly, despite the many nutritional and environmental benefits of legumes, they form only a small component of most peoples’ diets. Furthermore, preferences for pulses and legumes tend to decline as incomes rise and food choices widen. The overall appetite for legumes — both from a farmer’s and dietary preference perspective means it would have been high unlikely that they would have been able to supply nitrogen at a scale close to that of the Haber-Bosch process throughout the 20th century.
Another potential nitrogen source is that of organic wastes — nitrogen is supplied in many organic farming systems today in the form of animal manure. Couldn’t we have relied on these non-synthetic nitrogen sources instead? In fact, we did; prior to Haber-Bosch and the creation of synthetic nitrogen inputs, most agricultural systems relied on the recycling of manure, wastes and other biomass back into the soil to maintain nitrogen balance. The issue is that these existed in limited supply: recycling nutrients, by definition, means you have a limited supply. This allowed societies to sustain moderate levels of nitrogen but did not allow them to create more. As Smil (2004) discusses in detail, previous societies could typically support only small numbers of domesticated animals, and as a result, had very limited supplies of manure and animal wastes.13
Synthetic nitrogen not only increased crop yields, but also enabled an expansion in livestock numbers. Increased productivity and excess crops allowed farmers to allocate an increasing share of output to livestock — particularly grain-fed animals. Overall, this has increased the amount of reactive nitrogen which can be recycled through our agricultural systems; with more livestock, we also have more manure to recycle. But it’s important to recognise that such levels of organic nitrogen sources are only available because of previous synthetic nitrogen inputs. The creation of synthetic nitrogen delivered reactive nitrogen to the soil which could then be recycled in the form of organic wastes and biomass. If organic nitrogen could today support a large share of the global population then it is because synthetic nitrogen has enabled it to do so by adding reactive nitrogen to our agricultural systems. Without Fritz Haber’s discovery, this would never have been a possibility.

Total fertilizer

Nitrogen fertilizer

Phosphate fertilizer

Potash fertilizer

Total fertilizer production

Nitrogen fertilizer production

Phosphate fertilizer production

Potash fertilizer production

Nitrogen fertilizer consumption

Phosphate fertilizer consumption

Potash fertilizer consumption


Fertilizers have brought the world massive socioeconomic and developmental benefits. They improve crop yields. This has two advantages. First, we can grow more food. Second, we need to use less land for farming, and therefore destroy fewer ecosystems in the process.
But alongside these environmental benefits, there are some downsides. Not all of the nutrients we apply – in fact, as we explore in a related article, less than half of it globally – is used by the crops.14 The rest runs off our farms into the natural environment: if this happens then it pollutes rivers and lakes; causes imbalances in ecosystems and affects biodiversity.
What is the global extent of fertilizer pollution? Which countries cause the most avoidable pollution?
We can measure this using a metric called “excess nutrients”. This metric shows us how much of the nutrients that farmers apply as fertilizer runs off into the natural environment.
In a paper published in Science, Paul West and his colleagues mapped the nutrient balance for nitrogen and phosphorus – the main nutrients we add to our crops – across the world.15 They quantified the amount of nutrient inputs – this can come in the form of synthetic fertilizers, organic additions such as manure, or even biological fixation of nitrogen from legume plants – and the output, which is the amount of nitrogen or phosphorus that is stored in the crops that we harvest.
The difference between inputs and outputs is “excess”: nutrients that are not used by the crops and instead run-off into the natural environment.
Nearly two-thirds of applied nitrogen is not used by our crops
This research finds that globally farmers apply around 115 million tonnes of nitrogen to our crops every year. Only around 35% of this is used by them, meaning 75 million tonnes of nitrogen runs off into our rivers, lakes and natural environments. This is our “excess nitrogen”. It is quite staggering that almost two-thirds of our applied nitrogen becomes an environmental pollutant.
Which countries create the most nitrogen pollution? The maps below show this from two perspectives.
First, as the excess nitrogen per hectare of cropland. Here we see large differences across the world.
Some countries actually produce ‘negative’ nitrogen pollution, they are shown in blue. This is known as nitrogen mining. This happens when countries undersupply nitrogen fertilizers, but continue to try to grow more and more crops. Crops then have to take nitrogen from the soil. Over time this depletes soils of their nutrients which will be bad for the productivity of these soils and crop production in the long-run.
Other countries massively oversupply nitrogen. These are the countries shown in the darker shades of red here. Countries such as Kuwait, Singapore, South Korea, Egypt, New Zealand, China, and Taiwan create more than 100 kilograms of excess nitrogen per hectare. For every hectare of cropland, they produce hundreds of kilograms of pollution.
The other map shows total nitrogen pollution – the sum of pollution generated in each country, rather than per hectare. This is given as each country’s share of the global total.
China generates the most nitrogen pollution, accounting for one-third of the global total. India produces almost one-fifth (18%); the USA produces 11%; followed by Pakistan and Brazil.
It’s not that surprising that the countries with the largest populations (and some of the largest land masses) create the most pollution. But as I explore in a related article, there are lots of opportunities to reduce fertilizer use (and pollution) without sacrificing crop yields.
Both of these metrics – the amount of excess nitrogen per hectare, and the total excess are important. Excess per hectare informs us of where nutrients are being used inefficiently; if this number is high then farmers are overapplying fertilizers and organic nutrients. But total excess is also important because it informs us of where we’re likely to have hotspots of water and ecosystem pollution. We need to be aware of regions with lots of farmland and excess nutrients because surrounding rivers and lakes are at high risk of becoming polluted.

Related chart


More than half of applied phosphorous is lost to the environment
The other main nutrient we add to our crops via fertilizers is phosphorous.
Globally farmers apply around 25 million tonnes every year. 14 million tonnes are not used by the crops and become a pollutant. That means that more than half goes to waste.
Just as we looked at with nitrogen, we can see which countries produce the most excess phosphorous; first per hectare, then as the total per year. This is shown in the maps below.
Most of the countries that overapply nitrogen are the same ones that also overapply phosphorous. Singapore, New Zealand, Japan, South Korea, and Belgium, are all near the top of the list.
Unsurprisingly, given their population size and land mass, the largest polluters are similar to nitrogen. China tops the list, producing one-third of the world’s excess phosphorous. This is followed by India at one-fifth; Brazil at 7%; United States at 6%; and Pakistan at 3%.

Related chart


Some countries could use more fertilizer; some could use less
Many countries – particularly poorer countries across Sub-Saharan Africa – do not use enough fertilizer. Their crop yields suffer as a result. This is bad for farmers; food security; and the environment because it means they need to use more land for agriculture. As I covered in my recent article, Sub-Saharan Africa is projected to be the hotspot of habitat loss in the coming decades as a result of expanding croplands. Thousands of mammals, birds and amphibian species are at risk. The good news is that if we can improve crop yields, we can prevent almost all of this. Fertilizers will play an important role in achieving this.
At the other end of the spectrum, some countries use too much. They could use much less – and produce much less pollution – without it affecting crop yields. Getting this balance right would bring a range of socioeconomic and environmental benefits. In a related article we look at this trade-off in more detail, and explore the possible solutions for reducing nutrient pollution.
One of the world’s biggest and most impressive studies shows us that simple interventions can produce large results. In a decade-long trial, researchers worked with 21 million smallholder farmers across China to see if they could increase crop yields while also reducing the environmental impacts of farming.16 They were successful.
In the decade from 2005 to 2015, average yields of maize, rice and wheat increased by around 11%. At the same time, nitrogen fertilizer use decreased by around one-sixth. By producing more crops and needing less fertilizer, this experiment provided an economic return of US$12.2 billion. This wasn’t achieved through major technological innovations or policy changes: it involved educating and training farmers on good management practices.
It’s often assumed that fertilizer use – alongside the pollution it creates – and crop yields present an inevitable trade-off. To increase yields, you need more and more fertilizer. This large-scale study suggests this trade-off is not always as extreme as we might think.
To be clear: fertilizers are vital for global food production. There are few innovations that have transformed the world as much as synthetic nitrogen.
For most of human history, food production was limited by the amount of reactive nutrients that were available for crops. This all changed with Fritz Haber and Carl Bosch. Rather than relying on the scarce nitrogen that exists naturally within the world’s soils, we could produce our own. Their innovation (the Haber-Bosch process) at the beginning of the 20th century enabled the lives of billions of people.17 Estimates suggest that every second person reading this has them to thank for being alive today.
Fertilizers help us to achieve higher crop yields. This is an obvious net positive for humans: farmers can produce and earn more, and the world has more food. What’s less obvious is that this has a large environmental benefit. Higher crop yields mean we need to use less land for farming.18 This means we can protect forests and maintain natural habitats.
But it’s true that alongside the environmental benefits, there are also some downsides. Not all of the nitrogen we use is used by the crops. The rest runs off the soils and into the natural environment: fertilizing the rivers and lakes and thereby upsetting the balance of ecosystems and causing biodiversity loss.
We might assume that there is nothing we can do: that to achieve higher yields we need more inputs and therefore necessarily cause more pollution. In this article I show that farmers in many countries can reduce fertilizer use without sacrificing food production.
There are large differences in fertilizer use across the world
Crops, like any organism, need nutrients to grow. When particular nutrients are lacking, they fail or grow at a much slower rate. These are called ‘limiting nutrients’. What nutrient is the most limiting varies across the world: some soils lack nitrogen, while others lack phosphorus or potassium.
If a soil is lacking nutrients naturally we can add our own. This can be in the form of synthetic fertilizers, or organic additions such as manure. There are very large differences in how much fertilizer is applied across the world. We see this in the charts below: first as a map of average fertilizer use per hectare of cropland; and second, with the breakdown by nutrient in the bar chart.
There are 100-fold differences between countries. In many of the world’s poorest countries – particularly across Sub-Saharan Africa – farmers apply only a few kilograms of fertilizer per hectare. For context, one hectare is about 1.5-times the size of a football pitch.19 Contrast this with countries such as China, Brazil, the UK or Egypt, where farmers apply hundreds of kilograms per year. They apply as much in a few days as some farmers do in an entire year.
This has led to a divided world:
- In many poorer countries we need more fertilizers. Improvements in crop yields have been slow, and large yield gaps could be closed through more and better management of inputs.20 This is not only good for farmers, but also for the environment: for the reasons above, closing yield gaps is one of the best ways we can prevent habitat loss across the tropics.
This is why it’s damaging for agencies, such as the United Nations Development Programme to continually promote the message that the less fertilizer, the better. It’s not good for humans, or the environment. - But, as we will see, many countries are overapplying nitrogen. They could cut back without negatively affecting their crop yields.

Nitrogen use efficiency: balancing yields and the need for nutrient inputs
Using lots of fertilizer wouldn’t necessarily be a bad thing if all of it was used by the crops. Unfortunately, most of it isn’t.
To capture this, we can look at the ratio of nitrogen in harvested products (our crops) compared to our inputs (fertilizers or manure); this ratio is called the ‘nitrogen use efficiency’ (NUE). A NUE of 60% would mean that the amount of nitrogen in our crops was 60% of the nitrogen that was added to them as inputs. The remaining 40% of nitrogen was not used by the crops.
A low NUE is bad. This means very little of the nitrogen we add is taken up by the crops. A NUE of 20% would mean that 80% of the applied nitrogen became a pollutant.
Soon we will see that some countries have a very high NUE – greater than 100%. You might assume that this is good news. In fact, it’s often the opposite. This means they are undersupplying nitrogen, but continue to try to grow more and more crops. Instead of utilizing readily available nutrients, crops have to take nitrogen from the soil – a process called ‘nitrogen mining’. Over time this depletes soils of their nutrients which will be bad for crop production in the long-run.
Globally, NUE has been stubbornly low, at 40% to 50% since 1980.21 This is surprisingly low. It means that less than half of the nitrogen we apply to our crops is actually taken up by them. The rest is excess that leaks into the natural environment.
But there are very large differences in NUE across the world, as shown in the map. Some countries achieve low NUE – less than 40%. Both India and China, for example, have an efficiency of only one-third. Some countries, though, do much better. France, Ireland, the UK, and the US, have an efficiency greater than two-thirds.

How nitrogen use efficiency has changed over time

We can reduce nitrogen pollution without a decline in yields
So, nitrogen efficiency rather than just fertilizer use seems like a better sustainably metric for us to benchmark.
We might assume that all countries could achieve the same high NUE. But, maybe it’s still unfair to compare countries across the world in this way. Differences in climate, vegetation, and soil types mean we can’t achieve the same yields with the same inputs everywhere. Some countries might have more favorable environmental conditions than others.
How can we better understand which countries are doing well in these yield-fertilizer trade-offs?
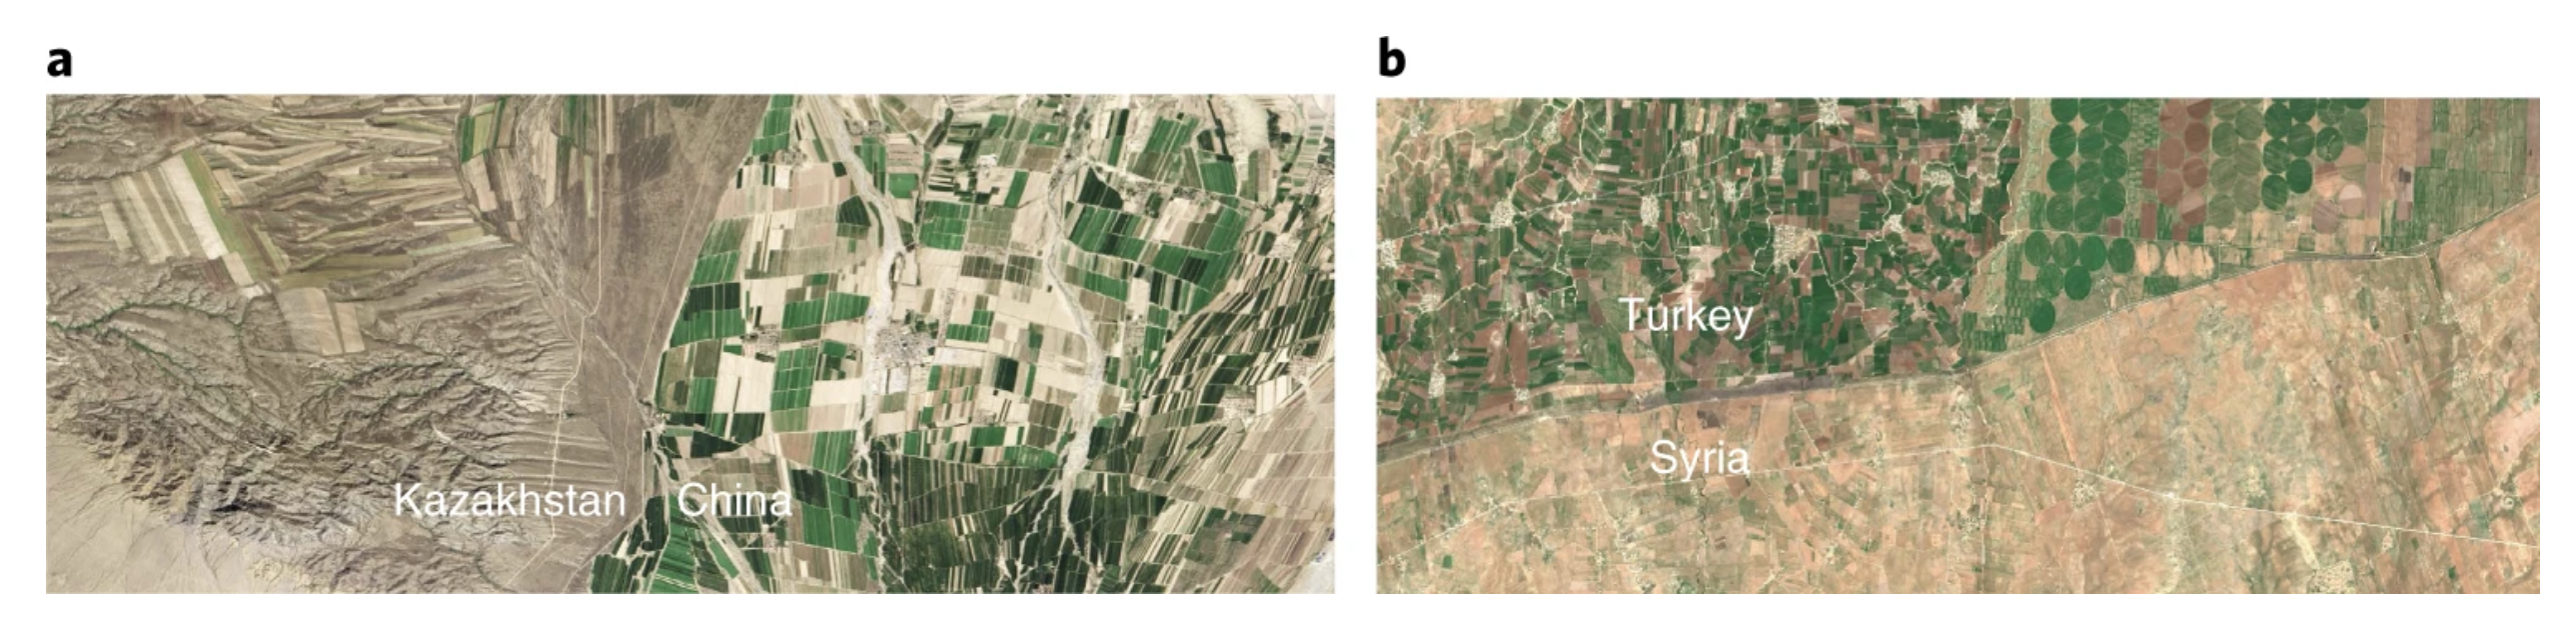
An interesting way to tackle this question is to look at the discontinuities of yields and nitrogen pollution at international borders. This is the approach that David Wuepper and his colleagues took in a recent study, published in Nature.22 By looking at the discontinuities of yields, nitrogen balances and inputs across borders the researchers investigated the role that each country’s agricultural policies play. This is because the environmental conditions, climate and soil qualities should be very similar just across the border. Technically they should be able to achieve a similar level of NUE, and similar yields. If there are large differences in yields or pollution between one country and its neighbor, we would therefore assume there are important country-specific effects playing a role. It mimics a ‘natural experiment’ where the environmental conditions are held constant, and policy decisions are the changeable variable.
The contrast at the border between Kazakhstan and China; and Turkey and Syria provide good examples of this. We can see this in the aerial shots. The conditions for growing crops on either side should be similar. But China and Turkey have much more vegetation than their neighbors as a result of nutrient inputs and how they manage agriculture.
Using satellite imagery and geospatial datasets these researchers could measure four key metrics at high-resolution across hundreds of thousands of cross-country borders: cropland nitrogen balances, nitrogen pollution, yield gaps (the amount that yields could be increased with better management of nutrients), and the natural vegetation potential. They found cross-border differences in the first three metrics, but not in natural vegetation potential. This is important because it means our assumption that the environmental conditions on either side of borders is similar, is a valid one.24
Across this large global dataset, the researchers found that the discontinuity in nitrogen pollution across borders was much larger than the discontinuity in yield gaps. Their results suggest that globally there is massive potential to reduce nitrogen pollution without impacting crop yields.
They conclude that nitrogen pollution could be reduced by around 35% if polluting countries became as efficient as their neighbors. This would have little impact on crop yields – increasing yield gaps by only 1%.
Their results also allow us to understand what countries are using nitrogen inefficiently. The map here shows how countries compare in levels of nitrogen pollution versus their yield gains relative to their neighbors. Positive values – shown in orange and red – mean a country causes more pollution than necessary for the yields that it achieves. Negative values – shown in blue – means a country causes less.
There are a couple of important points we need to keep in mind. All of these values are measured relative to a country’s neighbors. A country might have a good score because their neighbor gets very low yields: South Korea is a good example. Or a country scores well because its neighbor uses nitrogen inefficiently: Mongolia is a good example.
China has the highest score of 170%. This means it causes 170% more nitrogen pollution than is necessary to achieve its level of crop yields. Brazil, Mexico, Colombia, and Thailand also create a lot of pollution. These are the countries that are overapplying nitrogen the most: they could probably reduce fertilizer use significantly without affecting their crop yields.
We often assume that more pollution is an unavoidable cost of trying to close yield gaps. But this trade-off does not always exist.

How can we use nitrogen more efficiently?
You might notice that most of the largest polluters are middle-income countries. During the 1960s and 1970s, many of today’s middle-income countries kickstarted their ‘Green Revolution’ and achieved large increases in food production. Governments offered subsidies for farmers to use fertilizers and other inputs. This made fertilizers cheap and reduced the incentives for farmers to use it efficiently.25 This cheap fertilizer is one of the reasons that these countries massively overapply nitrogen today.
One way that governments can therefore reduce nitrogen pollution is to adjust the ratio of fertilizer prices to the return on agricultural products. They can adjust subsidies to make it costly for farmers to overuse fertilizers. Instead, they could re-allocate these financial resources towards practices that have positive environmental impacts.
Another option is to invert the financial incentives: rather than subsidizing fertilizers, you could tax them.
We might want to make fertilizers more expensive for countries that overuse them. But we actually want to do the opposite for countries with large yield gaps. As we saw earlier, many countries across Sub-Saharan Africa use barely any fertilizer at all. They achieve very poor yields as a result. Providing subsidies for fertilizers and other inputs would be of massive benefit.
One of the challenges of putting fertilizer on your crops is that it can be hard to know where it is needed. Some parts of your field might be lacking in nitrogen while others have more than enough. Often the easiest and quickest solution is to apply it everywhere, especially if fertilizers are heavily subsidized and cheap. But with emerging technologies, we can do better. Thanks to information from drones or satellite imagery, we can implement ‘precision farming’, which allows us to see exactly where fertilizers are needed the most.26 Plant breeding technologies could also offer new opportunities.27 We can try to improve how efficient we are at using nitrogen, but there’s an opportunity to improve how efficiently plants use it too.
Let’s not forget that one of the most promising solutions – and one we often overlook – is the simplest and oldest of all. Legumes – crops such as beans, peas and lentils – perform their own magic when it comes to nitrogen. They have the ability to capture nitrogen in the atmosphere and transform it into reactive nitrogen on their own. This is called ‘biological fixation’. Unlike most other crops where we have to add additional nitrogen, they create it by themselves. Growing more legumes – either on their own, or alongside other crops – is one of the easiest ways that we can bring nitrogen into the soil.
Finally, there’s a lot that we can do by training farmers to adopt sustainable management practices. The 21-million-farmer study in China makes this clear. Large policy changes and technological advancements are often needed to make a large difference, but we shouldn’t underestimate the impact that education can make.
Many view crop yields and environmental pollution as an unavoidable trade-off. It doesn’t have to be. We can reduce pollution a lot without reducing crop yields. Less pollution, more food, higher farmer returns, and less farmland make this a problem with multiple wins if we can implement the right solutions.

