This is part of our entry on global income inequality.
We have just updated our entry on income inequality that mostly looks at the distribution within countries.
–––
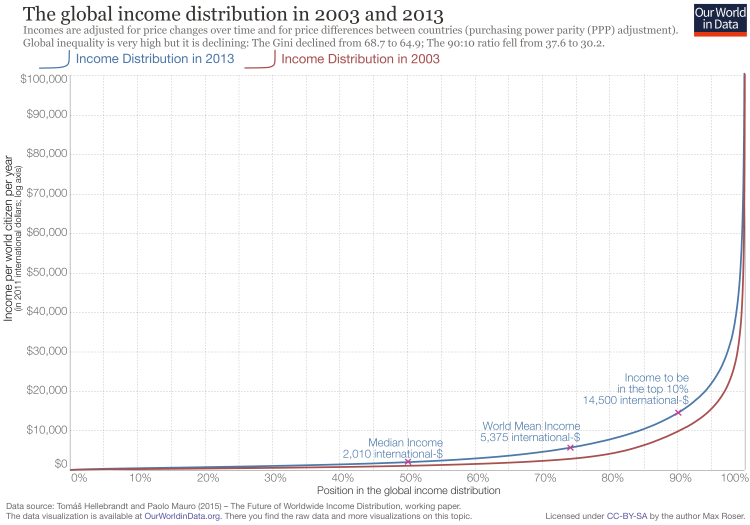
The following visualisation shows global income inequality in 2003 and 2013. The data shown here were carefully prepared by Tomas Hellebrandt and Paolo Mauro from the Bank of England and the IMF.1
You see the yearly disposable income for all world citizens in both 2003 and 2013. On the x-axis you see the position of an individual in the global distribution of incomes and on the logarithmic y-axis you see the annual disposable income at that position.
The increase in prosperity – and decrease of poverty – is substantial. The income cut-off of the poorest 10% has increased from 260 international-$ to 480 international-% and the median income has almost doubled from 1,100 international-$ to 2,010. Global mean income in 2013 is 5,375 international-$.2
The share of the world population living in extreme poverty fell from 25% (in 2002) to 11% in 2013.
The global income distribution in 2003 and 20133
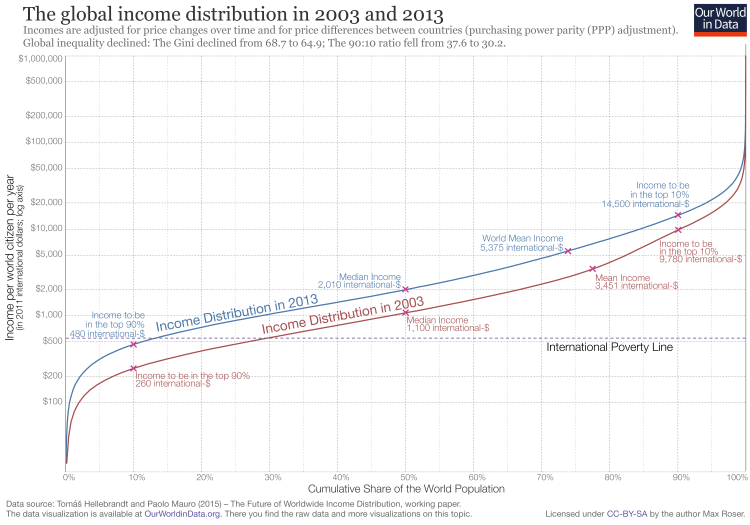
The visualisation below presents the same data in the same way except that the y-axis is now not logarithmic but linear. In this perspective the still very high level of global inequality is shown even more clearly.
The previous and the following visualisation show how very high global income inequality still is: The cut-off to the richest 10% of the world in 2013 was 14,500 int-$; the cut-off for the poorest 10% was 480 int-$. The ratio is 30.2.
While global inequality is still very high we are now living in a period of falling global inequality: In 2003 this ratio was 37.6. The Gini coefficient has also fallen from 68.7 to 64.9 over the ten year period.
Taking the historical experience as a guide for what is possible in the future we have to conclude that global inequality will remain high for a long time. To see this we can ask how long it will take for those with incomes at the poorest 10% cutoff to achieve the current incomes of the richest 10% cutoff which is 14,500 international-$. This income level is roughly the level of GDP per capita above which the poverty headcount gets close to 0% for most countries (see here).
How long does it take for incomes to grow from 480$ to 14,500$?
Even under a very optimistic scenario it will take several decades for the poor to reach the income level of the global top 10%.
2% is roughly the growth rate that the richest countries of today experienced over the last decades (see here). We have seen that poorer countries can achieve faster growth, but we have not seen growth rates of more than 6% over a time frame as long as necessary to reach the level of the global 10% in such a short time. If the past is a good guide for the future the world will very likely be highly unequal for a long time.
| 2% growth | 172.1 years |
| 4% growth | 86.9 years |
| 6% growth | 58.5 years |
| 8% growth | 44.3 years |
| 10% growth | 35.8 years |
The global income distribution in 2003 and 20134