The focus of this entry is land use for agriculture. But we are also studying other uses of land, including land required for human settlement.
Agriculture is a major use of land. Half of the world’s habitable land is used for agriculture. The extensive land use has a major impact on the earth’s environment as it reduces wilderness and threatens biodiversity.
Reducing the consumption of resource-intensive products and increasing the productivity of land makes it possible to produce food with much smaller inputs and reducing the impact on the environment.
All our charts on Land Use
For much of human history, most of the world’s land was wilderness: forests, grasslands and shrubbery dominated its landscapes. Over the last few centuries, this has changed dramatically: wild habitats have been squeezed out by turning it into agricultural land.
If we rewind 1000 years, it is estimated that only 4 million square kilometers – less than 4% of the world’s ice-free and non-barren land area was used for farming.
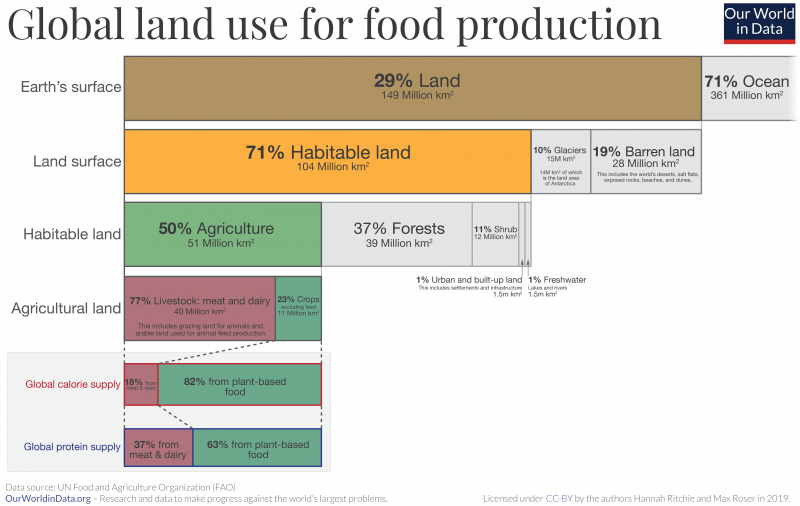
In the visualization we see the breakdown of global land area today. 10% of the world is covered by glaciers, and a further 19% is barren land – deserts, dry salt flats, beaches, sand dunes, and exposed rocks.1 This leaves what we call ‘habitable land’. Half of all habitable land is used for agriculture.2
This leaves only 37% for forests; 11% as shrubs and grasslands; 1% as freshwater coverage; and the remaining 1% – a much smaller share than many suspect – is built-up urban area which includes cities, towns, villages, roads and other human infrastructure.
There is also a highly unequal distribution of land use between livestock and crops for human consumption. If we combine pastures used for grazing with land used to grow crops for animal feed, livestock accounts for 77% of global farming land. While livestock takes up most of the world’s agricultural land it only produces 18% of the world’s calories and 37% of total protein.3
The expansion of agriculture has been one of humanity’s largest impacts on the environment. It has transformed habitats and is one of the greatest pressures for biodiversity: of the 28,000 species evaluated to be threatened with extinction on the IUCN Red List, agriculture is listed as a threat for 24,000 of them.4 But we also know that we can reduce these impacts – both through dietary changes, by substituting some meat with plant-based alternatives and through technology advances. Crop yields have increased significantly in recent decades, meaning we have spared a lot of land from agricultural production: globally, to produce the same amount of crops as in 1961, we need only 30% of the farmland.
With solutions from both consumers and producers, we have an important opportunity to restore some of this farmland back to forests and natural habitats.
How the world’s land is used: total area sizes by type of use & cover
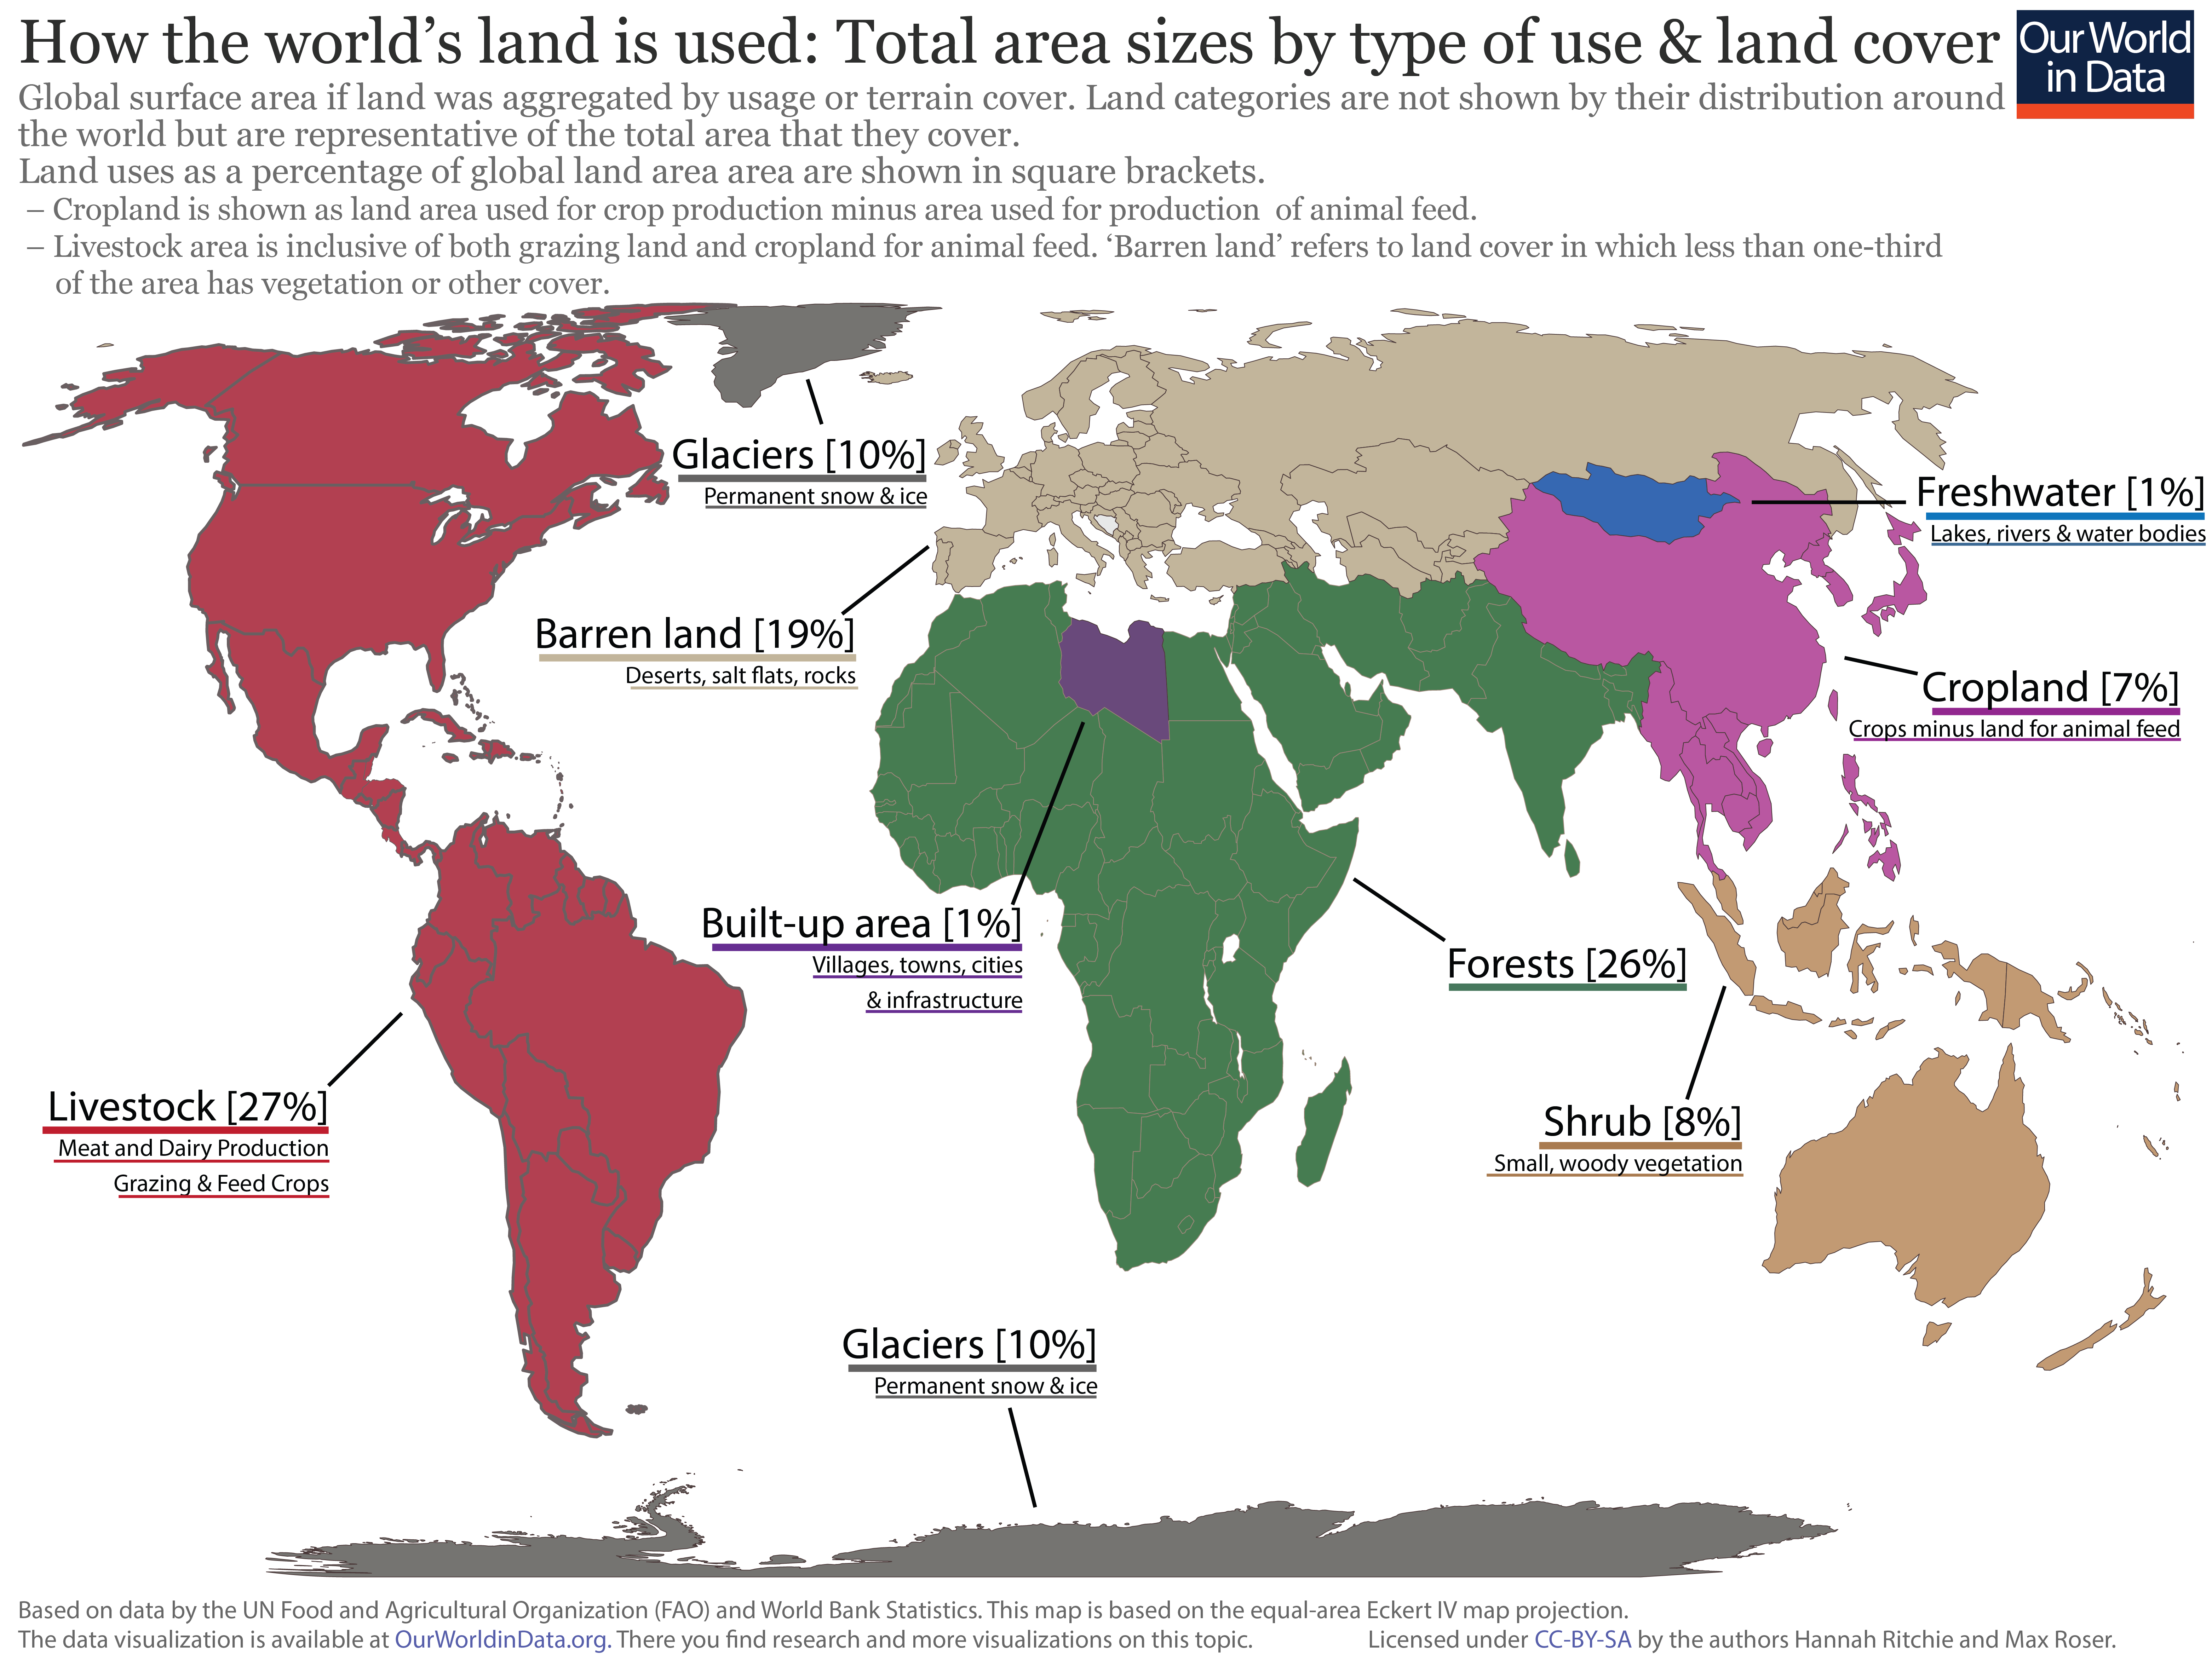
Visualising land use areas on a global map is perhaps the most relatable way to understand the scale of different land uses across the world. In the visualization here we show the graphic displayed above – on the breakdown of global land use & cover – by scale on a global map.
Here, land use groupings are aggregated to show the total surface area allocated for each. Note that these are not used to represent the distribution of each: this figure does not mean the United States is wholly used for livestock, or that Europe comprises only of barren land. It is used to indicate the global areal extent of each land use only.
We see that:
- global land allocated to livestock – either in the form of grazing land or cropland used for animal feed is equivalent to the area of the Americas (North, Central and South America combined);
- cropland (minus land used for the production of animal feed) is equivalent to the area of East Asia-Pacific, extending as far south as Thailand;
- forested area is equal to Africa (minus Libya), the Middle East and South Asia;
- global freshwater (inland water bodies) approximates to the area of Mongolia
- total build-up land (villages, towns, cities & infrastructure) would fit into an area the size of Libya;
- shrub land is equivalent to an area the size of East Asia-Pacific, from Malaysia southwards;
- barren land is equivalent to the size of Europe;
- glaciers (permanent ice & snow) approximates to an area of Antarctica & Greenland combined.
The visualisation shows human land use over the long-term (since 10,000 BC), and details the change in total land used for cropland, grazing land and built-up/urban area in hectares. This can also be viewed by select countries and all regions using the “change country/region” option.


We use roughly half of global habitable land for agriculture. But how much of total land area is utilised for agriculture across the world? In the map here we see the share of total (both habitable and non-habitable) land area used for agriculture.
There is large variability in the share of land a given country uses for agriculture. Allocation ranges from less than ten percent, particularly across countries in Sub-Saharan Africa and the Scandinavian region to close to 80 percent across most regions (including the UK, Uruguay, South Africa, Nigeria and Saudi Arabia). It’s important to note that this metric includes both land used for arable (cropland) production and pasture land for livestock grazing; this means that agriculture can consume a large share of land area, even in arid and semi-arid regions where extensive arable farming is not possible. We will explore this difference in cropland and pastureland in the following section.
If we view the map in “chart” mode, we see how the allocation of land to agriculture has changed over time across the global regions. The share of land used for agriculture has been slowly increasing across most of the world’s regions over the past few decades. However, land use across Europe and Central Asia- particularly within the European Union (EU) zone- and North America has been declining.

Arable agriculture (cropland)
There are two main uses of agricultural land: arable farming (which is land dedicated to growing crops), and pastureland (which includes meadows and pastures used for livestock rearing). In the chart here we see a global map of land used for arable agriculture (as a share of total land area).
For most countries, as we will show in the section below, land use for livestock grazing is dominant relative to arable farming. For most countries, land dedicated to cropland is typically below 20 percent, with many countries dedicating less than 10 percent. There are some notable exceptions, however; countries in South Asia and Europe allocate a large share of land area to arable farming. India, Bangladesh, Ukraine and Denmark all dedicated more than half of total land area to cropland in 2015.

Pastureland (permanent meadows and pasture)
For most countries, the majority of agricultural land is used for livestock rearing in the form of pastureland. In the map here we see the share of permanent meadows and pasture as a percentage of total land area.
As a contrast to arable farming, land use for livestock in Europe and South Asia, in particular, is typically less than 20 percent. However, most continental regions have countries where pastureland reaches close to half of total land area. In some countries (particularly in Central Asia, including Mongolia, Kazakhstan, and Turkmenistan) this can reach up to 70 percent. Livestock farming can take place across a range of diverse climatic and environmental regions (for example, ranging from cattle rearing in temperate regions to sheep farming in hilly and semi-arid terrain); meaning that this type of agriculture is potentially less geographically-constrained than arable farming.


Cropland use per person in the near-term
Global population has more than doubled over the last 50 years. To meet the demands of a rapidly growing population on a planet with finite land resources, reducing our per capita land footprint is essential.
In the chart here we have plotted trends of the average arable land use per person across the world’s regions. Overall we see that the arable land use per capita has declined across all regions since 1961. Per capita land use is highest in North America– more than double the land use of any other region. Land use in Asia– both in South and East Asia is lowest (5-6 times less than in North America). Rates of reduction in South Asia have been the most dramatic; per capita land use in 2014 was roughly one-third of its value in 1961.


Agricultural land per person over the near-term
If we extend our land coverage above from arable land use to total agricultural land (which is the sum of arable, permanent crops and pastures and meadows), we still see overall declines in land per person but with different rates and patterns of reduction. Overall, we see that agricultural land per person is higher than that of arable land. At the global level, per capita agricultural land use is now less than half its value in 1961.
Africa in particular has seen dramatic reductions in agricultural land per person – now less than one-third of per capita land 50 years ago. The Americas (North and South) and Africa have notably higher per capita agricultural land use relative to Europe and Asia.

In the chart here we see the global area of land use in agriculture by major crop types, from 1961 to 2014. Overall, we see that the majority of our arable land is used for cereal production; this has grown from around 650 to 720 million hectares (an area roughly twice the size of Germany) over this period. The total land area used for coarse grains has remained approximately constant over this 50 year period, and is the 2nd largest user of arable land.
The most dramatic increase in land allocation is in the production of oilcrops. Total land area used for oilcrop production has increased almost 3-fold since 1961– an area just short of the size of Mexico. All other crop types take up less than 100 million hectares of global area.

The amount of land required to produce food has wide variations depending on the product–this is especially true when differentiating crops and animal products. In the chart here we have plotted the average land required (sometimes termed the “land footprint”) to produce one gram of protein across a range of food types.
At the bottom of the scale, we see that cereal crops typically have a small land impact per unit of protein (although such protein is often lacking in some essential amino acids). At the upper end of the spectrum we find meat products, with the land required for beef or mutton up to 100 times larger than cereals. However, it’s important to note the differences in land required across the meat products: poultry and pork have a land footprint 8-10 times lower than that of beef. This means individuals can make notable reductions in the environmental impact of their diets simply by substituting lower-impact meat products for beef or mutton.

Arable land needed per unit of crop production
This visualization shows the index of the arable land area needed to produce an equivalent aggregate of crop production, relative to the land area needed in 1961 i.e. values in 1961 are equal to 1.0. For example, globally in 2014, the index value was 0.3; this means only 30% of the arable land area was needed to produce the same quantity of crops relative to 1961. 70% less land was needed.
This data can be viewed for other countries and regions by selecting ‘
Add country
’ on the chart.
The crop production index (PIN) is the sum of crop commodities produced (after deductions of quantities used as seed and feed). It is weighted by the commodity prices. The FAO explains the construction of the PIN in detail here.
The idea for this chart is taken from Ausubel, Wernick, and Waggoner (2013).5
The authors write: ‘A combination of agricultural technologies raised yields, keeping downward pressure on the extent of cropland, sparing land for nature.
Countering the global rise of population and affluence by parents and workers, consumers and farmers restrained the expansion of arable land by changing tastes and lifting yields. The noticeable shrinkage in the extent of cropland as a function of the Crop Production index since 1990 provides encouragement that farmers will continue sparing land.’

Land use categories
The following discussions on global land use (particularly in relation to agriculture) cover a number of definitions and combined categories. It is therefore useful to understand the differences between land use terminology; for example, the definition of “arable land” versus “agricultural land”.
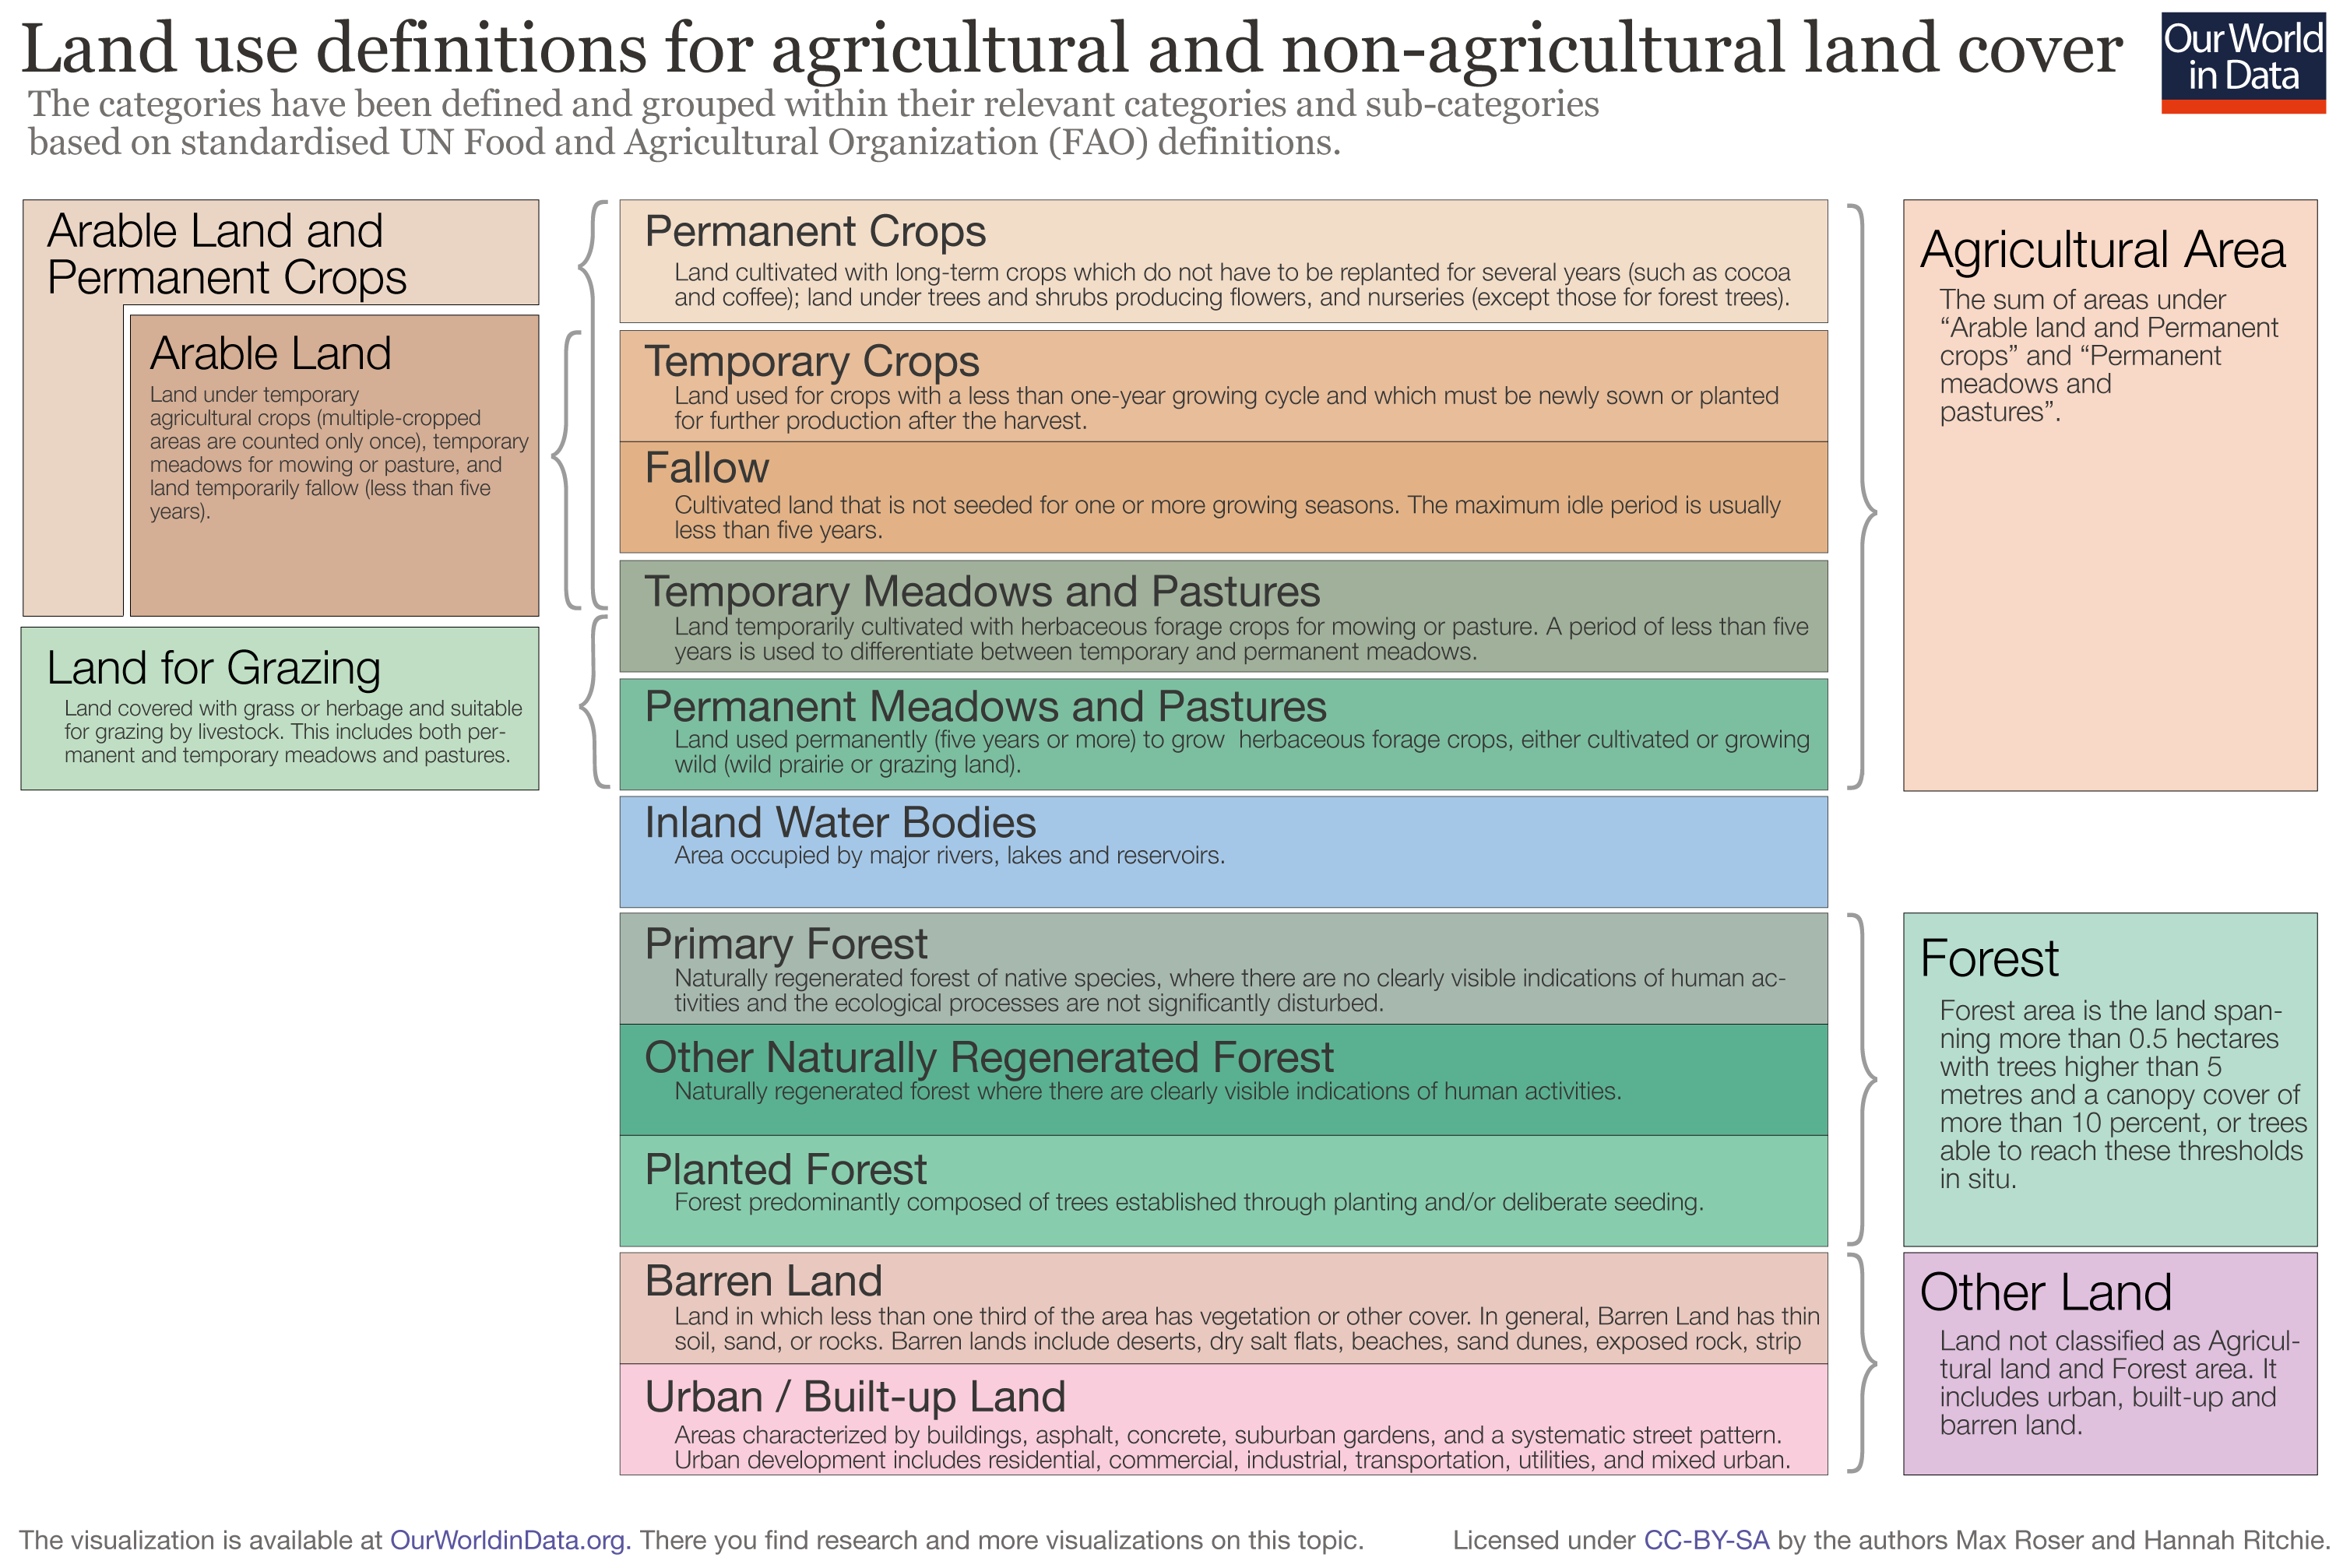
To provide some clarity on the definitions used here (and the common terminology within the literature) we have visualised these land use categories and groupings in the chart shown here. Also shown are the definitions of each. The groupings and definitions shown below are based on the UN Food and Agricultural Organization (FAO) and should therefore be consistent with most international data sources.
Definitions of agricultural land use
The Land Area of the World is 13,003 million ha. 4,889 million ha are classified as ‘agricultural area’ by the FAO (this is 37.6% of the Land Area).
The agricultural area use is divided into 3 categories: arable land (28% of the global agricultural area), permanent crops (3%) and permanent meadows and pastures (69%) which account for the largest share of the world’s agricultural area.6
What do these words mean?
The agricultural area is the sum of arable land, permanent crops, permanent meadows and pastures.
The FAO definition for arable land is land under temporary agricultural crops (multiple-cropped areas are counted only once), temporary meadows for mowing or pasture, land under market and kitchen gardens and land temporarily fallow (less than five years). The abandoned land resulting from shifting cultivation is not included in this category. Data for “Arable land” are not meant to indicate the amount of land that is potentially cultivable.'7
The same source defines permanent crops as follows: ‘Permanent crops are divided into temporary and permanent crops. Permanent crops are sown or planted once, and then occupy the land for some years and need not be replanted after each annual harvest, such as cocoa, coffee and rubber. This category includes flowering shrubs, fruit trees, nut trees and vines, but excludes trees grown for wood or timber. And again from the same source the definition for permanent meadows and pastures is ‘land used permanently (five years or more) to grow herbaceous forage crops, either cultivated or growing wild (wild prairie or grazing land).’
The FAO definition for fallow land is ‘the cultivated land that is not seeded for one or more growing seasons. The maximum idle period is usually less than five years.’