Cities in most high-income countries have relatively low levels of local air pollution. This, however, hasn’t always been the case.
National air pollution trends often follow the environmental kuznets curve (EKC). The EKC provides a hypothesis of the link between environmental degradation and economic development: in this case, air pollution initially worsens with the onset of industrial growth, but then peaks at a certain stage of economic development and from then on pollution levels begin to decline with increased development. Many high income nations are now at the late stage of this curve, with comparably low pollution levels. Meanwhile, developing nations span various stages of the growth-to-peak phase. I have previously written about this phenomenon in relation to sulphur dioxide (SO2) emissions here on Our World in Data.
If we take a historical look at pollution levels in London, for example, we see this EKC clearly. In the graph, we have plotted the average levels of suspended particulate matter (SPM) in London’s air from 1700 to 2016. Suspended particulate matter (SPM) refers to fine solid or liquid particles which are suspended in Earth’s atmosphere (such as soot, smoke, dust and pollen). Exposure to SPM – especially very small particles, which can more easily infiltrate the respiratory system – has been strongly linked to negative cardiorespiratory health impacts, and even premature death. As we see, from 1700 on, London experienced a worsening of air pollution decade after decade. Over the course of two centuries the suspended particulate matter in London’s air doubled. But at the very end of the 19th century the concentration reached a peak and then began a steep decline so that today’s levels are almost 40-times lower than at that peak.
The data presented has been kindly provided by Roger Fouquet, who has studied the topic of environmental quality, energy costs and economic development in great detail.1

The dominant contributor to London’s historic air pollution was coal burning. Throughout the 18th and 19th centuries, the coal industry in Great Britain expanded rapidly; driven not only by economic growth, but also by an expanding labour force and improved distribution networks (such as railways and waterways).2,3 Increasing demand and falling coal prices (prices nearly halved between 1820 and 1850) led to a rapid increase in national coal consumption, rising from 20 million tonnes in 1820 to 160 million tonnes in 1900 (an eight-fold increase).4
The decline in air pollution can be attributed to a complex mix of factors, including economic restructuring away from heavy industry, switching energy sources, and increased environmental regulation.5 There are thought to be three primary developments which led to this decline.6 Firstly, by the late 1800s, improved connectivity and commuter links allowed London’s population to spread further into surrounding suburban areas, inevitably leading to an overall reduction in population density. Even if such changes did not lead to a reduction in total emissions of pollutants, the dispersal and spreading of these population centers lessened the exposure in prime pollution hotspots.
Secondly, the United Kingdom introduced its Public Health Act for London in 1891. Under this new regulation, businesses in London which produced excessive smoke ran the risk of financial penalties if they did not adopt cleaner and more efficient energy practices, such as switching to less polluting (but more expensive) coal sources, and ensuring fires were adequately stoked. This put increasing pressure on businesses to shift towards better and cleaner industry practice.
The third potential source of this decline was a notable shift in heating and cooking sources from coal towards gas. Uptake of gas cookers rose sharply in Great Britain during the 1800 and 1900s. The Gas Light & Coke Company—which was the leading London supplier at the time—noted that in 1892 only 2 percent of residents had a gas cooker. By 1911, this had increased to 69 percent.7 In terms of air pollution impacts, gas is a much cleaner fuel relative to coal, meaning that such a large shift in heating and cooking sources may have contributed to the declining trend.
It’s difficult to fully capture just how polluted London’s air was throughout the 19th century. Throughout this period, London experienced frequent and severe fogs. Such fogs were often so dense that they halted railway journeys, interrupted general economic activities, and even contributed to London becoming a breeding ground for crime (crime rates rose sharply during these fog periods). London averaged 80 dense fog days per year, with some areas recording up to 180 in 1885.8
Not only did air pollution incur a severe economic price, it also resulted in significant health costs. Air pollution deaths throughout this period rose steeply; in London, mortality from bronchitis increased from 25 deaths per 100,000 inhabitants in 1840 to 300 deaths per 100,000 in 1890. At its peak, 1-in-350 people died from bronchitis.9
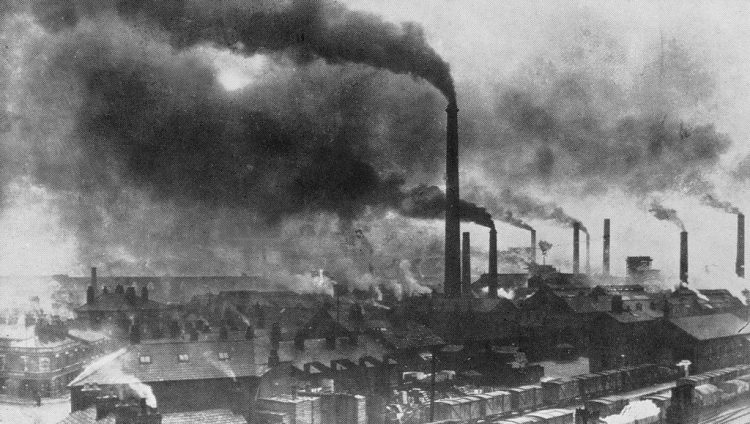
Although London was arguably one of the worst polluted cities during this time (and often referred to as the “Big Smoke”), many other industrial cities across Great Britain (and indeed across other nations) experienced similar air pollution problems. In the photograph below, we see pollution in Widnes, an industrial town close to Liverpool, in the late 19th century.
Air pollution in Widnes, late 19th century10
London vs. today’s developing cities
From our first chart, we see that concentrations of suspended particulate matter (SPM) reached up to 623 micrograms per cubic metre. This figure will be meaningless to most without proper context. Let’s therefore compare historic London concentrations to those experienced in recent years in New Delhi—one of the world’s most polluted cities today.
In the first chart above, we can add SPM trends for Delhi from the later 1990’s to 2010 using the ‘add city’ button.11
What we see is that concentrations in Delhi range from around 450 to 500 micrograms per cubic metre. This is extremely high, but remains lower than peak concentrations in London during its rapid industrialization. It is wrong to assume that today’s major developing cities—such as Delhi, Beijing, Jakarta, Karachi—are experiencing unprecedented levels of air pollution. It’s likely that many of today’s high-income cities have gone through similar periods of high (or higher) pollution levels. Perhaps what differentiates today’s transitioning cities is the population sizes which inhabit them; exposure to such pollution undoubtedly leads to high mortality figures in absolute terms.12
If we see air pollution as a by-product of economic and industrial development, an appropriate comparison would be based on levels of prosperity, rather than versus time. In the chart below we have plotted the same trends in SPM (on the y-axis) for London and Delhi, but now map these levels relative to gross domestic product (GDP) per capita (on the x-axis). These GDP per capita figures are adjusted for inflation and expressed in international dollars to reflect differences in living costs.
Interestingly, if we observe the evolution of these trends with time, we see that at a given level of GDP per capita, Delhi’s air pollution levels have, and continue to, follow a similar pathway to that of London in the 19th century.
But the often-forgotten history of air pollution in today’s rich countries offers an important lesson about what is possible for world regions with lower levels of prosperity today. After air pollution worsens at the initial stages of development it declines at later stages and can reach historically low levels.
The key for Delhi and other transitioning cities will therefore be to continue shifting rightwards (increasing GDP per capita), but to try to peak below London’s 19th century pathway. If they can achieve this, then they will have succeeded in developing in a cleaner way than today’s high income cities.
