Malaria is a disease that is transmitted from person to person by infected mosquitoes. The bite of an infected Anopheles mosquito transmits a parasite that enters the victim’s blood system and travels into the person’s liver where the parasite reproduces. There the parasite causes a high fever that involves shaking chills and pain. In the worst cases malaria leads to coma and death.
The parasites are single-celled microorganisms of the Plasmodium group. Plasmodium falciparum is by far the most lethal in humans and responsible for most deaths.
The annual death toll is certainly in the hundreds of thousands, but estimates differ quite substantially between different global health organizations: The World Health Organization (WHO) estimates that 438,000 people died because of malaria in 2015; the Institute of Health Metrics and Evaluation (IHME) puts this estimate at 620,000 in 2017.
Most victims are children. 57% of malaria fatalities are children younger than 5 years old. It is one of the leading causes of child mortality. Every twelfth child that died in 2017, died because of malaria.1
All our charts on Malaria
In the visualizations we provide estimates of the total number of deaths from the World Health Organization (WHO) from 2000 to 2015, and the Institute of Health Metrics and Evaluation (IHME), Global Burden of Disease (GBD) from 1990 to 2017. These estimates are notably different across various countries which affects the total number of reported deaths. IHME figures, as shown, tend to be higher; they report deaths of 658,000 in 2015 versus only 438,000 from the WHO. Further information on the confidence intervals of WHO estimates, and a country-level comparison between these two sources is covered in our section on Data Quality & Definitions.
Since the beginning of the 21st century, the WHO has published global estimates of the number of people that die from malaria. In these 15 years the global death toll has been cut in half: from 839,000 deaths in 2000 to 438,000 in 2015.
Africa is the world region that is most affected by malaria: In 2015, the African continent held 9 out of 10 malaria victims (click on ‘Expand’ to see this). But Africa is also the world region that has achieved most progress: from 2000 to 2015, African deaths from malaria were reduced from 764,000 to 395,000.

The Institute of Health Metrics and Evaluation (IHME) provide estimates of malaria deaths from the year 1990 onwards. Over this period we see a clear rise-peak-fall trend, increasing from around 670,000 deaths in 1990; peaking at around 930,000 in 2004; and then declining (although at varying rates) to around 620,000 in 2017.
These estimates are notably higher than those of the WHO (see Data Quality & Definitions for further details). Although divergent on the total number of malaria deaths, both the IHME and WHO estimate that 90 percent (9 in every 10 deaths) are from the African region.

The visualization categories the annual number of deaths by age group. These figures are those published by the IHME, Global Burden of Disease [the WHO does not publish country-level data on malaria deaths by age]. Note that you can view these trends for any country in the chart.
At a global level, the most vulnerable age group to malaria deaths are children under five years old — in 2017 they accounted for 57 percent of total deaths. The number of deaths from malaria tends to decrease with age; with those over 70 years old accounting for around five percent. When age categories are combined, children under 14 years old account for more than two-thirds of mortality.

The visualization shows the age-standardized death rate from malaria, measured as the number of deaths per 100,000 individuals.

The visualisation shows the breakdown of death rates from malaria (measured as the number of deaths per 100,000 individuals) by age category.

The map shows the number of new malaria cases per 100,000 individuals across the world. The malaria incidence is highest in the central part of Africa north and south of the equator.

Humanity’s fight against malaria has a history of many thousand years.2
For most of that time humanity was exposed to the disease without any defense.
The history of humanity is so closely entangled with the history of malaria that the disease left its mark on our bodies. Sickle cell disorder is a genetic disease that deforms red blood cells to be sickle-shaped. Carriers suffer from attacks of pain from a young age and their lives are cut short by the condition: it causes around 55,000 deaths every year.3
Why would such a genetic mutation not die out? The reason for the continued existence is that the same disorder hinders the malaria parasite from reproducing so that the carrier is provided with a protective advantage in environments where malaria exists. The prevalence of sickle cell disorder today is testament to the high-malaria environments in our species’ history.4
Malaria did not only leave its mark on our body, but in many ways also on our history. Malaria is presumed to have been the secret ally that helped the barbarians bring about the downfall of Rome. The examination of the teeth and bones of the Romans by archeologists has recently brought together more and more evidence that the mosquito-borne fever once thrived in the warm, marshy river valleys of the Tiber and the Po in the Roman empire. The disease enfeebled the mightiest army of the ancient world directly through epidemics and indirectly by reducing the productivity in the agricultural sector and hastened the fall of Rome.5
A disease that is powerful enough to afflict the mightiest armies also left its mark on the fate of societies and the lives in many regions of the world.6
One of the first medicines humanity discovered that actually had a beneficial effect was quinine, an extract from the bark of the cinchona tree.7 The quinine powder was either drunk with wine or dissolved in water, a mixture that became known as Tonic Water. But Quinine is so bitter that Tonic Water with concentrations high enough to be effective against malaria were unpleasant to drink. The British colonial officers stationed in malarious India therefore started to add sugar, lime and gin and thereby created a drink that is still popular today: the Gin and Tonic.
Malaria was common across half the world – since then it has been eliminated in many regions
Malaria left its mark on our history, our bodies, drinks, and for thousands of years the deaths of people in all corners of the world.
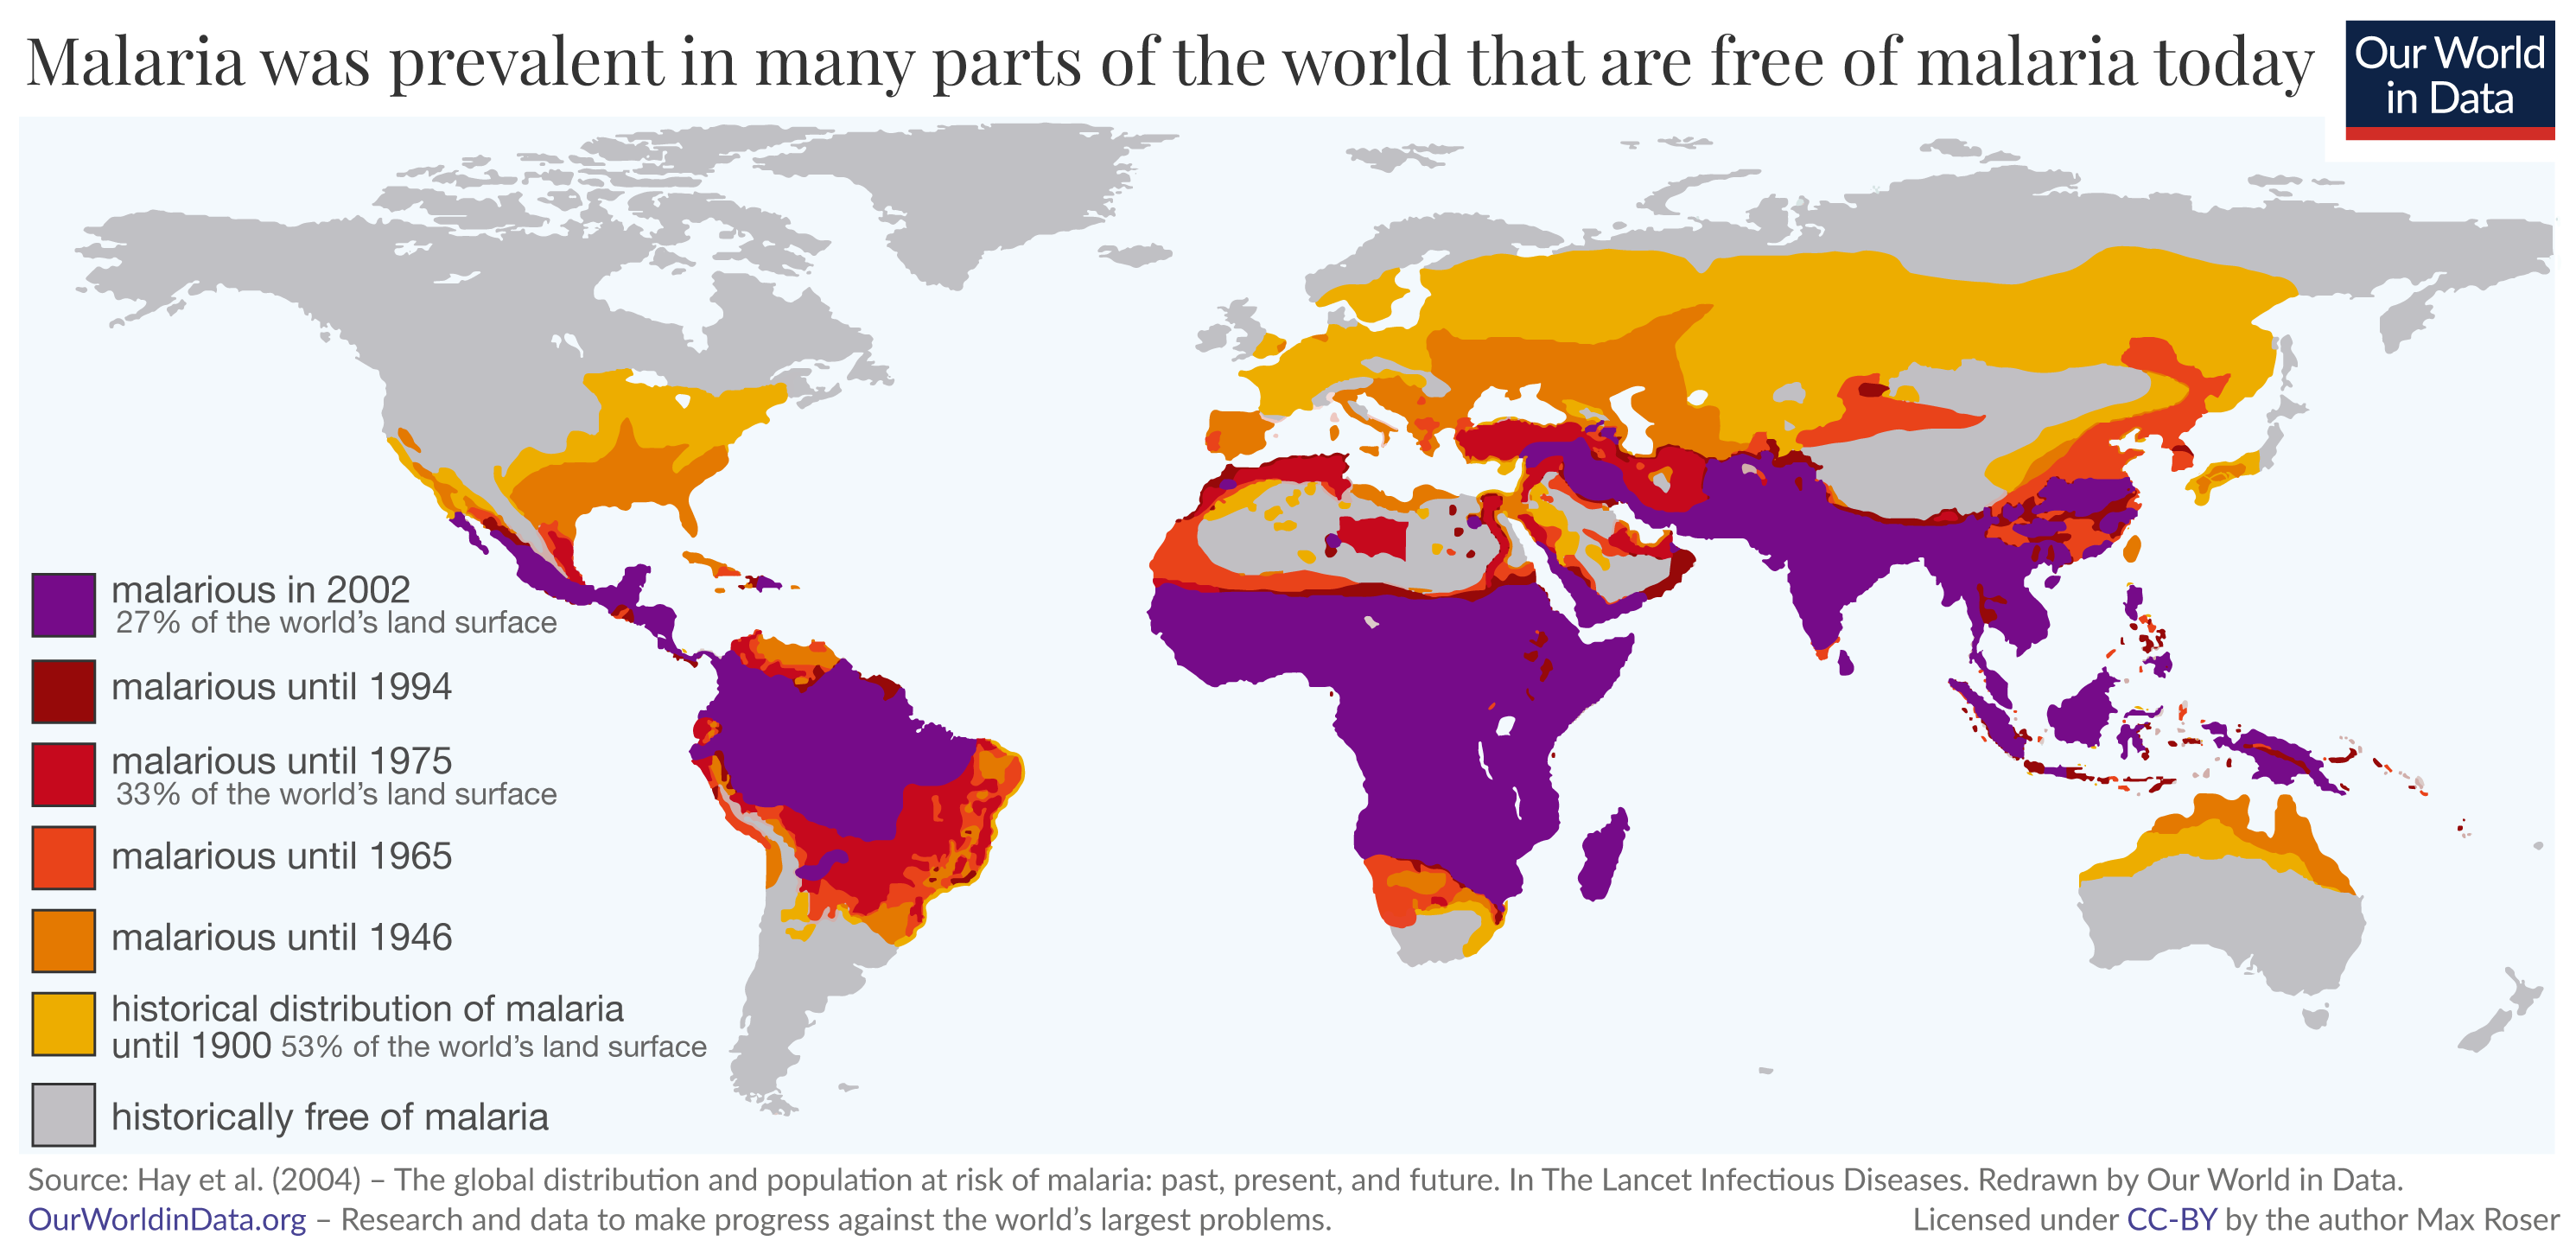
But in the last few generations, humanity gained ground in this long-lasting battle against the disease. The map shows in which regions of the world malaria is prevalent today (in purple) and where it was prevalent in the past. Just a few generations ago malaria was common in many more places around the world than it is today. Over the course of the 20th century the disease was eliminated in many populous regions of the world, saving the lives of millions.
What the map makes clear is that malaria is not a tropical disease, but a disease that was eliminated everywhere except for the tropics. Historically malaria was prevalent in Europe and North America – poet Friedrich Schiller contracted the disease in Mannheim, Oliver Cromwell in Ireland, and Abraham Lincoln in Illinois.8
Since then the disease has been eliminated not only there, but also in East Asia and Australia and in many parts in the Caribbean, South America, and Africa.
The researchers estimate that historically – and up to around 1900 – our ancestors were at risk from malaria across about half of the world’s land surface (53%). Since then the area where humans are at risk of malaria contracted to a quarter (27%).
The WHO reports that the global mortality rate has declined by 90% between 1900 and the end of the 20th century.9
Why are these parts not malarious anymore?
Three factors were responsible for this global reduction of malarious regions:10
First, public health measures, especially the widespread use of insecticides to attack the mosquito. Second, the drainage of swampland for expanding agricultural land had the side effect of restricting the breeding grounds for mosquitoes. And third, social and economic development which not only made treatment available to those that were infected, but also led to improvements in housing conditions which lowered the chances of infection in the first place.
All three factors – insecticides, land use change, and economic development – were major reasons that Europe and the other regions shown in shades of yellow, orange, and red are free of malaria today.
Map of past prevalence of malaria11
Malaria in the US
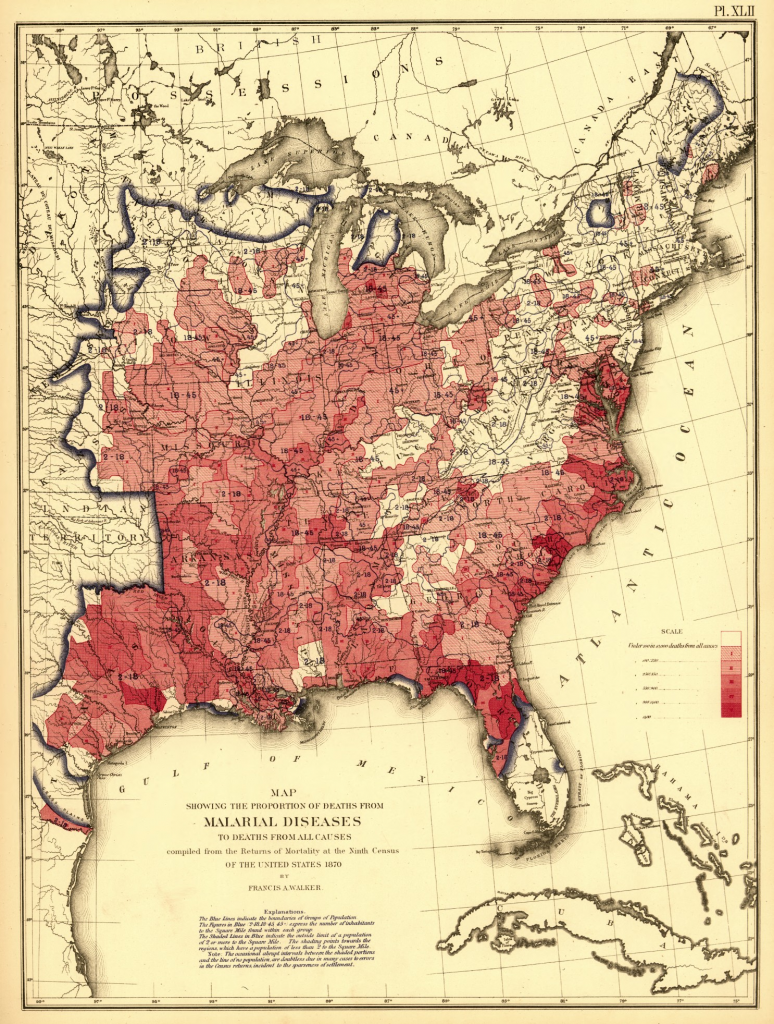
The map is taken from the US census from 1870. It shows in detail what the previous section discussed. Shown is the share of all deaths caused by malaria in the American Southeast more at that time.
Malaria was very prevalent in this region that is free of malaria today. Particularly along the coasts and along the Mississippi malaria killed many Americans.
Proportion of deaths from malaria to deaths of all causes – US Census 187012
The world has already been very successful against this disease which is one of the most deadliest diseases in humanity’s history. How was this possible and what can we do to continue this progress?
Insecticide-treated bednets
Even after a century of progress against malaria, the disease remains devastating for millions. The World Health Organization estimates that 216 million suffered from the disease in 2016.13
Fortunately only a small fraction of malaria victims die of the disease. But those who die are the very weakest; three out of four malaria victims are children younger than 5 years old making it one of the leading causes of child mortality in the world today.14
The world is making progress against malaria
In the history of improving population health, the most important progress is made in the prevention of disease; for infectious diseases this means interrupting its transmission. But humanity’s most ingenious and successful way of transmission interruption – immunization through vaccines – is not yet available for malaria. However, very recent developments are encouraging; at the time of writing the WHO has rolled out a first large-scale trial of a vaccine.15
But we have other weapons in our arsenal.
One line of humanity’s attack on the mosquito-borne fever is to progressively reduce the area in which malaria is prevalent. A second one is to prevent the transmission of the parasite where it is still prevalent. It is a surprisingly simple technology that stopped transmission and saved the lives of millions in the last few years alone.
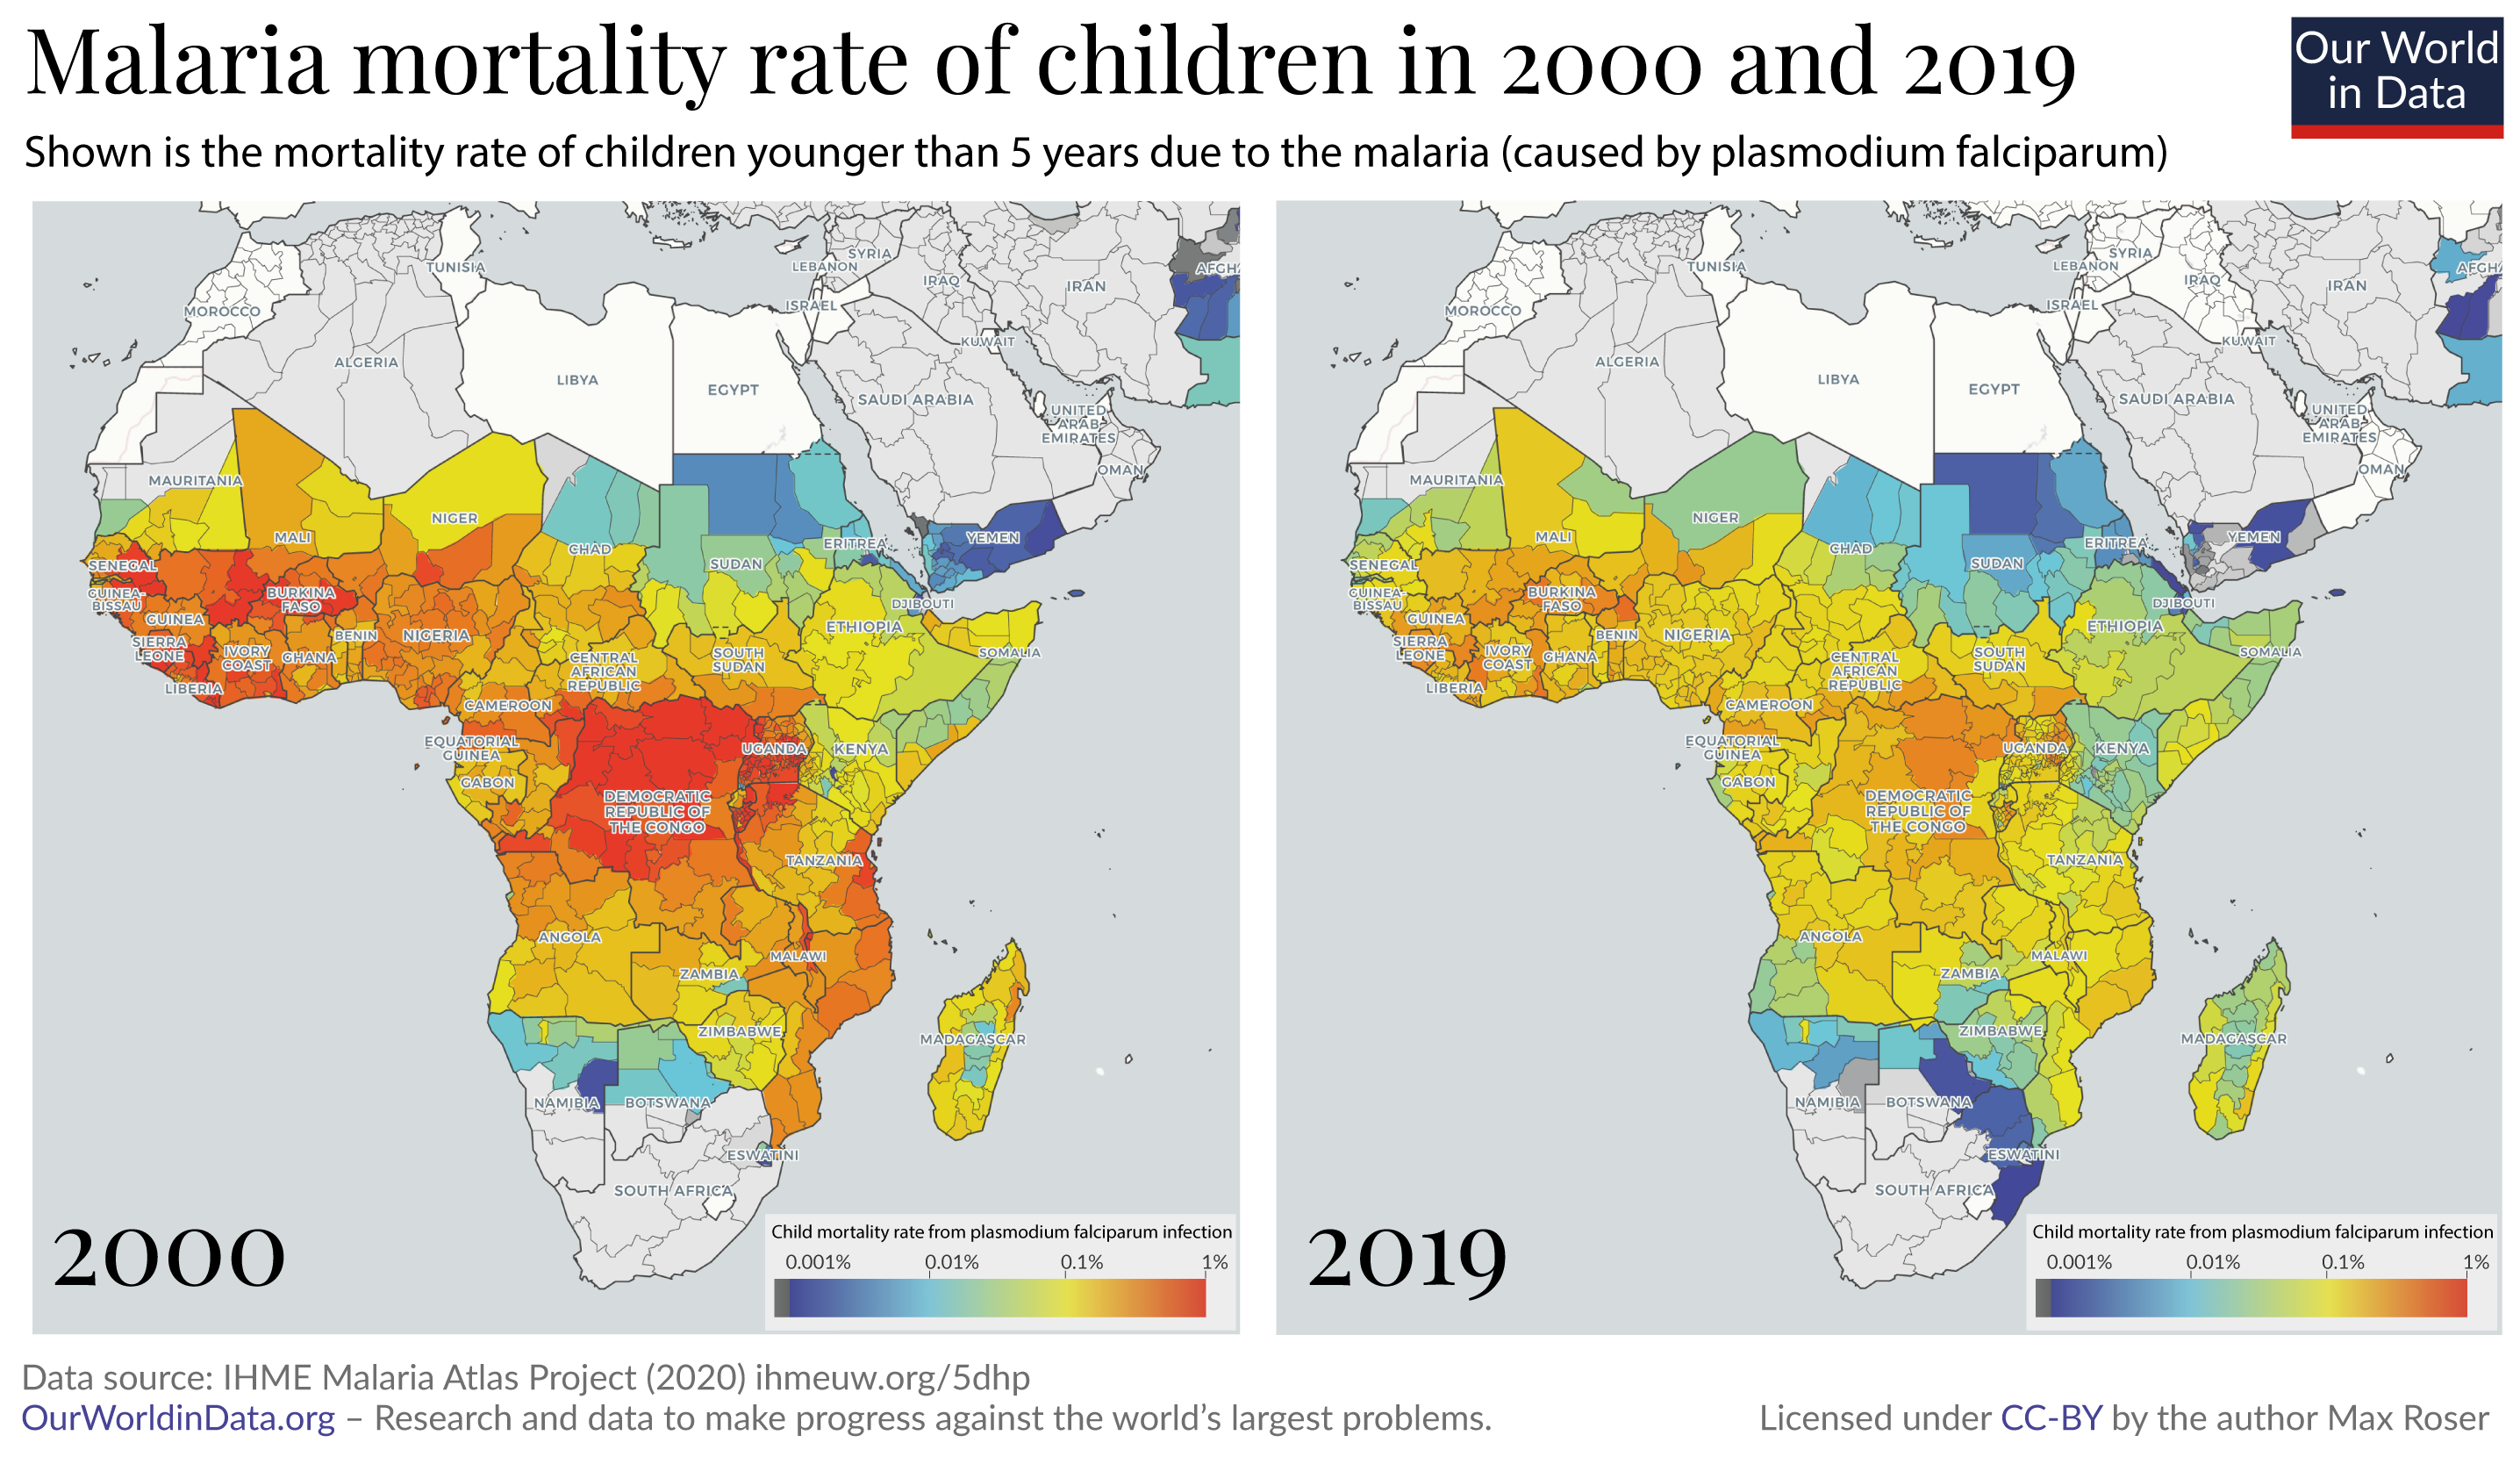
The years since the turn of the millennium were an extraordinarily successful era in the fight against malaria. The two maps shows the change of malaria mortality for children in the region where the disease causes the highest death toll.
From 2000 to 2015 the number of malaria deaths has almost halved, from 840,000 deaths per year to 440,000, according to the World Health Organization.16
A recent publication in Nature17 studied what made this success possible. The focus of the study was Africa, where – as the chart shows – most of the recent reduction was achieved. The researchers found that the single most important contributor to the decline was the increased distribution of insecticide-treated bed nets. The bed nets protect those who sleep under them.
The insecticide used on the bed nets kills the mosquitoes. So a community where a sufficiently high number of people sleep under bed nets the entire community is protected, regardless of whether they themselves use the bed nets. This is similar to the positive externality effect that vaccination has on communities.
The authors of the Nature study estimate that bed nets alone were responsible for averting 451 million cases of malaria in Africa between 2000 and 2015. The other two interventions that were important for the reduction in the disease burden of malaria were indoor residual spraying (IRS) and the treatment of malaria cases with artemisinin-based combination therapy (ACT). The study’s authors estimate that the three interventions averted 663 million cases of malaria in the 15 year period. Insecticide-treated bed nets were by far the most important intervention of the three, preventing 68% of the averted cases.
We can do more
Progress never happens by itself. For millennia our ancestors were exposed to the malaria parasite without defense; the fact that this changed is the achievement of the scientific and political work of the last few generations.
Today we are in the fortunate situation that we have some decades of progress behind us: We can study what worked and use this knowledge to go further.
To continue the improvement in global health more has to be done, and more can be done. Some of the most important research in global development asks the question where donations can do the most good. It’s not always the case that donations do much good. Often it is unfortunately not possible to achieve much progress by donating money because funding is not the limiting constraint or the proposed solution does not actually work. But in some areas we can achieve extraordinary progress by making funding available. A charity evaluator that is doing very rigorous work is ‘GiveWell’ and on the very top of their recommended charities are two organizations that are fighting malaria – the Against Malaria Foundation and the Malaria Consortium.
The diseases many children die from are preventable – we therefore know that we can continue this reduction of child mortality, if we choose to do so. What is different from the past and what makes the deaths of children so appalling today is that we now know how to prevent them.
The evidence shows that the fight against malaria is still underfunded; it will depend on this funding and work whether it is possible to continue our progress against it.19
It requires the commitment from governments around the world, but it is also something where each of us individually can contribute. Every one of us can contribute so that we continue to reduce the number of children that die in the world.
- If you want to know more before you donate, GiveWell’s information on malaria can be found here.
- And if you want to donate right away to help the successful fight against malaria you can do so via the page of GiveWell’s recommended charities.

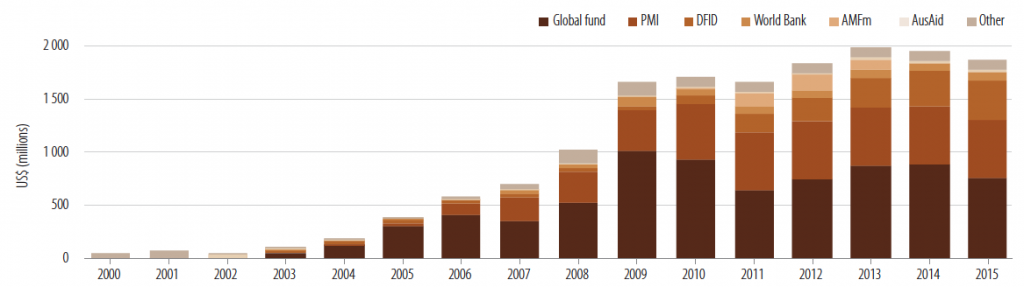
Funding for malaria control
Funding for malaria control has increased dramatically from 2000, but has recently stalled.
Past and projected international funding for malaria control, 2000-2015 – WHO (2012)20
A vaccine against malaria
Alphonse Laveran discovered already in 1880 that the Plasmodium parasite is the cause for malaria.21 But all earlier attempts of developing a vaccines were unsuccessful. Malaria vaccines such as SPf66 were insufficiently effective and until recently none of the scientific efforts led to a licensed vaccine.22
This has changed with the malaria vaccine RTS,S, the world’s first licensed malaria vaccine, which has been approved by European regulators in 2015. The vaccine is undergoing pilot trials in select countries and it is hoped to provide protection from the parasite in the future.23
Malaria and economic prosperity
Okorosobo et al. (2013)24 estimate that the malaria “penalty” to GDP ranges from 0.41% of GDP in Ghana to 8.9% of GDP in Chad, all of which could be regained following elimination of malaria. Complete eradication of the disease would increase GDP in Uganda by 50 million USD.
Azemar and Desbordes (2009)25 find that in the median sub-Saharan African country, foreign direct investment could increase by as much as one-third as a result of malaria and HIV eradication, slightly more than one-half of this is attributed to malaria.

The United Nations give the following definitions:26
The malaria incidence rate (Ii) is the number of new cases of malaria (Cases) divided by the total population (Pop) and multiplied by 100,000.
Ii = (Cases / Pop) * 100,000
The malaria death rate (Id) is the number of deaths due to malaria (Deaths) divided by the total population (Pop) and multiplied by 100,000.
Id = (Deaths / Pop) * 100,000
In our section on Deaths Due to Malaria, we present regional estimates from the World Health Organization (WHO) and the Institute of Health Metrics and Evaluation (IHME), Global Burden of Disease (GBD). These estimates in some cases differ notably.
In the chart we have plotted annual deaths from malaria by country, from IHME estimates (y-axis) versus estimates from WHO (x-axis). Note that the latest WHO estimates by country are only available for the year 2013. Also shown is the line of parity: countries that lie along this line have the same estimated number of deaths from the IHME and WHO; countries which lie above this line have higher estimates from IHME; and those below have higher estimates from WHO.
For many countries — although not all — IHME estimates tend to be higher than WHO figures. This difference for some countries is highly significant; for example, in 2013, IHME estimates for Nigeria, Democratic Republic of Congo and India were approximately double that of WHO figures. The discrepancy between these estimates results from differences in methodology, data coverage and sourcing. Figures shown in this entry from both IHME and WHO will continue to be updated as new data is released — hopefully this data will begin to converge with time.

- Data: Data on cases, deaths (reported and estimates) and prevention and treatment
- Geographical coverage: Global – by country and WHO region
- Time span: Since 2000 (for reported deaths); shorter for other measures.
- Available at: Online here.
- WHO data on malaria deaths and cases (1990-2006) is also available through Gapminder where it can be plotted against a second indicator.
- Data: Death rates & absolute number of deaths from malaria
- Geographical coverage:Global, across all regions and countries
- Time span:Available from 1990 onwards
- Available at: Online here
- Data: Children with fever receiving antimalarial drugs (% of children under age 5 with fever), use of insecticide-treated bed nets (% of under-5 population)
- Geographical coverage: Global – by country & world region
- Time span: Annual data – since 2000.
- Available at: Online here.
- Data: Notified cases of malaria (per 100,000 people) and malaria death rate (all ages & ages 0-4)
- Geographical coverage: Global – by country and region.
- Time span: Only very recent data.
- Available: Notified cases of malaria (per 100,000 people) here.
Malaria death rate (all ages) here.
Malaria death rate (ages 0-4) here.
- Data: Detailed survey data from African countries
- Geographical coverage: Some African countries.
- Time span: late 2000s
- Available at: Online here.
- Data: MARA LITe malaria prevalence data, distribution of the Anopheles gambiae, entomological inoculation rates, related climate data and malaria distribution maps and estimated populations at risk.
- Geographical coverage: Entire Africa – low level
- Time span: Mostly recent data
- Available at: Online at http://www.mara-database.org//login.html.
- Often it is possible to download the data and to view the data visualized on maps.
- Data: % of population at risk of malaria.
- Geographical coverage: Global – by country.
- Time span: 1960 – 2000 (observations every 5 years – including interpolations)
- Available at: Online here.
- Data: Incidence of malaria cases
- Geographical coverage: Global – by country.
- Time span: 1962-1997 – annual data.
- Available at: Online available at the website of Marta Reynal-Querol.
Other sources: Up-to-date information on the current state of malaria is published by the Roll Back Malaria Partnership – a partnership between WHO, UNICEF, UNDP and the World Bank.