The idea for this document is to give an overview of the metrics that are used to monitor the educational structure of populations especially in international comparisons. As the focus is on international comparisons I have made sure to list all the metrics and datasets that are included in the World Bank’s extensive EdStats data catalogue. With all the many measures on attainment and enrollment, in gross and net rates, ISCED levels, etc. etc. it can be difficult to understand what education data actually refers to. I hope this document is useful as a reference for some.
All the definitions of education metrics below are based on the helpful glossary of the UNESCO and the definitions include a direct link to the definition in that glossary with more details.
General
A general difficulty in educational data is to find a good measure to express the share of children that are taken into, enrolled, or attending educational institutions. The difficulty here is that several options for the considered age-bracket of children are possible as both the numerator and the denominator of the ratio – each possibility comes with difficulties and advantages. The main difference here is to distinguish between the gross and the net rate:
- Gross rates take into account all children at a given level of education regardless of their age and relate these to the population of the age group which officially corresponds to that level of education.
- The advantage is that the numerator includes all children at the particular level of education. The downside is that there cannot be a corresponding denominator. One option would be to express it relative to the entire population (which is sometimes done for tertiary education), but an often more informative – albeit not perfect option – is to express it relative to the population in the official age-bracket for that level of education. For this reason gross rates can exceed 100%.
- Net rates only take into account those children who are in the official age group for a given level of education in both the numerator and denominator.
- The advantage of net rates is that children within the same age bracket are compared and it is therefore not possible that the net rate exceeds 100%. The disadvantage is that not all children in a particular level of education are considered in net rates – those that are older or younger than the official age group are not considered in this measure.
Here is a scatterplot of the gross vs the net enrollment rate in primary education.
Intake
The intake of students into the educational system can be measured as the absolute number of students (for example by a measure such as “New entrants to grade 1 in primary (in absolute numbers)”). However to compare intake across countries and over time intake rates are more informative. Several intake rates are commonly used:
The net intake ratio to grade 1 of primary education = total number of new entrants in Grade 1 of primary education who are of the official primary school-entrance age / the population of the same age.
The gross intake ratio to grade 1 of primary education = total number of new entrants in Grade 1 of primary education, regardless of their age / the population at the official primary school entrance age.
The expected gross intake ratio to the last grade of primary education = total number of new entrants to the first grade of primary in a given year, regardless of age, who are expected to reach the last grade of primary education, regardless of repetition / the population at the official entrance age to primary education in the same year.
The adjusted net intake rate to grade 1 of primary education = total number of students in the official primary school entrance age who are enrolled in primary education, regardless of the year of entrance, grade or repetition / the population of the same age.
Enrollment
Enrollment figures, by level of education, are published in absolute numbers, but for comparisons between countries and over time enrollment rates are again more commonly used.
The difference between the various enrollment rates listed above are which age groups are measured in the numerator and denominator of the ratio. There are are additional measures that specifically look at the enrollment of over-age and under-age children such as the: “over-age enrollment ratio in primary education” or the “percentage of students enrolled in primary education who are over-age” (and the same metrics are published for “under-age” children).
Enrollment rates – also “enrollment ratios” – are available not only by level of education (primary, secondary, tertiary), but also be grade (grade 1 of primary, grade 2 of primary, etc.). They are often disaggregated by sex and socioeconomic background of the parents.
The net enrollment rate = students enrolled who are of the official age group for a given level of education / the population for the same age group.
The gross enrollment rate = number of students enrolled in a given level of education (regardless of their age) / the population of the age group which officially corresponds to the given level of education.
- Gross enrollment rate definition of the UNESCO.
- Since the numerator and denominator are referring to the population in different age groups it is possible that the gross enrollment rate exceeds 100%.
The adjusted net enrollment rate = number of students of the official primary school age group who are enrolled at primary or secondary education / the population of the official primary school age group.
The total net enrollment rate = number of students in the official school age range for the given level of education who are enrolled in any level of education / the population of the same age group.
- Total net enrollment rate definition of the UNESCO.
- The total net enrollment rate in primary education was one of the metrics used in the assessment of the Millennium Development Goals.
Attendance
Attendance rates are available by level of education (primary, secondary, tertiary or more levels of detail), by sex, rural-vs-urban location, and parental socioeconomic background.
The net attendance rate = total number of students in the theoretical age group for a given level of education attending that level at any time during the reference academic year / total population in that age group.
The adjusted net attendance rate = total number of students of the official primary school age group who attended primary or secondary education at any time during the reference academic year / total number of students in the official primary school age
The total net attendance rate = total number of students in the official school age range for the given level of education who are attending school at any level of education / population of the same age group
Out-of-school
Data on the number of out-of-school children (primary school age) and out-of-school adolescents (secondary school age) are published. For comparisons drop-out rates are often more informative.
The data on out-of-school children (of primary school age) and of adolescents (of secondary school age) is also broken down by “typology” of out-of-school children to differentiate between those who never attended school, those who dropped out, and those who are currently out of school, but are expected to enter the education system later than they should (“late entry”).
Drop-out
The drop-out-rate (by grade) is the share of pupils from a cohort enrolled in a given grade at a given school year who are no longer enrolled in the following school year.
- It is the share of children who are neither promoted to the next grade nor have to repeat the same grade again and it is therefore calculated as follows: drop-out-rate = 100% – (promotion rate + repetition rate)
- Drop-out-rates are published for different levels of education as cumulative drop-out-rates and also for specific grades within a particular level of education.
- Drop-out-rate by grade definition by the UNESCO.
Promotion
Promotion refers to the progression from one grade to the next while transition refers to the promotion from one level of education to the next (primary to secondary or secondary to tertiary).
The promotion rate (by grade) = number of new enrollment in a given grade in the following school year / number of students from the same cohort enrolled in the preceding grade in the previous school year
- The promotion rate measures the share of students from a cohort enrolled in a given grade at a given school year who study in the next grade in the following school year.
- The promotion rate by grade definition by the UNESCO.
The effective promotion rate (by grade) = number of new entrants to the following grade for the following year / number of students enrolled in the previous grade in the given year without the number of repeaters at that previous grade in that following year.
Transition
Transition rates are published for transitions between different levels of education (primary to secondary, secondary to tertiary).
The transition rate = number of students admitted to the first grade of the next higher level of education in a given year / number of students enrolled in the final grade of the lower level of education in the previous year.
The effective transition rate = number of new entrants to the first grade of the higher level of education in the following year / students enrolled in the last grade of the given level of education in the given year who do not repeat that grade the following year
Survival
Survival rates are published for example as the ‘survival rate to the last grade of primary education’ or as the ‘survival rate to grade 4 of primary education’.
The survival rate (to a particular grade at a specific level of education) = total number of students belonging to a school-cohort who reached each successive grade of the specified level of education / the number of students in the school-cohort (i.e. those originally enrolled in the first grade of the specified level of education)
Repeating
A repeater is a student who is enrolled in the same grade for more than one year. Data on repeaters is also available in absolute numbers , broken down by sex, and by specific grade in the education system (grade 1 in primary education, grade 2 in primary education, etc.).
The repetition rate (by grade) = number of repeaters in a given grade in the following school year / the number of pupils from the same cohort enrolled in the same grade in the previous school year
- The repetition by grade definition of the UNESCO.
- Also calculated is the percentage of repeaters at a specific level of education. For example the percentage of repeaters at primary school level is the total number of students in primary school enrolled in the same grade as in the previous year, expressed as a percentage of all students enrolled in primary school.
School life expectancy
The school life expectancy (SLE) is the number of years a person of school entrance age can expect to spend at a specific level of education (such as primary, secondary, and tertiary).
The World Bank explains: “For a child of a certain age a, the school life expectancy is calculated as the sum of the age specific enrolment rates for the levels of education specified. The part of the enrolment that is not distributed by age is divided by the school-age population for the level of education they are enrolled in, and multiplied by the duration of that level of education. The result is then added to the sum of the age-specific enrolment rates.”
Regarding the interpretation the World Bank explains: “A relatively high SLE indicates greater probability for children to spend more years in education and higher overall retention within the education system. It must be noted that the expected number of years does not necessarily coincide with the expected number of grades of education completed, because of repetition. Since school life expectancy is an average based on participation in different levels of education, the expected number of years of schooling may be pulled down by the magnitude of children who never go to school. Those children who are in school may benefit from many more years of education than the average.”
Completion
Completion rates are published by level of education (primary, secondary, tertiary).
There are slightly different definitions of the completion rate used by different organizations. The UNESCO defines the completion rate as follows: “Percentage of a cohort of children or young people aged 3-5 years above the intended age for the last grade of each level of education who have completed that grade. The intended age for the last grade of each level of education is the age at which pupils would enter the grade if they had started school at the official primary entrance age, had studied full-time and had progressed without repeating or skipping a grade.”
Other organizations however publish completion rates regardless of the children’s age relative to the intended age.
The completion rate can exceed 100% due to repeaters and over- and under-aged children who enter the specific level of school late or early.
The cohort completion rate for a specific level of education = survival rate to the last grade of primary education * (number of graduates from the specific level of education in a given year / difference between enrolment in the last grade in the same year and repeaters in the last grade in the following year)
Graduation
The gross graduation ratio = number of graduates regardless of age in a given level or programme / population at the theoretical graduation age for that level or programme
In contrast to the previous metrics, educational attainment metrics are used to measure the level of education across the population older than the population that is still in the educational system.
Attainment is often further broken down by sex, age group, and also nationality, race, socioeconomic status, and also socioeconomic background of the parents.
Mean years of schooling are the average number of completed years of education of a country’s population. Grades that were repeated are mostly excluded.
The measure commonly refers to the population older than 15 or 25 years. The younger population is excluded because a large fraction of these is often still attending educational institutions at that age.
Mean years of schooling is often additionally disaggregated by mean years of schooling by type of schooling (primary, secondary, and tertiary).
Data on mean years of schooling is published in several sources:
- Clio-Infra publishes estimates for countries around the world from the year 1860 to 2010.
- IIASA-WC publishes projections until the year 2100. [available via the World Bank’s EdStats.]
- Barro & Lee publish data from . [available via the World Bank’s EdStats.]
- UNESCO Institute for Statistics (“UIS”). [available via the World Bank’s EdStats.]
A second way to measure the educational attainment is to focus on the highest level of education a particular individual attended. It is either expressed as the the absolute number or the share of the population with a particular level of education.
Data sources: Available from IIASA-WC, Barrro & Lee, and UNESCO Institute for Statistics (“UIS”).
The broad categories of primary, secondary, and tertiary education apply in most countries, but the specifics are very different from country to country. Because educational systems differ substantially between countries it is difficult to compare the level of educational attainment between different countries. This is why it became necessary to harmonize the levels of education in a standardized system that can be applied to every country. To make education statistics comparable across countries, the UNESCO designed the International Standard Classification of Education (ISCED) shown in the table below.
The UNESCO published the ISCED classification information in this document. The ISCED mappings for each country are published here.
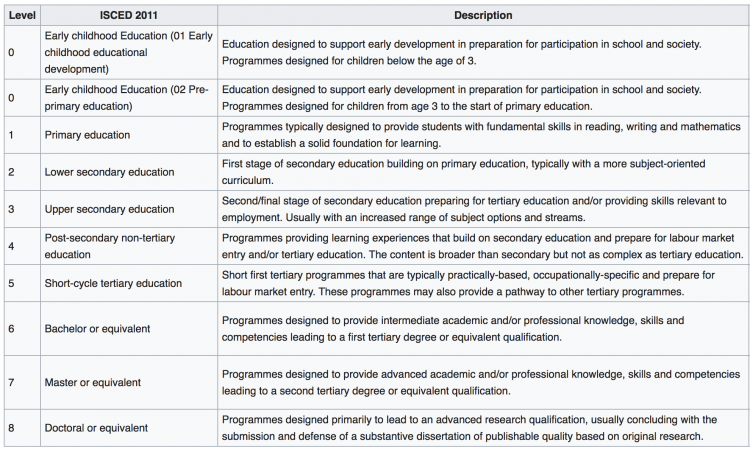
The 8 levels of the International Standard Classification of Education (ISCED)1
Measures specific to early childhood education
New entrants to Grade 1 of primary education with early childhood education experience.
Measures specific to secondary education
The UNESCO Institute for Statistics differentiates between vocational and general education on the secondary level of education.
Vocational education is described as follow: “Vocational education is designed for learners to acquire the knowledge, skills and competencies specific to a particular occupation or trade or class of occupations or trades. Vocational education may have work-based components (e.g. apprenticeships). Successful completion of such programmes leads to labour-market relevant vocational qualifications acknowledged as occupationally-oriented by the relevant national authorities and/or the labour market.”
General education at the secondary school level is described as: “General education is designed to develop learners’ general knowledge, skills and competencies and literacy and numeracy skills, often to prepare students for more advanced educational programmes at the same or higher ISCED levels and to lay the foundation for lifelong learning. General educational programmes are typically school- or college-based. General education includes educational programmes that are designed to prepare students for entry into vocational education, but that do not prepare for employment in a particular occupation or trade or class of occupations or trades, nor lead directly to a labour market relevant qualification.”
Level 4 on the ISCED classification is referred to as “post-secondary non-tertiary education”. According to the UNESCO classification, education at this level “provides learning experiences building on secondary education, preparing for labour market entry as well as tertiary education”, but the content of such a program “is not sufficiently complex to be regarded as tertiary education, although it is clearly post-secondary”.
Measures specific to tertiary education
Because the age group of students in tertiary education varies more than for primary or secondary education it is common to publish the ratio of students enrolled in tertiary education relative to the entire population, for example the ratio between students in tertiary education per 100,000 inhabitants.
Instead of statistics on particular grades it is common in international educational statistics on tertiary education to refer to the ISCED levels 5, 6, and 7.
Because of the specialization of education at this level it is common to publish statistics on particular specializations. These are standardized by the UNESCO across countries in the International Standard Classification of Education (ISCED) fields of tertiary education. The following table shows this classification which comprises 25 narrow fields of education which fall into 9 broader groups.
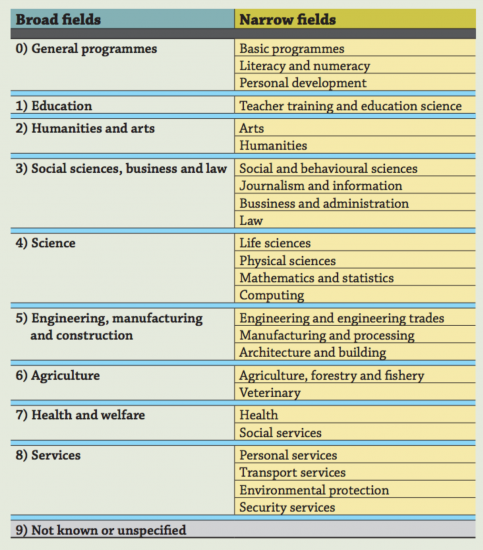
The classification of fields of tertiary education according to the UNESCO’s International Standard Classification of Education (ISCED)2
All data discussed is concerned with inputs in the education system – ultimately it is about how much time students spend in educational institutions. For educational inputs we have pretty complete data coverage, both, in time and space. But the goal of going to school is of course to learn and on this aspect – the learning outcomes of education – data is much sparser. Efforts to measure these outcomes are geographically more restricted (often only OECD countries are included) and even less is known about how the performance of students with respect to these outcomes has changed over time. A third limitation is that measures are sometimes not comparable between countries.
Most often these assessment are measuring learning outcomes of one or several of the following three dimensions:
- Reading and language proficiency
- Mathematics and numeracy proficiency
- Scientific knowledge and understanding
Scores are published broken down by sex and sometimes by socioeconomic background.
The assessments differ in respect to how children are selected. While some assessments select children by their age, there are other assessments which select children by the school grade the child attends. The aim of these studies is to test a representative random sample of the intended population.
The most widely available metric on the outcomes of education is literacy. The data on this very basic educational skill is briefly discussed below and in much more detail in our entry on the topic.
A detailed discussion of the assessment of learning outcomes is provided by Daniel Koretz in his book Measuring Up: What Educational Testing Really Tells Us.3
The PISA assessment, which is coordinated by the OECD, is the most well known international assessment of learning outcomes. The first PISA study was carried out in 1997 and since then it was repeated every three years.
The study is not select students by grade, but by age and only tests 15-year-olds, whatever their school level. In a two-hour assessment the competencies in reading, mathematics and science of these students are assessed. It is a very substantial undertaking and until 2017 “half a million students representing 28 million 15-year-olds in 72 countries and economies have participated in PISA” according to the OECD. The coverage of PISA can be seen in this map on the results in the reading dimension, it obviously includes the richer OECD countries and unfortunately only few poorer countries. Poorer countries are also not tested regularly and were only participating in one round only and additionally it can be the case that for poorer countries not students from the entire country were selected, but instead only from particular regions.
PISA, as well as TIMSS, are standardizing their results so that the average score of students from OECD countries is 500 and the student standard deviation is 100. Assuming a normal distribution of measurement outcomes this means 68% of OECD students are reaching scores in the range between 400 and 600.
While TIMSS focuses on content that is covered in the school curriculum PISA aims to “assesses the application of skills to real-life problems” and “emphasizes the importance of the context in which students should be able to use their skills (schools, home and society)”.
PISA tests the students in three different dimensions, which they define as follows:4
- “Science literacy is defined as the ability to engage with science-related issues, and with the ideas of science, as a reflective citizen. A scientifically literate person is willing to engage in reasoned discourse about science and technology, which requires the competencies to explain phenomena scientifically, evaluate and design scientific enquiry, and interpret data and evidence scientifically.
- Reading literacy is defined as students’ ability to understand, use, reflect on and engage with written texts in order to achieve one’s goals, develop one’s knowledge and potential, and participate in society.
- Mathematical literacy is defined as students’ capacity to formulate, employ and interpret mathematics in a variety of contexts. It includes reasoning mathematically and using mathematical concepts, procedures, facts and tools to describe, explain and predict phenomena. It assists individuals in recognising the role that mathematics plays in the world and to make the well-founded judgements and decisions needed by constructive, engaged and reflective citizens.”
Cross country comparability of the PISA results
When the PISA study includes non-OECD countries it is often the case that students are not selected from the entire country, but instead only from selected regions within that country. Results reported for China – and labelled as such by the OECD – in fact are only based on four Chinese provinces: Beijing, Shanghai, Jiangsu and Guangdong. These regions are not representative of China as a whole and there is every reason to expect that students from these provinces have access to better education than the average Chinese 15-year-olds. The four regions are among the very richest regions of China and incomes are up to twice that of the national Chines average.
Similarly when PISA reported on “India” in 2009 the assessments were made in two states of India only (Himachal Pradesh and Tamil Nadu).
As the name says, TIMSS is an assessment of the mathematics and science knowledge of students. As the closely linked PIRLS it is carried out by the International Association for the Evaluation of Educational Achievement (IEA).
While PISA selects the assessed students by age and focusses on 15-year olds, TIMMS selects students by the grade they attend and tests students in Grades 4, 8, and in their final year.
TIMSS started slightly earlier than PISA. The first TIMSS was conducted in 1995 and covered 45 national educational systems. Later rounds included more countries – the 2011 round included 77 countries/area. The coverage of TIMSS is similar to PISA and includes mostly richer countries which are part of the OECD and only few poorer countries. The coverage of TIMSS can be seen in this map on the results in the science dimension.
Precursors to TIMSS were already conducted from 1964 onwards.
The PIRLS is the other major study carried out by the IEA. Here the objective is to assess primary school students in reading proficiency. PIRLS only started in 2001.
LLECE is an assessment carried out only in Latin American countries. This map shows the mathematics score of 6th graders. More information on LLECE is published by the UNESCO here.
PASEC, which in the original French refers to Programme d’ Analyse des Systèmes Educatifs, has assessed educational outcomes in 13 countries in Francophone West Africa. Here is a map of outcomes in the dimension of the French language.
EGRA and EGMA are simple, low-cost assessments of literacy and numeracy.
APRESt is a large-scale randomized evaluation in the Indian state of Andra Pradesh that has been carried out since 2004.
ASER is a report that is based on a survey of more than 500,000 children in rural areas across India. It is not a school-based, but instead an in-home assessment of the reading and mathematical skills of children between 3 and 16. The first ASER was carried out in 2005.
UWEZO is an adaptation of ASER carried out in three east African countries (Tanzania, Uganda, and Kenya). It has been done since 2009 and is carried out annually.
An assessment carried out by education ministries from fifteen southern and eastern African countries. The study assesses students in grade 6 in the domains of reading and mathematics. The first study was carried out in 1995. The studies’ website is: www.sacmeq.org
Studies that combine educational outcome measures
With a multitude on different assessments of learning outcomes which focus on different geographical areas and different skills it is an obvious idea to try to combine these measures into a common system to get a more comprehensive perspective on educational outcomes across the world. Several researchers have attempted to do this.
The researchers Altinok, Diebolt & Demeulemeester published their dataset and their accompanying paper under the title A new international database on education quality: 1965–2010.5
The authors write that they “merge all existing regional and international student achievement tests by using a specific methodology”. The resulting dataset includes indicators of the quality of student achievement for 103 countries/areas in primary education and 111 countries/areas in secondary education between 1965 and 2010.
The education economists Eric Hanushek and Ludger Wößmann are combining the results from educational achievement tests to investigate the question whether the quality of education has a causal influence on the growth of the economy.6
The database the authors published – and which is available on the authors’ websites – includes measure for 77 countries. This map shows their main test score.
They extend earlier efforts by Hanushek and Kimko (2000) published in the American Economic Review.7
Sandefur (2016) – Internationally Comparable Mathematics Scores for Fourteen African Countries. Available as a working paper via CGDev.
Literacy
Literacy is the learning outcome with the widest available data, both geographically and over time.
Literacy and illiteracy rates and absolute number of people for many countries are available by age group and by sex. For many countries literacy data is available for the last decades and for some countries data is also available for the last several centuries.
In the Our World in Data entry on literacy you find more information and a presentation of the most important data.
Datasets that publish estimates of mean years of schooling often also provide estimates of the inequality of years of schooling in a population. The most common metric used to capture this inequality is the Gini index.
Also surveys – such as the Demographic and Health Survey (DHS) and the Multiple Indicator Cluster Survey (MICS) – publish Gini rates of average years of schooling.
To measure gender inequality it is common practice to report ratios of metrics for males and females, such as the ratio between average years of schooling of women and men. The UNESCO often refers to this ratio as the “Gender Parity Index”.
Several measures on teachers are available across countries – many of which you find visualized in our entry on teachers and professors:
Absolute number of teachers: The UNESCO Institute for Statistics publishes the absolute number of teachers by sex and level of education (primary, secondary, and tertiary)
Share of female teachers: These share, broken down by level of education, are by the UNESCO Institute for Statistics.
Share of teachers who are trained: Data on the share of teachers who have received the minimum organized teacher training (pre-service or in-service) required for teaching at a given level of education in a particular country is also published by the UNESCO Institute for Statistics. This data is available is also available by sex and the ratio between the two measures is published as the gender parity index (GPI).
Pupil-to-teacher ratio: These ratios, broken down by level of education, are also published by the UNESCO Institute for Statistics.
Also published are the ratios of the number of ‘teacher training graduates’ to teachers who are currently working.8
Annual teacher salaries in US-$: Data on salaries of teachers is published by level of education and additionally by experience of the teacher by the OECD. The OECD breaks this down by starting salary, 10 years of experience, 15 years of experience, and top of scale salary.
Salaries are reported as gross salaries – the total sum paid by the employer. Income taxes are not deducted in these reported salaries, but the employer’s contribution to social security and pension is deducted. The OECD adds that “teachers’ salaries are one component of teachers’ total compensation. Other benefits, such as regional allowances for teaching in remote areas, family allowances, reduced rates on public transport and tax allowances on the purchase of cultural materials, may also form part of teachers’ total remuneration.”
Additionally the OECD differentiates between statutory salaries – “the scheduled salaries according to official pay scales” – and actual salaries – “the average annual salary earned by a full-time teacher”.
As an example, here is a map of salary of primary teachers.
All staff compensation as share of total expenditure in public institutions: This measure is published by the UNESCO Institute of Statistics and is available for more than just the OECD countries. It includes the compensation of all staff (teacher and non-teachers) and expresses this as the share of direct expenditure in public educational institutions (instructional and non-instructional). Staff compensation includes salaries, contributions by employers for staff retirement programmes, and other allowances and benefits.
There is some data available on the infrastructure in schools. In the World Bank’s EdStats dataset the following information is available in the regional Africa Dataset only:
- Data is available for the share of schools with and without access to electricity, toilets (broken down by single-sex and mixed-sex toilets), and access to potable water.
- There is also some data on the average number of pupils per mathematics (and reading) textbook in primary education.
- Data on average class sizes is also available.
Data is available on the expenditure on the educational systems in several dimensions. For visualizations of some of the empirical data and research see our entry on financing of education.
Data is available on the structure of the educational systems in several dimensions:
- The UNESCO Institute for Statistics publishes data on the “Duration of compulsory education“, the “Official entrance age to compulsory education”, and also more detailed information such as official entrance age and theoretical duration of the different levels of education – such as pre-primary education, primary education, and (lower and upper) secondary educational level.
- The UNESCO also publishes the “theoretical duration” – measured in number of grades (in years) – by level of education.
- Enrollment in private and public institutions is available. Here is a map for primary education as an example.
At the tertiary education level data is available on the international mobility of students:
- The inbound mobility rate is the ratio between the number of students from abroad studying in a given country and the the total number of enrolled students in that country. It is also available by sex and level of education.
- For outgoing students of a particular country the outbound mobility rate is published.
Maps of both measures can be found in our entry on tertiary education.
SABER is an effort by the World Bank to produce comparative data on education system policies and institutions. Published are a range of policy metrics on management systems, teachers, student assessments, school health and school feeding, school autonomy and accountability, school finance, workforce development, and early childhood development. The website is here.
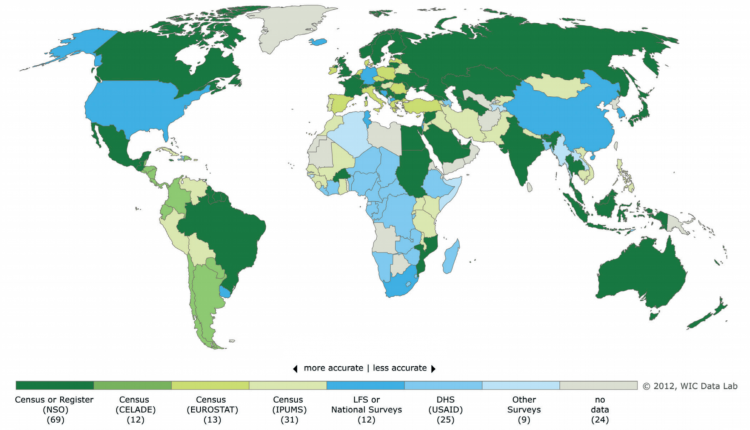
Census and registers published by the national statistical offices are the most reliable source for educational attainment. But not all countries have built the capabilities to produce such statistics. Which data sources do we have available when census and register data is not available?
The world map below is published by the researchers of IIASA who assembled a global dataset of educational attainment for their research and searched for the most accurate data source for each country. The original datasources, which were seen as the most accurate in each country, are shown in the world map below.
We see that the IIASA researchers rank censuses as the most reliable data sources and in the absence of these they rely on survey data, preferably on labor force surveys or national surveys and if these are not available either on the DHS (for many African countries) or other in rare cases other surveys. The authors write that for “the remaining 24—mostly small—countries, assumptions on the education structure had to be made by analogy.”