Notice: This is only a preliminary collection of relevant material
The data and research currently presented here is a preliminary collection or relevant material. We will further develop our work on this topic in the future (to cover it in the same detail as for example our entry on World Population Growth).
If you have expertise in this area and would like to contribute, apply here to join us as a researcher.
All our charts on Military Spending
These visualizations provide an overview of military expenditure in the world today.
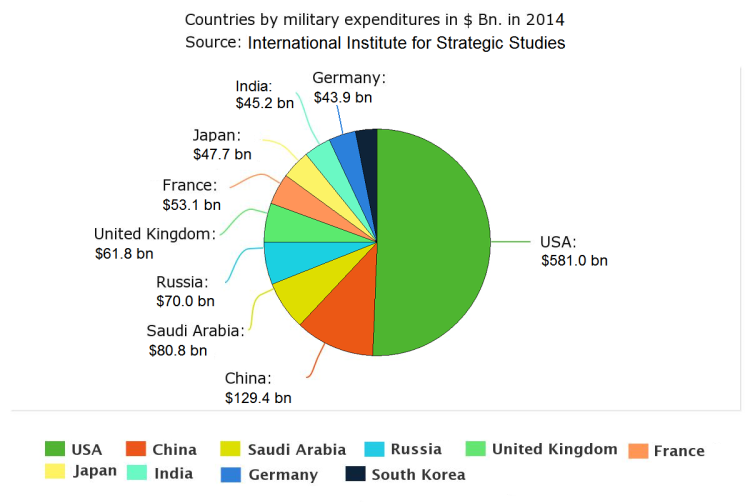
The pie chart shows that world military expenditure in 2014 was dominated by the United States. The US spent 581 Billion US-$ – more than the following nine countries combined.
The second biggest spender is China. On places 3 to 5 follow Saudi Arabia, Russia and the United Kingdom.
Top ten military expenditures in US$ Bn., 2014 – International Institute for Strategic Studies1
The map displays military expenditure as a percentage of GDP. In 2017, both Saudi Arabia and Oman spent more than 10% of their GDP on their military.
Another country that ranks highly, but for which data is not available in this dataset is North Korea. It is estimated that North Korea spent roughly one-third of their national income on defence.2
Military spending is intimately linked to war. In times of peace, few countries spend more than 5% of GDP on their military, choosing instead to maintain their capabilities and make use of their armies in other ways.

How much do violent conflicts displace economic resources in times of war? Do most countries devote a large share of resources to maintain their armies even when they are not immersed in a critical conflict? How are military capabilities changing in the 21st century?
Here I answer these questions using data from several sources, including a brand new dataset we’ve constructed at Our World in Data. I’ve structured the analysis around four ‘key facts’.
One way to gauge the extent to which violent conflict affects the allocation of resources in an economy is to look at how military spending, as a share of national output, changes across countries and time.
This is shown in the first chart.
The estimates in this chart come from a brand new dataset that we constructed from several underlying sources. (In the tab labelled ‘Sources’, underneath the interactive data visualization, you can find a detailed description of how we constructed this dataset.)
The two large spikes, marking the First and Second World Wars, are clearly the main feature here. In Japan, military spending in 1944 was 99% of GDP. That means military spending was almost as large as the value of the entire national production in that year.
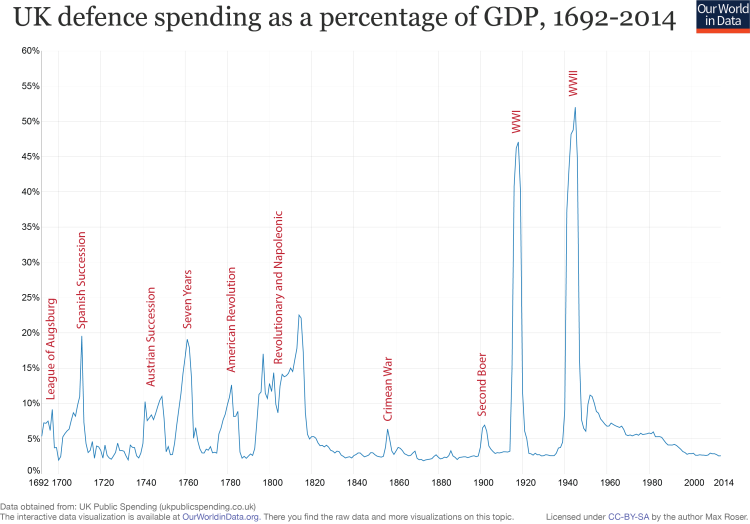
If we look beyond these two spikes, we can see that there are also clear peaks for other major conflicts. Take now the UK as an example: The chart shows peaks for the Crimean War (1853 – 1856) and the Second Boer War (1899 – 1902).
You can add and remove countries by using the option labeled ‘ Add country ’. If you add Iraq, for instance, you see that there is a spike at the peak of the Gulf War: In 1991, military spending in Iraq was higher than the entire annual output of the country.
The fact that wars affect the allocation of resources can also be measured via changes in the number of people actively involved in the military. As the second chart shows, estimates suggest that the British armed forces amounted to about 10% of the entire British population at the peak of the First and Second World Wars.
In more recent conflicts we observe again large spikes. In Iraq, it is estimated that the size of the armed forces in 1991 was almost 8% of the population, or the equivalent of about 35% of the entire labor force of the country.


How much do countries spend on the military in the absence of major violent conflict? The chart shown here focuses on Sweden, Brazil and Switzerland. As we can see, despite broad reductions in recent years, all these countries have kept levels of military spending close 1% of GDP. In all these countries the level today is similar to what it was at the turn of the 20th century.
This illustrates a more general point: Most countries devote resources to their military even in the absence of conflict.
Indeed, if you switch to the ‘map view’ in this chart, you will see that vast majority of countries in the world spend at least 1% of GDP in their military. (In the map view there is a slider that allows you to track changes over time.)

Is military spending going up or down?
This chart shows military spending as a share of GDP for several countries and regions, as well as for the world as a whole. We see that since the end of the Second World War, there is a broad negative trend in military budget shares across world regions.
While the world spent six percent of GDP on defense in 1960, it spends just over two percent today. (For context, you can check this other interactive chart where we show that total government spending as a share of GDP has actually grown in most countries over the same period.)
However, a key point to keep in mind here is that since GDP has been growing around the world in recent decades, the decline in defence budget shares across the world does not imply lower military spending in absolute terms. In fact, total global military expenditure, in inflation-adjusted US dollars, has gone up threefold in recent decades. This, in turn, is partly the result of countries becoming larger in terms of population. In inflation-adjusted US dollars per head, global military spending has fluctuated around a fairly constant level since 1960.

For the final point I want to make, let’s turn to recent data on the size of military forces, in terms of people. Are armies larger or smaller today than a couple of decades ago?
The last chart plots armed forces personnel across countries and world regions. Again there is a broad negative trend, both across world regions and across countries within these regions. And these trends also hold if we look at armed forces as share of labor force.
So, after the Second World War armies have been getting smaller relative to the civilian population. In terms of absolute size, however, the total number of people in the global armed forces has stayed relatively constant in the last two decades.

The extent to which war influences military spending is demonstrated in this visualisation. The UK’s military spending as a percentage of GDP in peacetime fluctuates around 2.5%, in times of war however, military spending rises dramatically. At the height of the Second World War, the UK was spending around 53% of its GDP on its military. Such a dramatic rise is consistent with the existential danger faced by the UK during the Second World War.
- Data: National Material Capabilities (v4.0); military expenditure, personnel
- Geographical coverage: Global
- Time span: 1816-2007
- Available at: http://cow.dss.ucdavis.edu/data-sets/national-material-capabilities
- Data: SIPRI Military Expenditure Database; “The SIPRI Military Expenditure Database contains consistent time series on the military spending of 171 countries since 1988, and of NATO member states from 1949 or from when they joined NATO. “
- Geographical coverage: Global by country
- Time span: 1949-2014
- Available at: http://www.sipri.org/research/armaments/milex/milex_database
- Data: National accounts data
- Geographical coverage: Global by country
- Time span: Long time series with annual observations – from 19th century up to today (2010)
- Available at: Online here