Notice: This is only a preliminary collection of relevant material
The data and research currently presented here is a preliminary collection or relevant material. We will further develop our work on this topic in the future (to cover it in the same detail as for example our entry on World Population Growth).
If you have expertise in this area and would like to contribute, apply here to join us as a researcher.
This article focusses on future education projections. Much of the focus here is on data produced by the International Institute of Advanced Systems Analysis (IIASA) based in Vienna. The research produced by IIASA is widely used by policy makers concerned with future levels of education and population trends. The methodology used is briefly discussed in this article, however interested readers should study the methodology carefully before making use of the data presented here.
All our charts on Projections of Future Education
The International Institute for Applied Systems Analysis (IIASA) is an interdisciplinary, highly-respected research institution near Vienna, Austria. The IIASA population projections are the most cited alternative to the UN work.
An interesting feature of the IIASA population projections is that they take into account the education of the population. As shown in the data-entry on fertility there is a strong link between education and fertility – more educated women have fewer children. This link is taken into account in the model of the IIASA researchers and contributes to their projection of a smaller total world population than projected by the UN (see the data-entry on world population growth for the comparison).
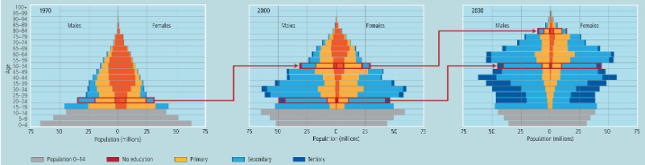
The breakdown by education level is especially interesting: It shows that our world will be inhabited by more and more educated people. The projection shows that the number of people with no education will decrease continuously and that by the end of this century virtually all people in the world will have received some level of education.
In the visualization you also see that in 1970 there were only around 700 million people in the world that had secondary or post-secondary education. By the end of this century the number of people with secondary or post-secondary education will have increased 10-fold and will reach 7 billion people (a similar number as the world population today)!

The best available data suggests that we should see rates of education increasing as the world develops. By 2050, only five countries are predicted to have a rate of no education above 20%: these are Burkina Faso, Ethiopia, Guinea, Mali and Niger. There is also expected to be a large increase in the numbers of people obtaining degrees, while more people complete secondary school.

Projections of the education of the world Population, present to 2050 – HDR (2013)1
![Projections of the Education of the World Population until 2050 - HDR 2013 [based on Lutz and KC]](https://nightingale-owid.netlify.app/uploads/2013/07/Projections-of-the-Education-of-the-World-Population-until-2050-HDR-2013-based-on-Lutz-and-KC-645x319.png)
Developing economies: Brazil and Russia
Compare the projections for Brazil and Russia. While both are considered developing economies, Russia is far more educated than Brazil at present. What is more, while the population of Brazil is projected to continue growing into the future, the population of Russia is predicted to decline. By 2050, almost every Russian is expected to have completed secondary school.
If you want to see the education and population projection for a different country just click ‘Change Country’.


![Population and Education Future in the Republic of Korea (1970-2050) - HDR 2013 [based on Lutz and KC]0](https://nightingale-owid.netlify.app/uploads/2013/07/Population-and-Education-Future-in-the-Republic-of-Korea-1970-2050-HDR-2013-based-on-Lutz-and-KC0.png)
The two giants: India and China
![Population and Education Future in India (1970-2050) - HDR 2013 [based on Lutz and KC]](https://nightingale-owid.netlify.app/uploads/2013/07/Population-and-Education-Future-in-India-1970-2050-HDR-2013-based-on-Lutz-and-KC.png)
![Demographic prospects for China and Ghana (2050) - HDR 2013 [based on Lutz and KC]](https://nightingale-owid.netlify.app/uploads/2013/07/Demographic-prospects-for-China-and-Ghana-2050-HDR-2013-based-on-Lutz-and-KC-645x245.png)
Back projections of education rely on cross sectional data of the highest level of educational attainment for different segments of the population. The data used is taken from the UN and is only for the year 2000; the educational attainment series is projected backwards from this single year. The year 2000 was chosen as the base year since it had the widest coverage of countries available at the time. Throughout the back projection, no other data on education is used.
Using the life expectancy and education-specific period life expectancy for each cohort, the different survival ratios are computed. This survival ratio is then used to go back one period (5 years) according to the formula:
where
The projections of future education depend on the assumptions made and the IIASA produces estimates for different scenarios. The ones presented in this article are for the Global Education Trend (GET) scenario, where global education trends persist into the future. The other scenario data can be downloaded from their website.5
The methodology used to project future education trends is more sophisticated than for the back projections and so is omitted from this article. The full methodology and datasets can be found here.
- Data: Educational by level of attainment, population projections
- Geographical coverage:
- Education: 120 countries
- Population: 190 countries
- Time span: 1970-2050
- Education: 1970-2050
- Population: 1970-2100
- Available at: