Summary
- Globally, 14.6% of land is designated as a protected area.
- 16% of global forests fall within a legally established protected area.
- 46% of important sites for terrestrial biodiversity were protected in 2017. That’s an increase from one-third of sites in 2000.
- 45% of important sites for mountain biodiversity were protected in 2017. That’s an increase from one-third of sites in 2000.
- 43% of important sites for freshwater biodiversity were protected in 2018. That’s an increase from 30% in 2000.
- Globally, 11.5% of marine territorial waters were protected in 2017.
- We have seen a significant rise in international cooperation on conservation in recent decades.
- Amongst the bad news on wildlife losses, conservation has saved tens of mammals and bird species from extinction.
- The fall in global whaling is another example of effective conservation efforts.
For millennia, humans have transformed the world’s landscape with the expansion of agricultural land, and more recently, the expansion of urban infrastructure. Half of the world’s habitable (ice- and desert-free land) is now used for agriculture. In the process, we’ve lost one-third of the planet’s forests and large areas of wild grasslands, peatlands and other environments.
This has come at a severe cost to biodiversity. Habitat loss has been, and continues to be, one of the biggest threats to wildlife. One way to protect habitats, ecosystems and vulnerable species is to set aside protected areas. These are designated areas where there are tighter regulations on agricultural or infrastructural expansion efforts and closer monitoring of human encroachment. The specific objectives and regulations can vary across protected areas: for example, what is permitted in a strict nature reserve might differ from a national park or protected landscape.1 The IUCN provides guidelines on assigning categories and governance types to different types of protected areas here.
Unfortunately protected areas are not perfect: some have been very effective in protecting habitats and endangered species. While others have been too poorly monitored to stop this. Nonetheless, when properly implemented, they can make a significant difference to conservation efforts.
In the sections below we take a look at the distribution of protected areas across the world.
Protected land area
In the map we see the share of land in each country that is designated as a protected area.
A terrestrial protected area is a completely or partially protected area of at least 1,000 hectares. They are that are designated by national authorities as scientific reserves with limited public access, national parks, natural monuments, nature reserves or wildlife sanctuaries, protected landscapes, and areas managed mainly for sustainable use.
The fact that a terrestrial area is only included if it measures at least 1,000 hectares is important: many protected areas such as national parks or wildlife reserves, particularly in lower-income countries, are smaller than this. This means they are not included in these statistics.
Globally, 14.6% of land area was designated as protected. By country, this can vary from less than 1% to around 50% of land.

Protected forest areas
Forests are home to many of the world’s most diverse ecosystems. But they’re also one of the most threatened. One-third of the world’s forests have been lost to human land use – most of it for agriculture. Today, most of the world’s deforestation occurs in the tropics. This is bad news for our wildlife, because tropical ecosystems are home to greatest density of unique species.
Protecting the world’s forest lies at the heart of preserving biodiversity.
The map here shows the share of forest area that is within legally established protected areas. Unfortunately, protected areas do not guarantee that forests are safe from deforestation and overexploitation. But they do increase the likelihood that they are better-managed.
Globally, 16% of forest fell within a legally established protected area in 2015.

Important sites for terrestrial biodiversity
There are areas and sites across the world that are particularly important for the preservation for biodiversity. This might be because they have a high-density of unique species, or because species in that area are highly threatened.
The IUCN therefore designates ‘important sites for biodiversity’. What qualifies as an ‘important biodiversity site’. It can be one of two qualifiers:
- Identified as an Important Bird & Biodiversity Area, that is, sites contributing significantly to the global persistence of biodiversity, identified using data on birds. More than 12,000 sites across the world have been designated through this criteria.
- Identification as a Alliance for Zero Extinction site, that is, sites holding effectively the entire population of at least one species assessed as Critically Endangered or Endangered on the IUCN Red List of Threatened Species.
Globally, 46% of important sites for terrestrial biodiversity were protected in 2017. That’s an increase from 2000 when only one-third of these sites were protected.

Important sites for mountain biodiversity
Just as sites of terrestrial biodiversity are designated based on species uniqueness and threats to endangered wildlife, this also applies to mountainous areas.
In the map we see the share of important sites for mountain biodiversity that are protected.
Globally, 45% of these sites were protected in 2017. That’s a significant increase from the one-third that were protected in 2000.

Freshwater species have experienced some of the most severe population declines in recent decades. Almost one-third of freshwater species are threatened with extinction.2 The Global Living Planet Index reports an average decline of 84% in studied freshwater species.
Protection of freshwater biodiversity is therefore a top priority for conservation.
In the map we see the share of important freshwater biodiversity sites that are designated as protected areas.
43% of important sites for freshwater biodiversity were protected in 2018. That’s an increase from 30% in 2000.

Around one-third of the world’s fish stocks are overexploited. Combined with the additional pressures of climate change, ocean acidification and water pollution, more than 3,000 fish species are threatened with extinction. Many more marine species, including corals and molluscs are also at risk.
Marine protected areas are designated areas where human activities in oceans, estuaries and shorelines are restricted to prevent overexploitation. This can take many forms, ranging from no-fishing zones to areas where particular types of fishing activities are banned or limited.
In the map we see the share of marine territorial waters – meaning waters close to shore – that are designated as protected areas. This does not include the open international seas, which are more difficult to manage collaboratively.
Globally, 11.5% of marine territorial waters were protected in 2017.

Most of the world’s environmental problems require international collaboration. Protecting the world’s biodiversity is no different – especially because it is so tightly interlinked with many other ecological pressures. Most of the world’s environmental challenges have knock-on effects on our wildlife: deforestation, climate change, desertification, wildlife trade, plastic pollution are all drivers of biodiversity loss.
This is why international collaboration on these issues is to vital for progress.
Thankfully, the willingness to cooperate globally on these issues has increased rapidly in recent decades, and continues to grow. In the chart we see the number of parties that have signed up to multilateral environmental agreements.
Cooperation has been increasing since the 1970s but accelerated for many agreements in the last 20 years.

It’s hard to find good news on the state of the world’s wildlife. Many predict that we’re heading for a sixth mass extinction; the Living Planet Index reports a 68% average decline in wildlife populations since 1970; and we continue to lose the tropical habitats that support our most diverse ecosystems. The United Nations Convention on Biological Diversity set 20 twenty targets – the Aichi Biodiversity Targets – to be achieved by 2020. The world missed all of them.3 We didn’t meet a single one.
Perhaps, then, the loss of biodiversity is unavoidable. Maybe there is nothing we can do to turn things around.
Thankfully there are signs of hope. As we will see, conservation action might have been insufficient to meet our Aichi targets, but it did make a difference. Tens of species were saved through these interventions. There’s other evidence that protected areas have retained bird diversity in tropical ecosystems. And each year there are a number of species that move away from the extinction zone on the IUCN Red List.
We need to make sure these stories of success are heard. Of course, we shouldn’t use them to mask the bad news. They definitely don’t make up for the large losses in wildlife we’re seeing around the world. In fact, the risk here is asymmetric: growth in one wildlife population does not offset a species getting pushed to extinction. A species lost to extinction is a species lost forever. We can’t make up for this loss by simply increasing the population of something else. But we can make sure two messages are communicated at the same time.
First, that we’re losing our biodiversity at a rapid rate. Second, that it’s possible to do something about it. If there was no hope of the second one being true, what would be the point of trying? If our actions really made no difference then why would governments support anymore conservation efforts? No, we need to be vocal about the positives as well as the negatives to make clear that progress is possible. And, importantly, understand what we did right so that we can do more of it.
In this article I want to take a look at some of these positive trends, and better understand how we achieved them.
For anyone interested in wildlife conservation, losing a species to extinction is a tragedy. Saving a species is surely one of life’s greatest successes.
Conservation efforts might have saved tens of beautiful species over the last few decades. The 12th Aichi Target was to ‘prevent extinctions of known threatened species’. We might have missed this, but efforts have not been completely in vain.
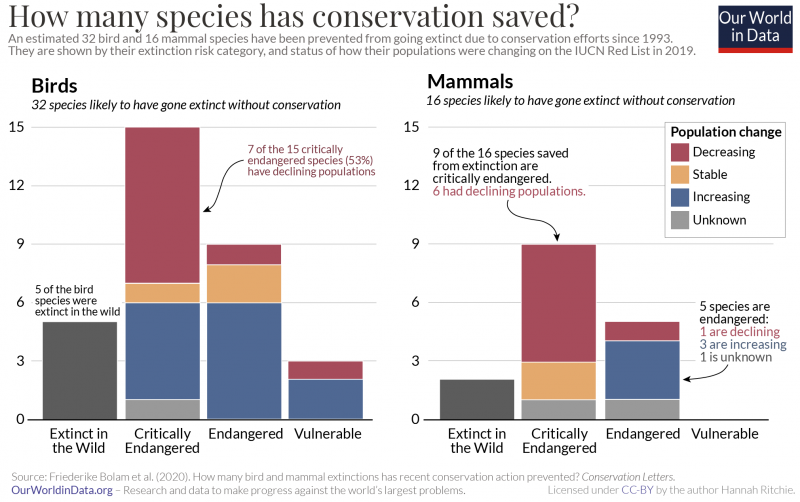
In a recent study published in Conservation Letters, researchers estimate that between 28 and 48 bird and mammal species would have gone extinct without the conservation efforts implemented when the Convention on Biological Diversity came into force in 1993.4 21 to 32 bird species, and 7 to 16 mammal species were pulled back from the brink of extinction. In the last decade alone (from 2010 to 2020), 9 to 18 bird, and 2 to 7 mammal extinctions were prevented. This has preserved hundreds of millions of years of evolutionary history. It prevented the loss of 120 million years of evolutionary history of birds, and 26 million years for mammals.
What this means is that extinction rates over the last two decades would have been at least three to four times faster without conservation efforts.
This does not mean that these species are out-of-danger. In fact, the populations of some of these species is still decreasing. We see this in the chart, which shows how the populations of these bird and mammal species that were expected to have gone extinct are changing. 16% of these bird species, and 13% of the mammal species have gone extinct in the wild, but conservation has allowed them to survive in captivity. Across the critically endangered, endangered and vulnerable categories, 53% of bird and 31% of mammal species have increasing or stable populations. This is positive, but makes clear that many of these species are still in decline. Conservation has only been able to slow these losses down.
This only looks at species on the brink of extinction. Many species in serious but less-threatened categories have been prevented from moving closer to extinction. Around 52 species of mammals, birds and amphibians move one category closer to extinction every year. Without conservation, this number would be 20% higher.5
There are more examples. Studies have shown that protected areas have had a positive impact on preserving bird species in tropical forests.6 These are some of the world’s most threatened ecosystems. And while the IUCN Red List usually makes for a depressing read, there are some success stories. This year the European Bison, Europe’s largest land mammals, was moved from ‘Vulnerable’ to ‘Near threatened’ (meaning it’s less threatened with extinction) thanks to continued conservation efforts. We will look at more European success stories later.
Friederike Bolam et al. (2021) looked at what conservation actions were key to saving the mammal and bird species deemed to be destined for extinction.7 For both birds and mammals, legal protection and the growth of protected areas was important. Protected areas are not perfect – there are countless examples of poorly managed areas where populations continue to shrink. We will look at how effective protected areas are in a follow-up article. But, on average, they do make a difference. Clearly these efforts were critical for species that had gone extinct in the wild. Other important factors were controlling the spread of invasive species into new environments; reintroducing old species into environments where they had been previously lost; and restoring natural habitats, such as wetlands and forests.
The European Bison might steal the headlines, but there are many good news stories across Europe. Many of the drivers of biodiversity loss – deforestation, overhunting, and habitat loss – are happening in the tropics today. But these same changes also happened across Europe and North America. Only, they happened earlier – centuries ago.
Europe is now trying to restore its lost wildlife and habitats through rewilding programmes. The Zoological Society of London, Birdlife International and European Bird Census Council published a report which details how these efforts are going.8 They looked at how the populations of 18 mammal and 19 of Europe’s iconic but endangered bird species had changed over the past 50 years.
Most had seen an overwhelming recovery. Most species saw an increase of more than 100%. Some saw more than 1000% growth. Brown bear populations more than doubled over these 50 years. Wolverine populations doubled in the 1990s alone. The Eurasian lynx increased by 500%. Reintroduction programmes of the Eurasian beaver saw populations increase by 14,000% – a doubling or tripling every decade.
What were the main drivers of this recovery?
Part of Europe’s success in restoring wildlife populations in recent decades can be attributed to the fact that their development and harvesting of resources came long ago. My European ancestors had already hunted many species to extinction; expanded agricultural land into existing forest; and built cities, roads and other infrastructure that fragments natural habitats. Only in our very recent past have European countries been able to reverse these trends: reforesting; raising livestock instead of hunting; and now reducing the amount of land we use for agriculture through improved productivity.
But there have also been a number of proactive interventions to restore populations. In the chart here we see the main drivers of recovery across European bird species. At the top of the list is habitat restoration – the re-establishment of wetlands, grasslands, forests and other national habitats. Reintroduction of species has also been key. But protecting existing habitats and species has been equally important. Legal site protections and bans on shooting have been the main recovery drivers of almost as many species.
After millennia of habitat loss and exploitation by humans, wildlife is coming back to Europe. Somewhat ironically, humans have played an important role in this.
While most biodiversity trends point towards a barren future for the planet’s wildlife, there are success stories to draw upon. These should not make us complacent, or deflect our attention from the seriousness of these losses. But I think it is important to highlight what we have achieved. Protecting the world’s wildlife is not impossible – we’ve just seen the counter-evidence to this. To commit to wider conservation efforts we need to shout more loudly about these wins. Otherwise policymakers will turn their backs on them and we will lose many beautiful species that we could and should have saved.

Weighing in at over 150 tonnes, Blue Whales are the largest animal to have lived on Earth. But their size hasn’t protected them from human exploitation. In fact, their size made them an incredibly valuable source of oil, meat and blubber. This fat gave us a rich fuel for energy and many other industrial uses.
Human hunting has resulted in a massive decline in global whale populations. Some have been pushed to the brink of extinction. But, as we will see, a combination of technological change, economic incentives and international policies have brought global whaling to very low levels. While some populations are still very small, we have been successful in preserving these beautiful animals.
Whaling is a practice that dates back to Medieval times; fortunately at low levels, meaning this early practice had little impact on whale populations.9
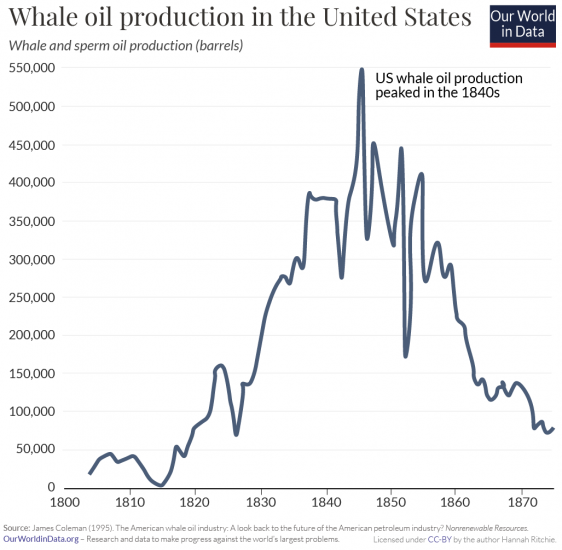
While global whaling was a feature of the 1900s, the peak of whaling in the United States was a century earlier. In the 18th and 19th centuries, whaling was a key industry in the US. Although the uses of whale oil later diversified, Americans mainly used it for lighting. Whale oil was used for the lighting of not only homes but also outdoor street lighting, lighthouses and miner’s headlamps – a range of uses that had a big impact on civilization during that period.10
As we see in the chart, US production of whale and sperm oil followed the classic inverted-U curve, peaking in the mid-19th century. At this point petroleum oil had been discovered, and kerosene – which was cheaper than whale oil – began to replace it in lighting. As whale hunting became increasingly unprofitable, production soon declined.11
While the United States dominated whaling during the 19th century, it didn’t really reach the global stage until the 20th century.
Towards the end of the 1800s, new technologies were being developed that could catch whales in much larger numbers. Rather than the classic sail- or oar-powered boats that the Americans had been using, the Norwegians developed mechanized, steam-powered vessels with cannons and harpoons. This made whaling much more efficient. Not only could we catch more whales, it also allowed us to catch species – like Blue and Fin Whales – that were too fast for our old technologies.
This marked the start of the ‘modern’ whaling era, from around 1890 onwards. It had a dramatic impact.
Whale populations fell by two-thirds in just over a century.12 In the chart we see the change in global whale numbers before this ‘modern whaling’ period versus the turn of the millennium. In 1890 there were around 2.56 million whales in our oceans. By 2001 there were only 880,000 left.
Not all species were impacted equally. Some of the largest – the Blue and Fin Whale in particular – were prime targets. This meant that the decline of total biomass of whales over this period was even greater. It fell by 84% – from 103 million tonnes to just 16 million tonnes of carbon.
We see this discrimination towards particular species in the chart. All species declined, but the extent was wildly different. The Minke Whale saw a fall of just 20%.13 The Blue Whale was almost plundered into extinction. Its populations fell from 340,000 to just 5,000. A reduction of 98.5%.14 The Fin Whale lost 85% of its numbers.15


The 20th century didn’t only bring technological innovations on how to track and hunt whales, it also brought advances on how we could use the oils, blubber, and bone that they provided. Both demand and supply rocketed.
Whale oils were initially used for lighting, but their market soon expanded. Sperm oil is special because it maintains its lubricating qualities at very high temperatures – this made it a vital ingredient for machinery, engines, guns and watches during the Industrial Revolution. Advancements in cosmetics and food chemistry meant that its by-products were soon used for soaps, textiles, and even margarine. Ambergris – a substance found in the intestine of sperm whales – was, and still is, used to make perfume. You will find it in the luxury perfume, Chanel No.5. Whales made it into the fashion industry too. Instead of teeth, baleen whales have long strips of keratin (the substance found in human nails and hair) which hang from their mouths – these plates were used in everything from skirts and women’s corsets, to umbrellas, parasols, fishing poles and crossbows.16
In the chart we see how this rising demand for whale products affected hunting rates across the world. This shows the number of whales killed each year, from 1900 onwards. For decades, tens of thousands of whales were killed each year. Only World War II gave these animals some reprieve – notice the drop in kills during the early-1940s.
At its peak in the 1960s, we were hunting 80,000 whales every year.
It didn’t go unnoticed that this rate of whale catch was unsustainable. In fact, a number of countries formed the International Whaling Commission (IWC) in 1946 to work out how to manage international whaling stocks. Quotas were introduced, but countries weren’t adhering to them.17 Whaling rates continued to rise, even after the lull of World War II. By the mid-20th century, many species were pushed to the brink of extinction.

By the mid-20th century, the prospects for whales was looking bleak. And yet, the world managed to turn things around.
In the chart we see the number of whales killed per decade. We see a gradual rise over the first half of the century – with the exception of the war-stricken 1940s – with whale catch reaching its peak in the 1960s. 703,000 whales were killed during the 1960s. But, we see a decline since then. What caused this?
There were a number of factors at play. By the 1960s, whale populations had become increasingly depleted – this scarcity had an impact on the economic incentives to hunt them. Whales were becoming harder to find and catch. Technological advances also meant that substitutes for whale oil and bone in the cosmetic, food and textile industries were becoming cheaper and more accessible. The whaling industry was losing its profitability.
There was another massive policy change in the 1980s. More and more countries were becoming members of the International Whaling Commission. In the map we see the timeline by which countries joined the IWC. After many decades of failed quota agreements, the IWC agreed to a global moratorium. This made commercial whaling illegal, with only a few exceptions.18 This came into action in 1987, and we see a dramatic drop-off in whale catch in the decades since then.
You will notice that we haven’t eliminated whaling completely. Some countries – such as Japan, Norway and Iceland – have resumed limited whaling outside the guidelines of the IWC.19 In 2019, Japan withdrew from the international agreement. These countries typically hunt species that are not considered to be critically endangered.
Some species will still take many decades to recover. Populations of North Atlantic right whale, the Arctic bowhead, and the Pacific blue whale are still critical. Yet the story of whaling overall is a conservation success: an animal that was once in high demand across the world has been saved from extinction through substitution and international cooperation. Many species are in a similar position to whales in the 1960s. But the decline of whaling should give us hope that we can turn things around once again.