Before we look at trends in deforestation across the world specifically, it’s useful to understand the net change in forest cover. The net change in forest cover measures any gains in forest cover – either through natural forest expansion or afforestation through tree-planting – minus deforestation.
This map shows the net change in forest cover across the world. Countries with a positive change (shown in green) are regrowing forest faster than they’re losing it. Countries with a negative change (shown in red) are losing more than they’re able to restore.
A note on UN FAO forestry data
Data on net forest change, afforestation and deforestation is sourced from the UN Food and Agriculture Organization’s Forest Resources Assessment. Since year-to-year changes in forest cover can be volatile, the UN FAO provide this annual data averaged over five-year periods.


Net forest loss is not the same as deforestation – it measures deforestation plus any gains in forest over a given period.
Over the decade since 2010, the net loss in forests globally was 4.7 million hectares per year.1 However, deforestation rates were much significantly higher.
The UN FAO estimate that 10 million hectares of forest were cut down each year.
This interactive map shows deforestation rates across the world.
A note on UN FAO forestry data
Data on net forest change, afforestation and deforestation is sourced from the UN Food and Agriculture Organization’s Forest Resources Assessment. Since year-to-year changes in forest cover can be volatile, the UN FAO provide this annual data averaged over five-year periods.


Many people think of environmental concerns as a modern issue: humanity’s destruction of nature and ecosystems as a result of very recent population growth and increasing consumption. This is true for some problems, such as climate change. But it’s not the case for deforestation. Humans have been cutting down trees for millennia.
How much forest has the world lost? When in history did we lose it?
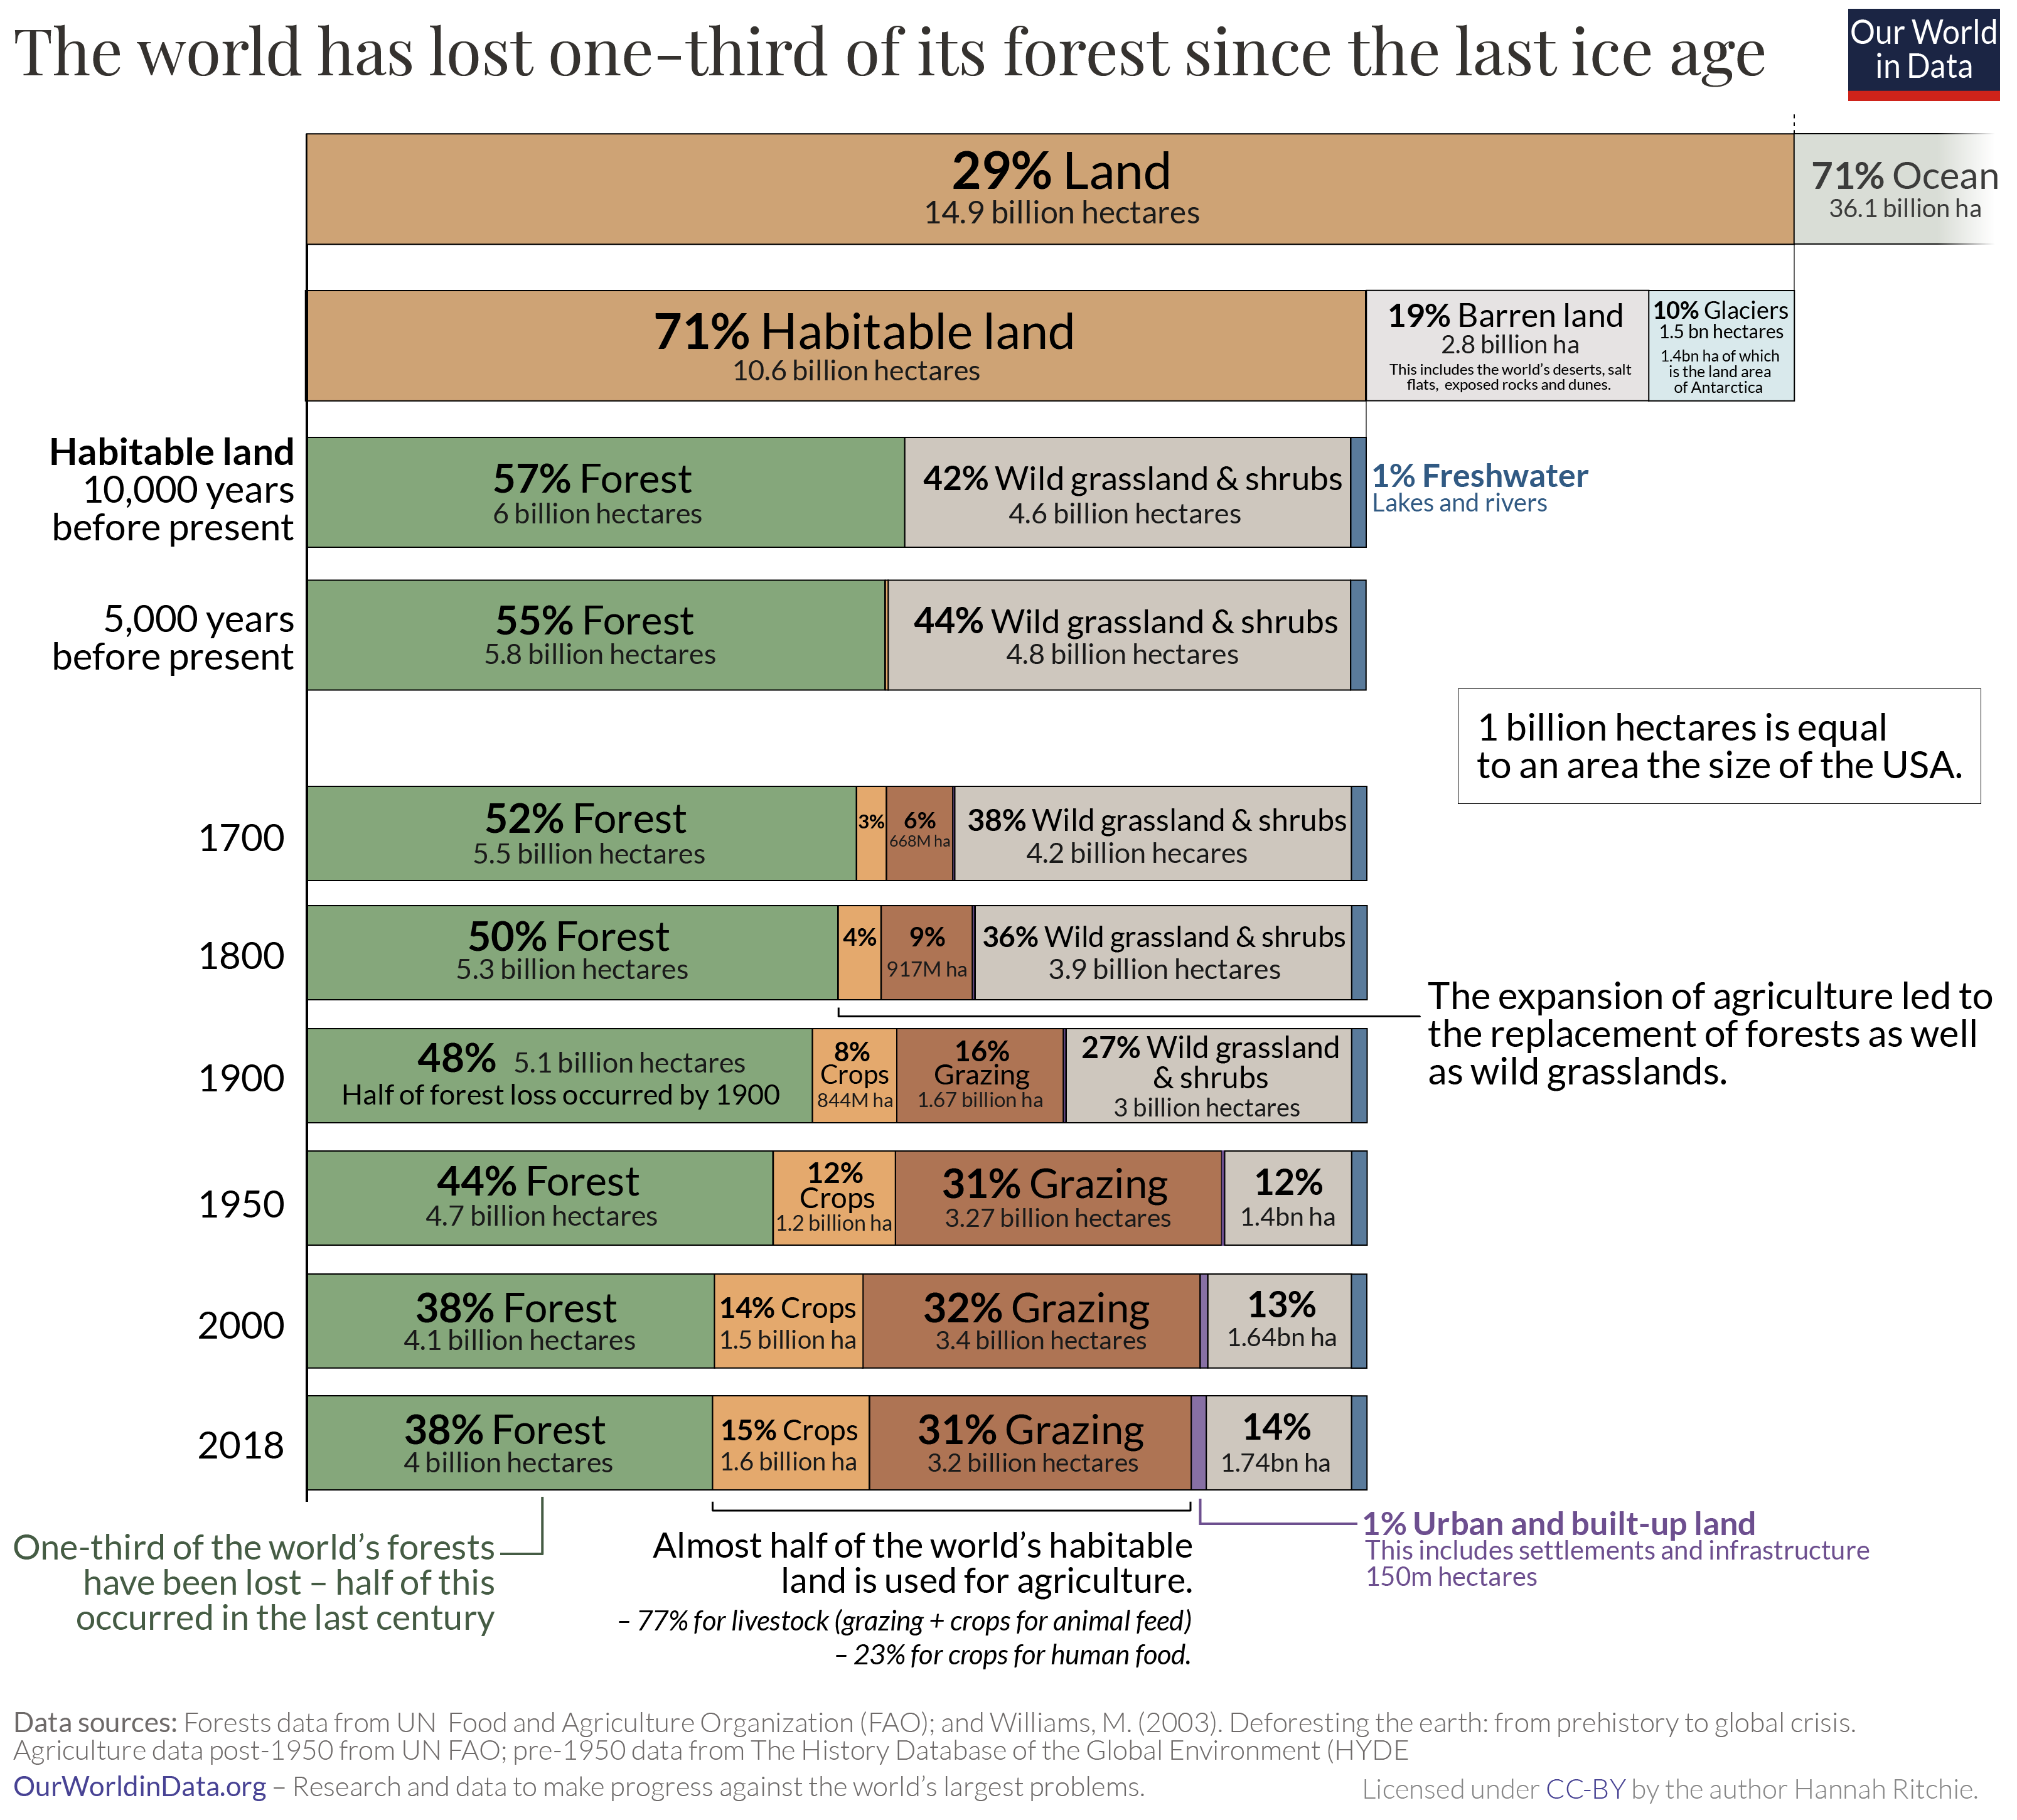
In the chart we see how the cover of the earth’s surface has changed over the past 10,000 years. This is shortly after the end of the last great ice age, through to the present day.2
Let’s start at the top. You see that of the 14.9 billion hectares of land on the planet, only 71% of it is habitable – the other 29% is either covered by ice and glaciers, or is barren land such as deserts, salt flats, or dunes. I have therefore excluded these categories so we can focus on how habitable land is used.
The bar chart just below shows the earth’s surface cover just after the end of the last ice age.3 10,000 years ago 57% of the world’s habitable land was covered by forest. That’s 6 billion hectares. Today, only 4 billion hectares are left. The world has lost one-third of its forest – an area twice the size of the United States.
Only 10% of this was lost in the first half of this period, until 5,000 years ago. The global population at this time was small and growing very slowly – there were fewer than 50 million people in the world. The amount of land per person that was needed to produce enough food was not small – in fact, it was much larger than today. But a small global population overall meant there was little pressure on forests to make space for land to grow food, and as wood for energy.
If we fast-forward to 1700 when the global population had increased more than ten-fold, to 603 million. The amount of land used for agriculture – land to grow crops as well as grazing land for livestock – was expanding. You will notice in the chart that this was not only expanding into previously forested land, but also other land uses such as wild grasslands and shrubbery. Still, more than half of the world’s habitable land was forested.
The turn of the 20th century is when global forest loss reached the halfway point: half of total forest loss occurred from 8,000BC to 1900; the other half occurred in the last century alone. This emphasises two important points.
First, it reiterates that deforestation is not a new problem: relatively small populations of the past were capable of driving a large amount of forest loss. By 1900, there were 1.65 billion people in the world (five times fewer than we have today) but for most of the previous period, humans were deforesting the world with only tens or hundreds of millions. Even with the most basic of lifestyles compared to today’s standards, the per capita footprint of our ancestors would have been large. Low agricultural productivity and a reliance on wood for fuel meant that large amounts of land had to be cleared for basic provisions.
Second, it makes clear how much deforestation accelerated over the last century. In just over 100 years the world lost as much forest as it had in the previous 9,000 years. An area the size of the United States. From the chart we see that this was driven by the continued expansion of land for agriculture. By 1950, there was almost as much agricultural land as forest – 43% of habitable land. By 2018, this had increased to 46% while forests shrank to 38%. When we think of the growing pressures on land from modern populations we often picture sprawling megacities. But urban land accounts for just 1% of global habitable land. Humanity’s biggest footprint is due to what we eat, not where we live.
This might paint a bleak picture for the future of the world’s forests: the United Nations projects that the global population will continue to grow, reaching 10.8 billion by 2100. But there are real reasons to believe that this century doesn’t have to replicate the destruction of the last one.
The world passed ‘peaked deforestation’ in the 1980s and it has been on the decline since then – we take a look at rates of forest loss since 1700 in our follow-up post. Improvements in crop yields mean the per capita demand for agricultural land continues to fall. We see this in the chart. Since 1961, the amount of land we use for agriculture increased by only 7%. Meanwhile, the global population increased by 147% – from 3.1 to 7.6 billion.4 This means that agricultural land per person more than halved, from 1.45 to 0.63 hectares.
In fact, the world may have already passed ‘peak agricultural land’ [we will look at this in more detail in an upcoming post]. And with the growth of technological innovations such as lab-grown meat and substitute products, there is the real possibility that we can continue to enjoy meat or meat-like foods while freeing up the massive amounts of land we use to raise livestock.
If we can take advantage of these innovations, we can bring deforestation to an end. A future with more people and more forest is possible.

Since the end of the last great ice age – 10,000 years ago – the world has lost one-third of its forests.5 Two billion hectares of forest – an area twice the size of the United States – has been cleared to grow crops, raise livestock, and use for fuelwood.
In a previous post we looked at this change in global forests over the long-run. What this showed was that although humans have been deforesting the planet for millennia, the rate of forest loss accelerated rapidly in the last few centuries. Half of global forest loss occurred between 8,000BC and 1900; the other half was lost in the last century alone.
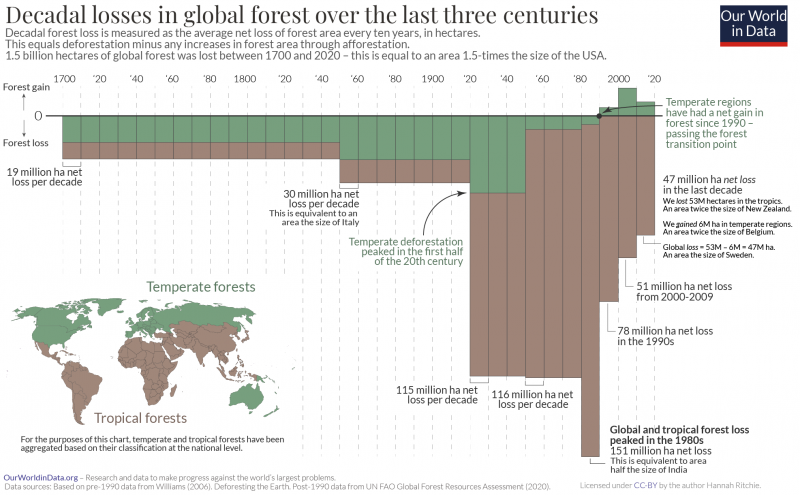
To understand this more recent loss of forest, let’s zoom in on the last 300 years. The world lost 1.5 billion hectares of forest over that period. That’s an area 1.5-times the size of the United States.
In the chart we see the decadal losses and gains in global forest cover. On the horizontal axis we have time, spanning from 1700 to 2020; on the vertical axis we have the decadal change in forest cover. The taller the bar, the larger the change in forest area. This is measured in hectares, which is equivalent to 10,000 m².
Forest loss measures the net change in forest cover: the loss in forests due to deforestation plus any expansion of forest through afforestation.6
To reconstruct this change I have brought together the data from a number of different sources.7 We’ve also differentiated between temperate forests (the sum of ‘boreal’ and ‘temperate’ areas), shown in green, and tropical forests (the sum of ‘tropical’ and ‘subtropical’ areas), shown in brown. It’s useful to make this distinction because – as we will see – where the world has lost forests has shifted.
The rate of forest loss changed a lot. From 1700 to 1850, 19 million hectares were being cleared every decade. That’s around half the size of Germany. From 1850 to 1920, losses were around 50% higher at 30 million hectares per decade –that’s like losing a forested area the size of Italy every 10 years. It was predominantly temperate forests that were being lost at this time. Population growth meant that today’s rich countries across Europe and North America needed more and more resources such as land for agriculture, wood for energy, and for construction.8
Moving into the 20th century there was a stepwise change in demand for agricultural land and energy from wood. Deforestation rates accelerated. From the 1920s through to the 1980s, decadal losses quadrupled to almost 120 million hectares. That’s equivalent to the area of South Africa. This increase was mostly driven by tropical deforestation as countries across Asia and Latin America followed the path of Europe and North America.
Global deforestation reached its peak in the 1980s. We lost 150 million hectares – an area half the size of India – during that decade. Clearing of the Brazilian Amazon for pasture and croplands was a major driver of this loss.
Since then, deforestation rates have steadily declined, to 78 million hectares in the 1990s; 52 million in the early 2000s; and 47 million in the last decade.
As we explore in more detail in our related article, countries tend to follow a predictable development in forest cover, a U-shaped curve.9 They lose forests as populations grow and demand for agricultural land and fuel increases, but eventually they reach the so-called ‘forest transition point’ where they begin to regrow more forests than they lose.
Within this global aggregated trend there are many forest transitions at local, national or regional levels occurring. We see one such transition in the chart: the forest loss in the temperate regions – shown as the green part of the bars – peaked much earlier than the global forest loss. In the first half of the 20th century, temperate forests reached their peak loss at 34 million hectares per decade, and by 1990 they had passed the ‘forest transition point’. For the past 30 years, temperate regions have seen a continued increase in forest cover through afforestation: you see this as the bars are now ‘positive’ (pointing upwards). Across temperate forests the world gained 6 million hectares in the last decade.
Tropical forests, on aggregate, have also passed peak deforestation in the 1980s – the longest of all bars – but have not passed the transition to reforestation. Some countries within this group are still far behind peak deforestation: without concerted effort to protect these forests it could be many decades before forests in those countries approach the transition point [as we show in a related post].10
The history of deforestation is a tragic one, in which we not only lost these wild and beautiful landscapes but also the wildlife within them. But, the fact that forest transitions are possible should give us confidence that a positive future is possible. Many countries have not only ended deforestation, but actually achieved substantial reforestation. It will be possible for our generation to achieve the same on the global scale and bring the 10,000 year history of forest loss to an end.
If we want to end deforestation we need to understand where and why it’s happening; where countries are within their transition; and what can be done to accelerate their progress through it. We need to pass the transition point as soon as possible, while minimising the amount of forest we lose along the way.
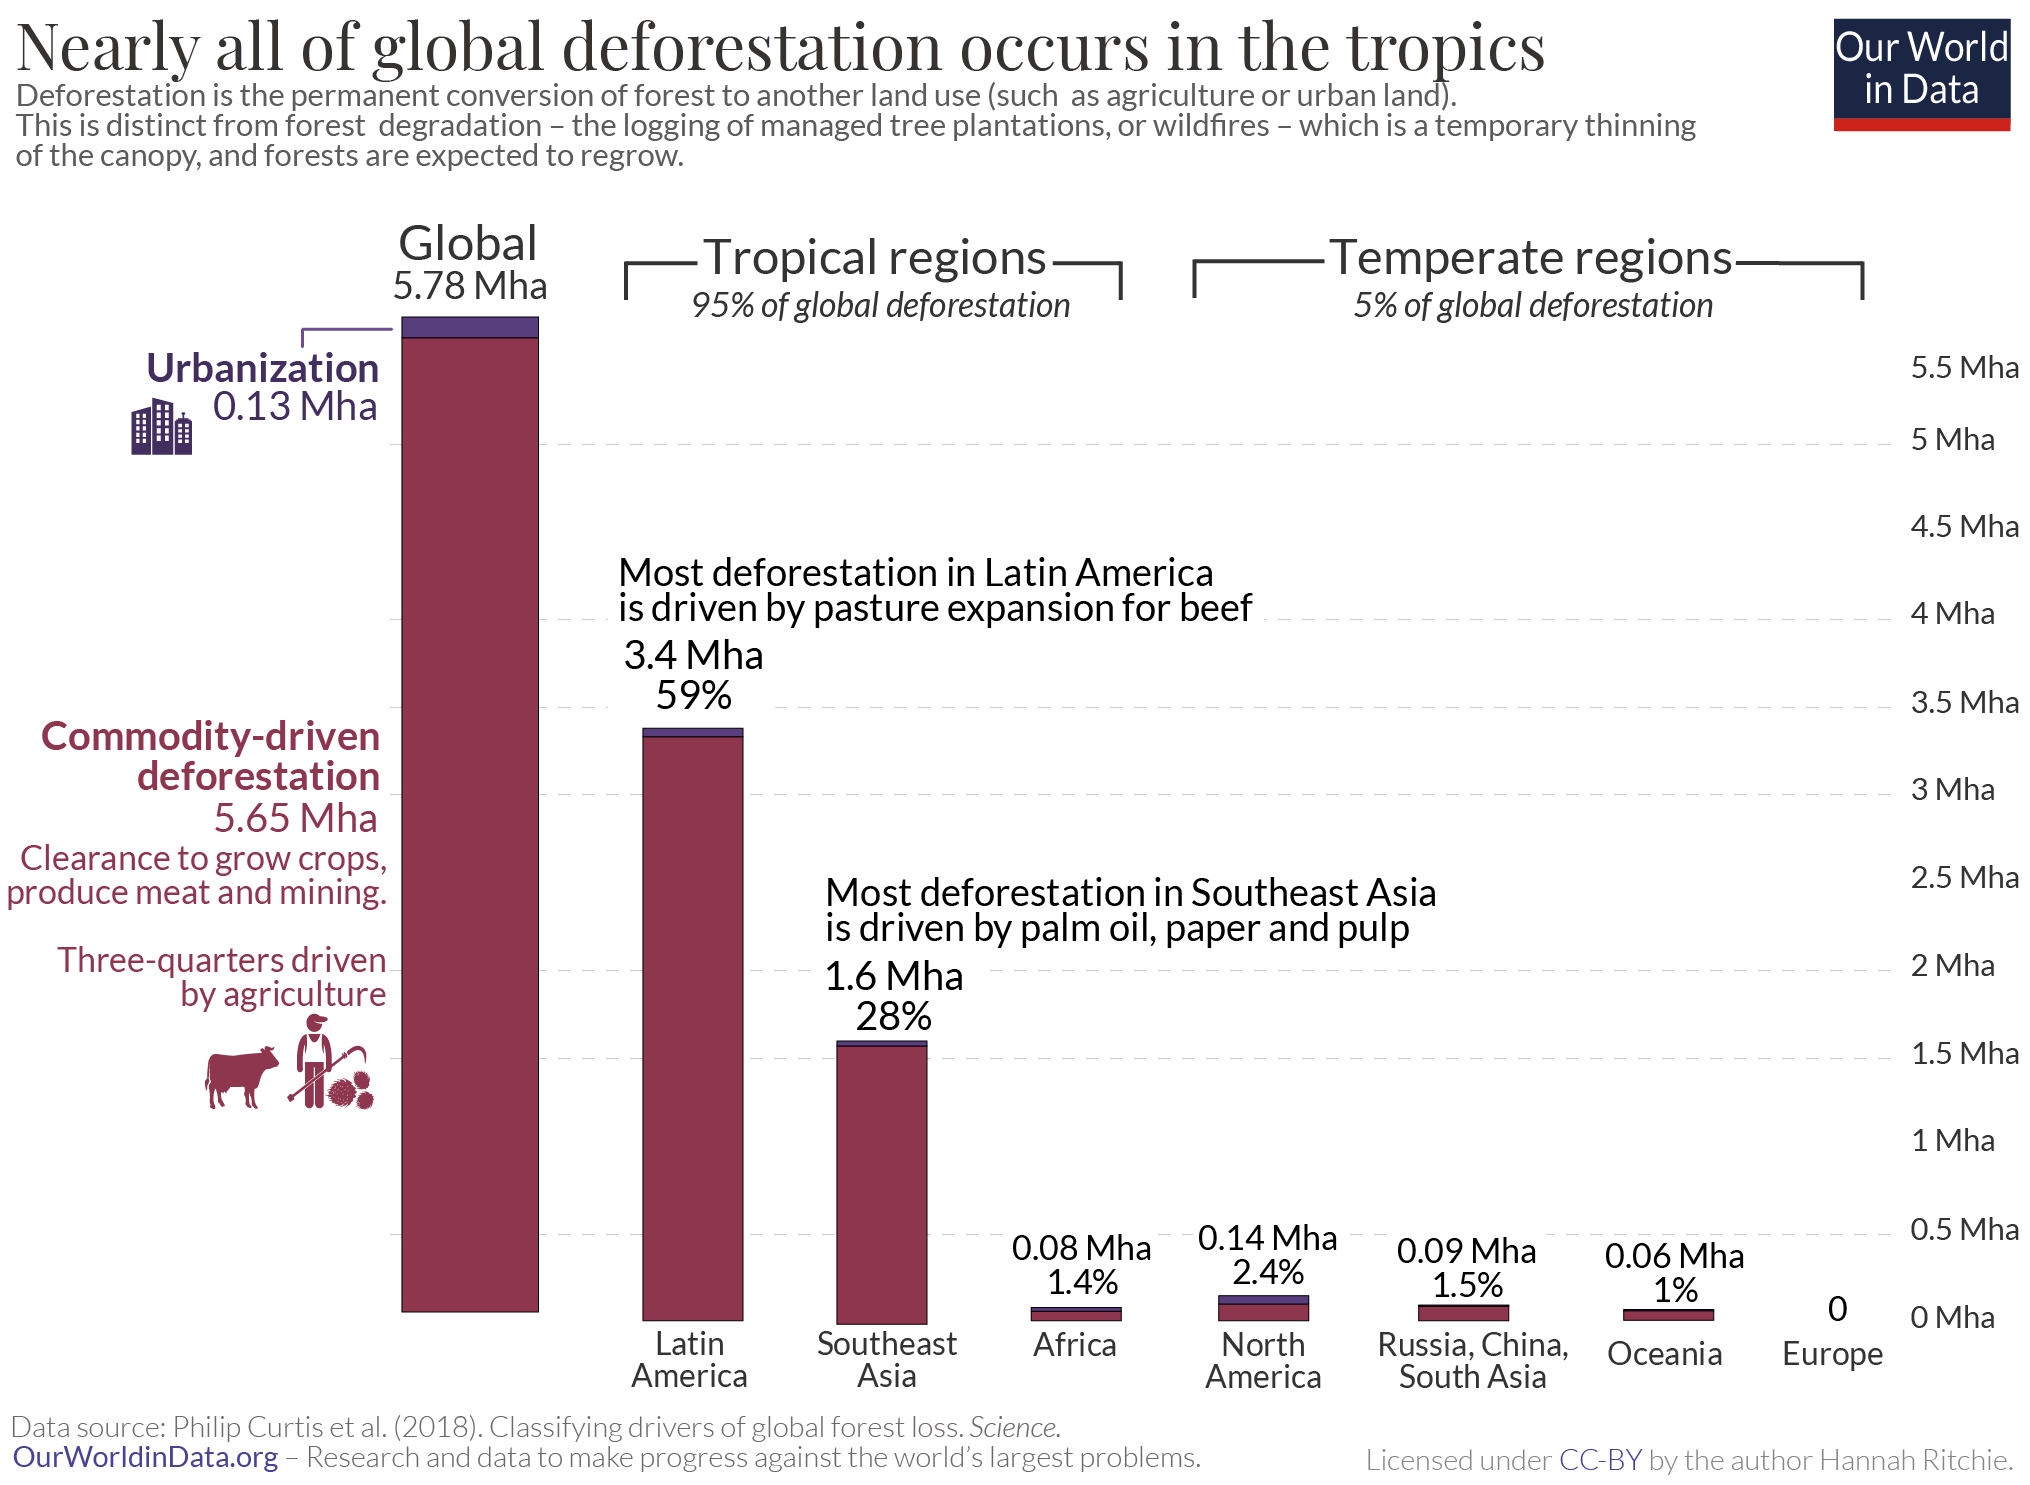
Globally we deforest around ten million hectares of forest every year.11 That’s an area the size of Portugal every decade. Around half of this deforestation is offset by regrowing forests, so overall we lose around five million hectares each year.
Nearly all – 95% – of this deforestation occurs in the tropics. But not all of it is to produce products for local markets. 14% of deforestation is driven by consumers in the world’s richest countries – we import beef, vegetable oils, cocoa, coffee and paper that has been produced on deforested land.12
The scale of deforestation today might give us little hope for protecting our diverse forests. But by studying how forests have changed over time, there’s good reason to think that a way forward is possible.
Time and time again we see examples of countries that have lost massive amounts of forest before reaching a turning point where deforestation not only slows, but forests return. In the chart we see historical reconstructions of country-level data on the share of land covered by forest (over decades, centuries or even millennia depending on the country). I have reconstructed long-term data using various studies which I’ve documented here.
Many countries have much less forest today than they did in the past. Nearly half (47%) of France was forested 1000 years ago; today that’s just under one-third (31.4%). The same is true of the United States; back in 1630 46% of the area of today’s USA was covered by forest. Today that’s just 34%.
1000 years ago, 20% of Scotland’s land was covered by forest. By the mid-18th century, only 4% of the country was forested. But then the trend turned, and it moved from deforestation to reforestation. For the last two centuries forests have been growing and are almost back to where they were 1000 years ago.13 England is similar: in the late 11th century, 15% of the country was forested, and over the following centuries two-thirds were cut down. By the 19th century the forest area was reduced to a third of what it once was. But it was then that England reached its transition point and since then, forests have doubled in size.14

What’s surprising is how consistent the pattern of change is across so many countries; as we’ve seen they all seem to follow a ‘U-shaped curve’. They first lose lots of forest, but reach a turning point and begin to regain it again.
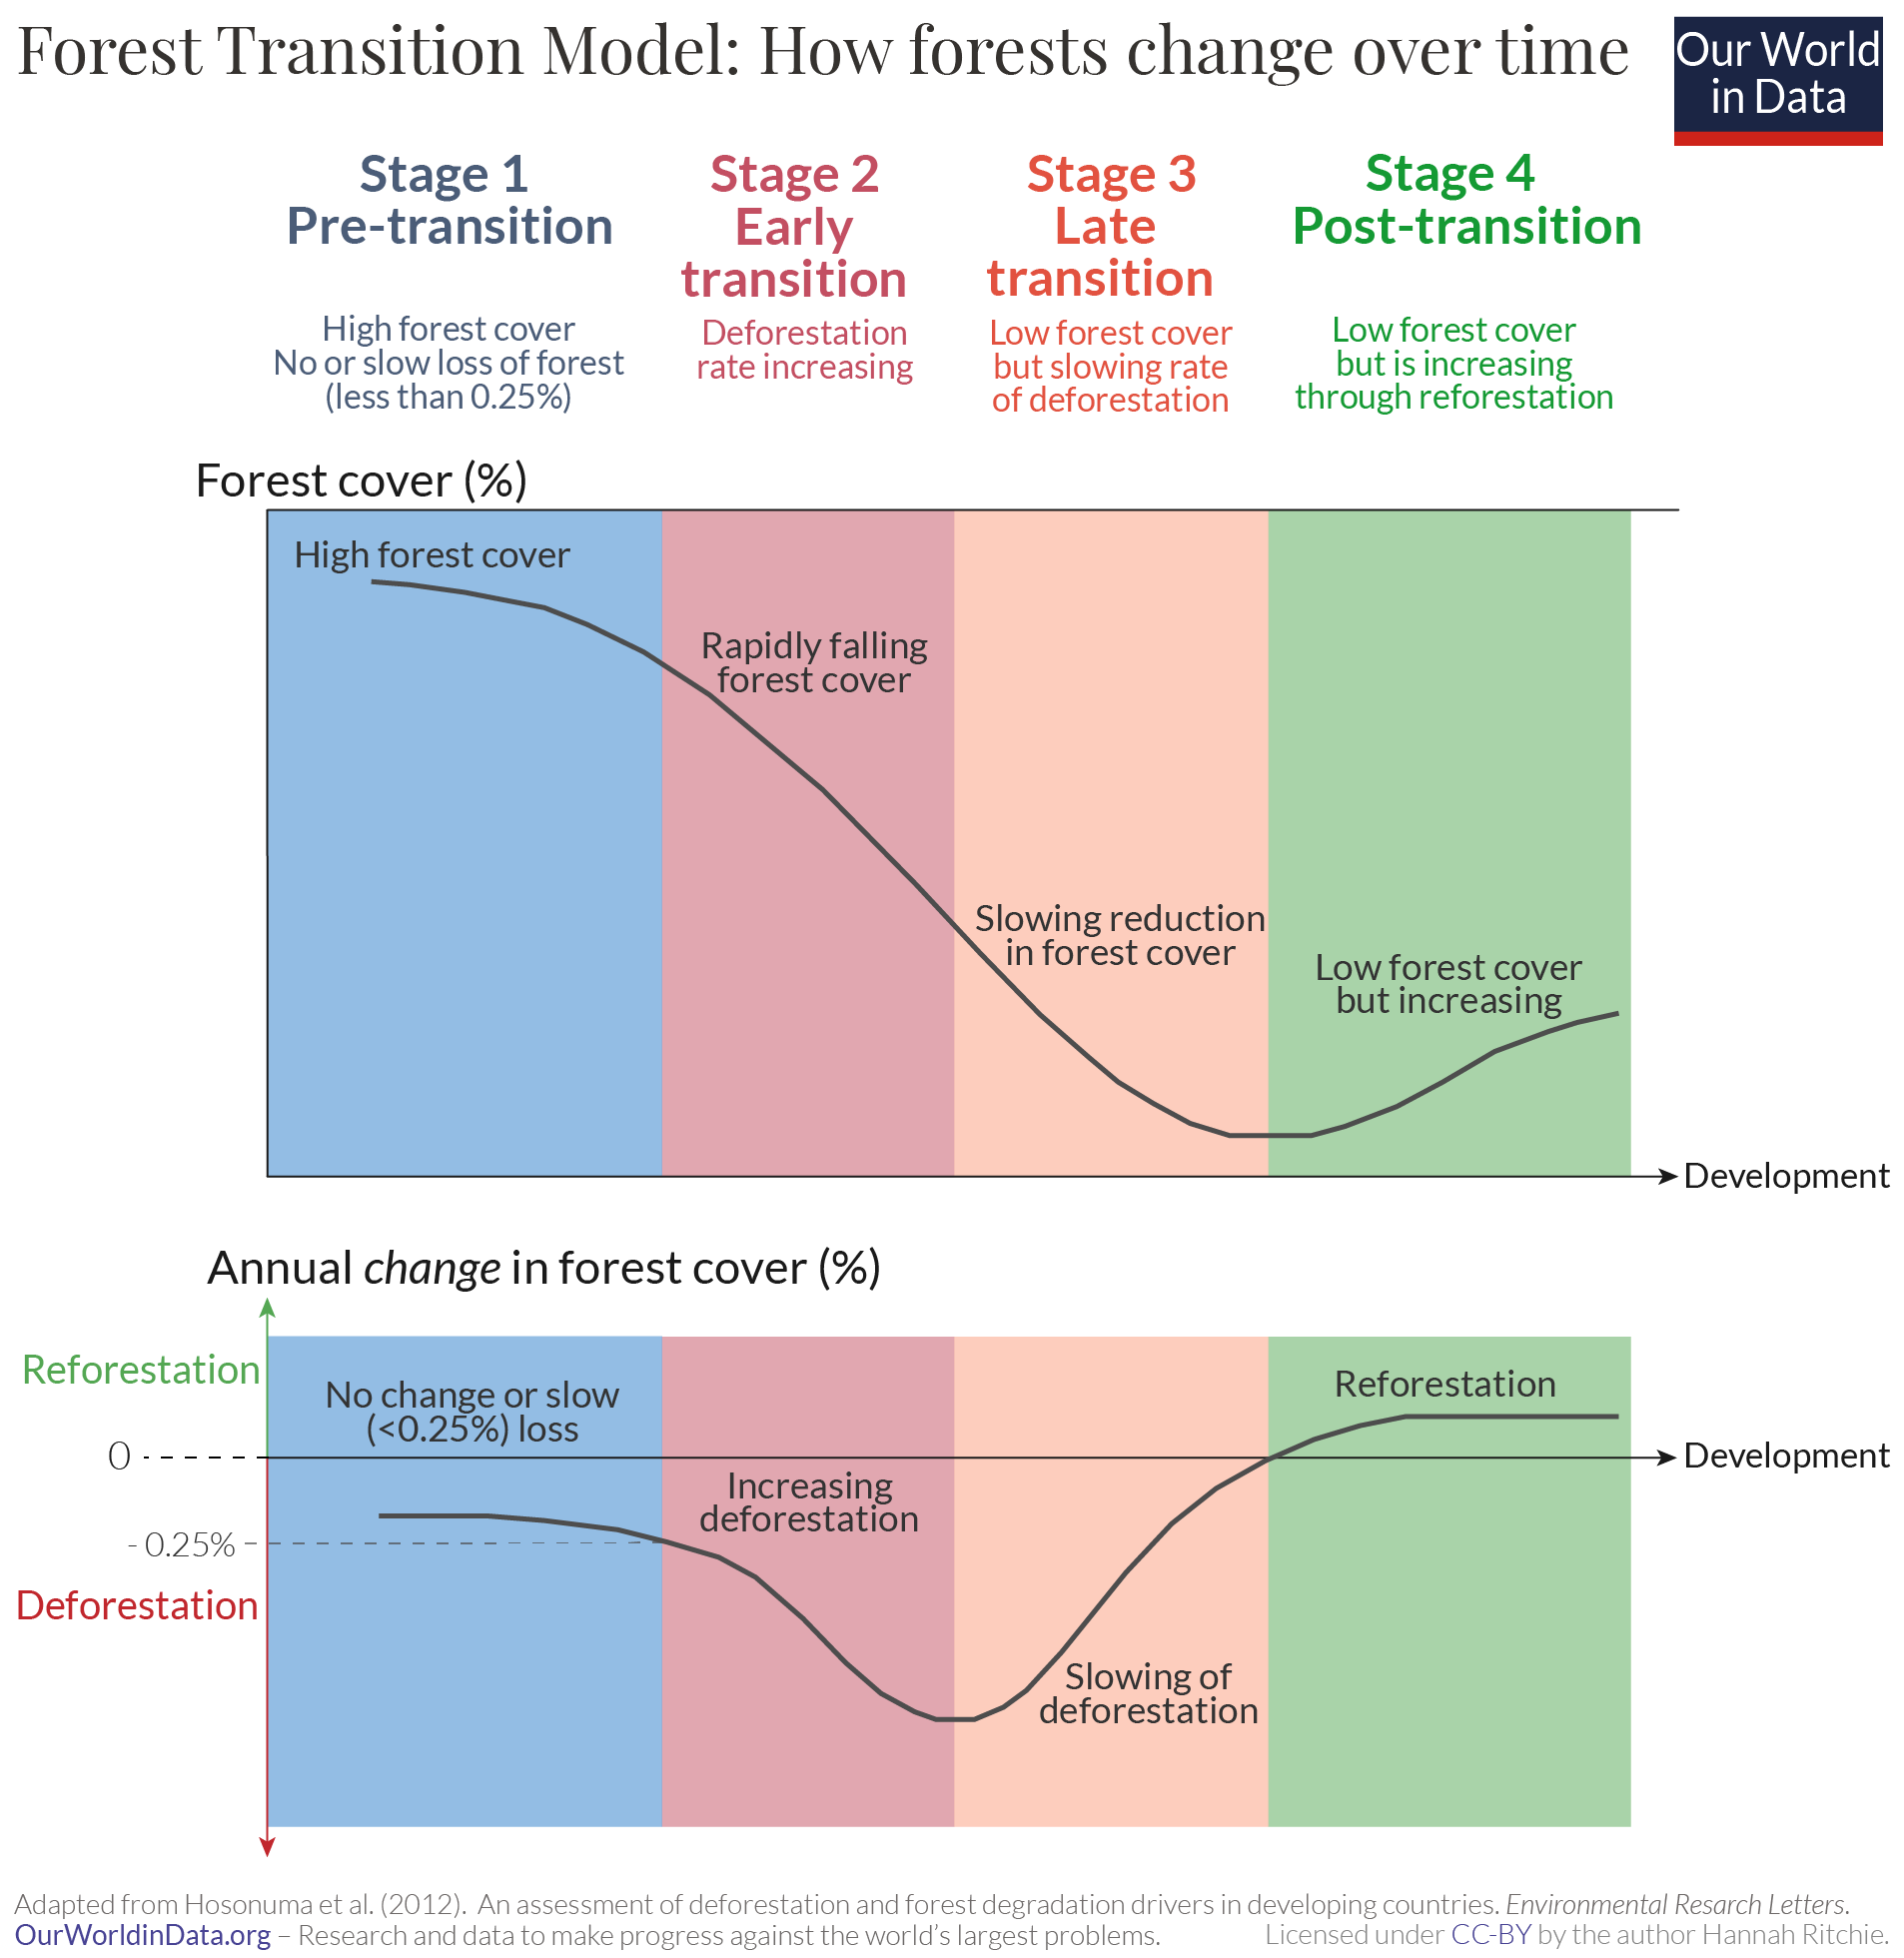
We can illustrate this through the so-called ‘Forest Transition Model’.15 This is shown in the chart. It breaks the change in forests into four stages, explained by two variables: the amount of forest cover a region has, and the annual change in cover (how quickly it is losing or gaining forest).16
Stage 1 – The Pre-Transition phase is defined by having high levels of forest cover and no or only very slow losses over time. Countries may lose some forest each year, but this is at a very slow rate. Mather refers to an annual loss of less than 0.25% as a small loss.
Stage 2 – The Early Transition phase is when countries start to lose forests very rapidly. Forest cover falls quickly, and the annual loss of forest is high.
Stage 3 – The Late Transition phase is when deforestation rates start to slow down again. At this stage, countries are still losing forest each year but at a lower rate than before. At the end of this stage, countries are approaching the ‘transition point’.
Stage 4 – The Post-Transition phase is when countries have passed the ‘transition point’ and are now gaining forest again. At the beginning of this phase, the forest area is at its lowest point. But forest cover increases through reforestation. The annual change is now positive.
Many countries have followed this classic U-shaped pattern. What explains this?
There are two reasons that we cut down forests:
- Forest resources: we want the resources that they provide – the wood for fuel, building materials, or paper;
- Land: – we want to use the land they occupy for something else – farmland to grow crops; pasture to raise livestock; or land to build roads and cities.
Our demand for both of these initially increases as populations grow and poor people get richer. We need more fuelwood to cook, more houses to live in, and importantly, more food to eat.
But, as countries continue to get richer this demand slows. The rate of population growth tends to slow down. Instead of using wood for fuel we switch to fossil fuels, or hopefully, more renewables and nuclear energy. Our crop yields improve and so we need less land for agriculture.
This demand for resources and land is not always driven by domestic markets. As I mentioned earlier, 14% of deforestation today is driven by consumers in rich countries.
The Forest Transition therefore tends to follow a ‘development’ pathway.17,1819 As a country achieves economic growth it moves through each of the four stages. This explains historical trends we see for countries across the world today. Rich countries – such as the USA, France and the United Kingdom – have had a long history of deforestation but are now passed the transition point. Most deforestation today occurs in low-to-middle income countries.
If we look at where countries are in their transition today we can understand where we expect to lose and gain forest in the coming decades. Most of our future deforestation is going to come from countries in the pre- or early-transition phase.
Several studies have assessed the stage of countries across the world..20 The most recent analysis to date was published by Florence Pendrill and colleagues (2019) which looked at each country’s stage in the transition, the drivers of deforestation but also the role of international trade.21 `To do this, they used the standard metrics discussed in our theory of forest transitions earlier: the share of land that is forested, and the annual change in forest cover.
In the map we see their assessment of each country’s stage in the transition. Most of today’s richest countries – all of Europe, North America, Japan, South Korea – have passed the turning point and are now regaining forest. This is also true for major economies such as China and India. That these countries have recently regained forests is also visible in the long-term forest trends above.
Across sub-tropical countries we have a mix: many upper-middle income countries are now in the late transition phase. Brazil, for example, went through a period of very rapid deforestation in the 1980s and 90s (its ‘early transition’ phase) but its losses have slowed, meaning it is now in the late transition. Countries such as Indonesia, Myanmar, and the Democratic Republic of Congo are in the early transition phase and are losing forests quickly. Some of the world’s poorest countries are still in the pre-transition phase. In the coming decades this is where we might expect to see the most rapid loss of forests unless these countries take action to prevent it, and the world supports them in the goal.

15 billion trees are cut down every year.22 The Global Forest Watch project – using satellite imagery – estimates that global tree loss in 2019 was 24 million hectares. That’s an area the size of the United Kingdom.
These are big numbers, and important ones to track: forest loss creates a number of negative impacts, ranging from carbon emissions to species extinctions and biodiversity loss. But distilling changes to this single metric – tree or forest loss – comes with its own issues.
The problem is that it treats all forest loss as equal. It assumes the impact of clearing primary rainforest in the Amazon to produce soybeans is the same as logging planted forests in the UK. The latter will experience short-term environmental impacts, but will ultimately regrow. When we cut down primary rainforest we are transforming this ecosystem forever.
When we treat these impacts equally we make it difficult to prioritize our efforts in the fight against deforestation. Decisionmakers could give as much of our attention to European logging as to destruction of the Amazon. As we will see later, this would be a distraction from our primary concern: ending tropical deforestation. The other issue that arises is that ‘tree loss’ or ‘forest loss’ data collected by satellite imagery often doesn’t match the official statistics reported by governments in their land use inventories. This is because the latter only captures deforestation – the replacement of forest with another land use (such as cropland). It doesn’t capture trees that are cut down in planted forests; the land is still forested, it’s now just regrowing forest.
In the article we will look at the reasons we lose forest; how these can be differentiated in a useful way; and what this means for understanding our priorities in tackling forest loss.
‘Forest loss’ or ‘tree loss’ captures two fundamental impacts on forest cover: deforestation and forest degradation.
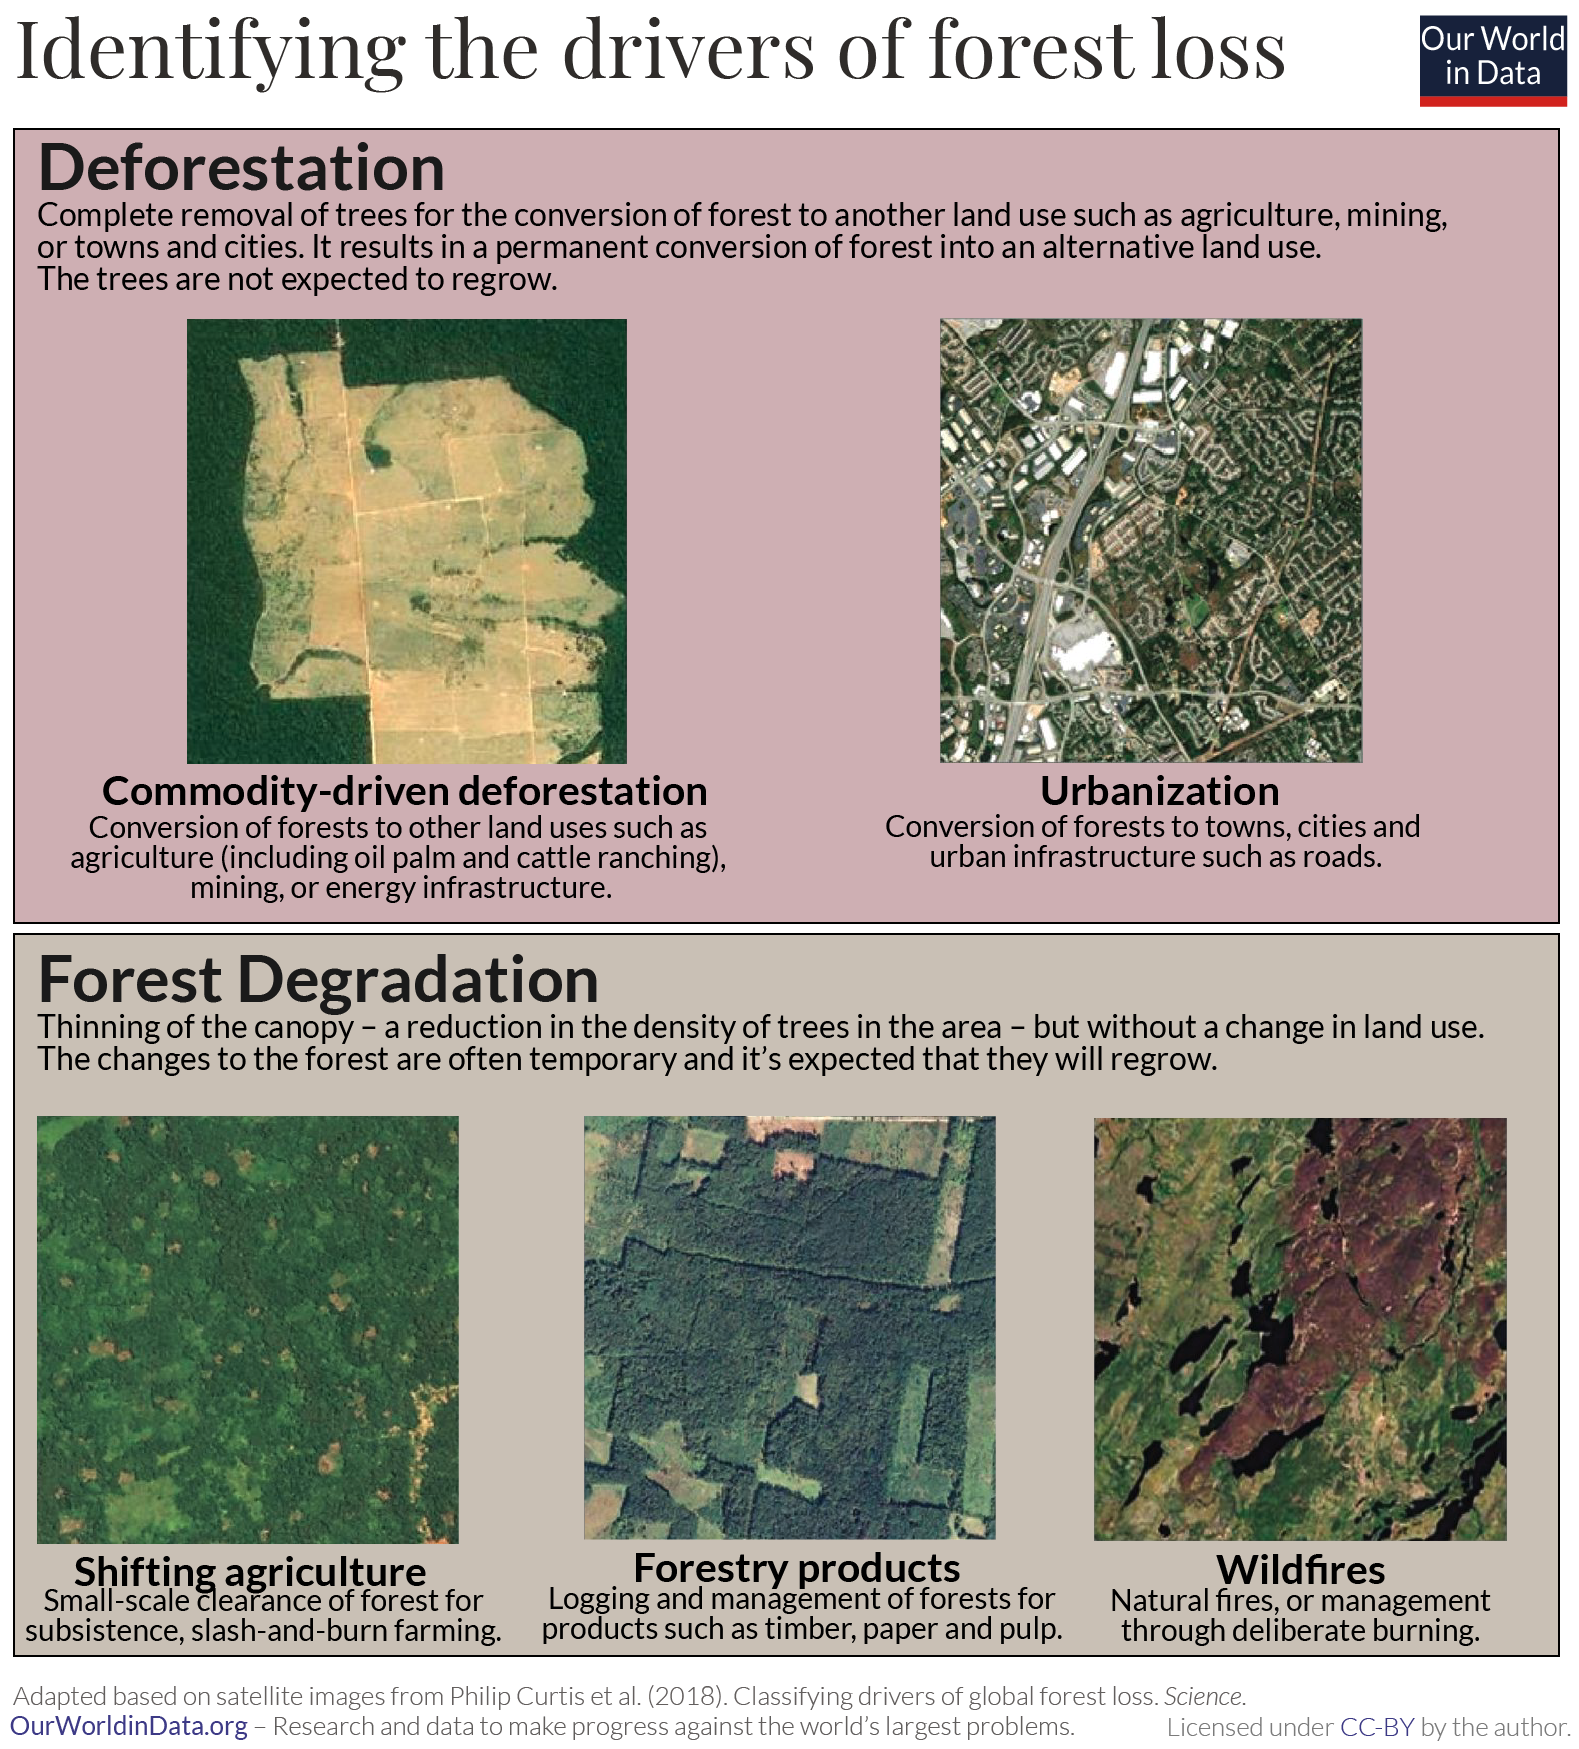
Deforestation is the complete removal of trees for the conversion of forest to another land use such as agriculture, mining, or towns and cities. It results in a permanent conversion of forest into an alternative land use. The trees are not expected to regrow. Forest degradation measures a thinning of the canopy – a reduction in the density of trees in the area – but without a change in land use. The changes to the forest are often temporary and it’s expected that they will regrow.
From this understanding we can define five reasons why we lose forests:
- Commodity-driven deforestation is the long-term, permanent conversion of forests to other land uses such as agriculture (including oil palm and cattle ranching), mining, or energy infrastructure.
- Urbanization is the long-term, permanent conversion of forests to towns, cities and urban infrastructure such as roads.
- Shifting agriculture is the small to medium-scale conversion of forest for farming, that is later abandoned so that forests regrow. This is common of local, subsistence farming systems where populations will clear forest, use it to grow crops, then move on to another plot of land.
- Forestry production is the logging of managed, planted forests for products such as timber, paper and pulp. These forests are logged periodically and allowed to regrow.
- Wildfires destroy forests temporarily. When the land is not converted to a new use afterwards forests can regrow in the following years.
Thanks to satellite imagery, we can get a birds-eye view of what these drivers look like from above. In the figure we see visual examples from the study of forest loss classification by Philip Curtis et al. (2018), published in Science.23
Commodity-driven deforestation and urbanization are deforestation: the forested land is completely cleared and converted into another land use – a farm, mining site, or city. The change is permanent. There is little forest left. Forestry production and wildfires usually result in forest degradation – the forest experiences short-term disturbance but if left alone is likely to regrow. The change is temporary. This is nearly always true of planted forests in temperate regions – there, planted forests are long-established and do not replace primary existing forests. In the tropics, some forestry production can be classified as deforestation when primary rainforests are cut down to make room for managed tree plantations.24
‘Shifting agriculture’ is usually classified as degradation because the land is often abandoned and the forests regrow naturally. But it can bridge between deforestation and degradation depending on the timeframe and permanence of these agricultural practices.
We’ve seen the five key drivers of forest loss. Let’s put some numbers to them.
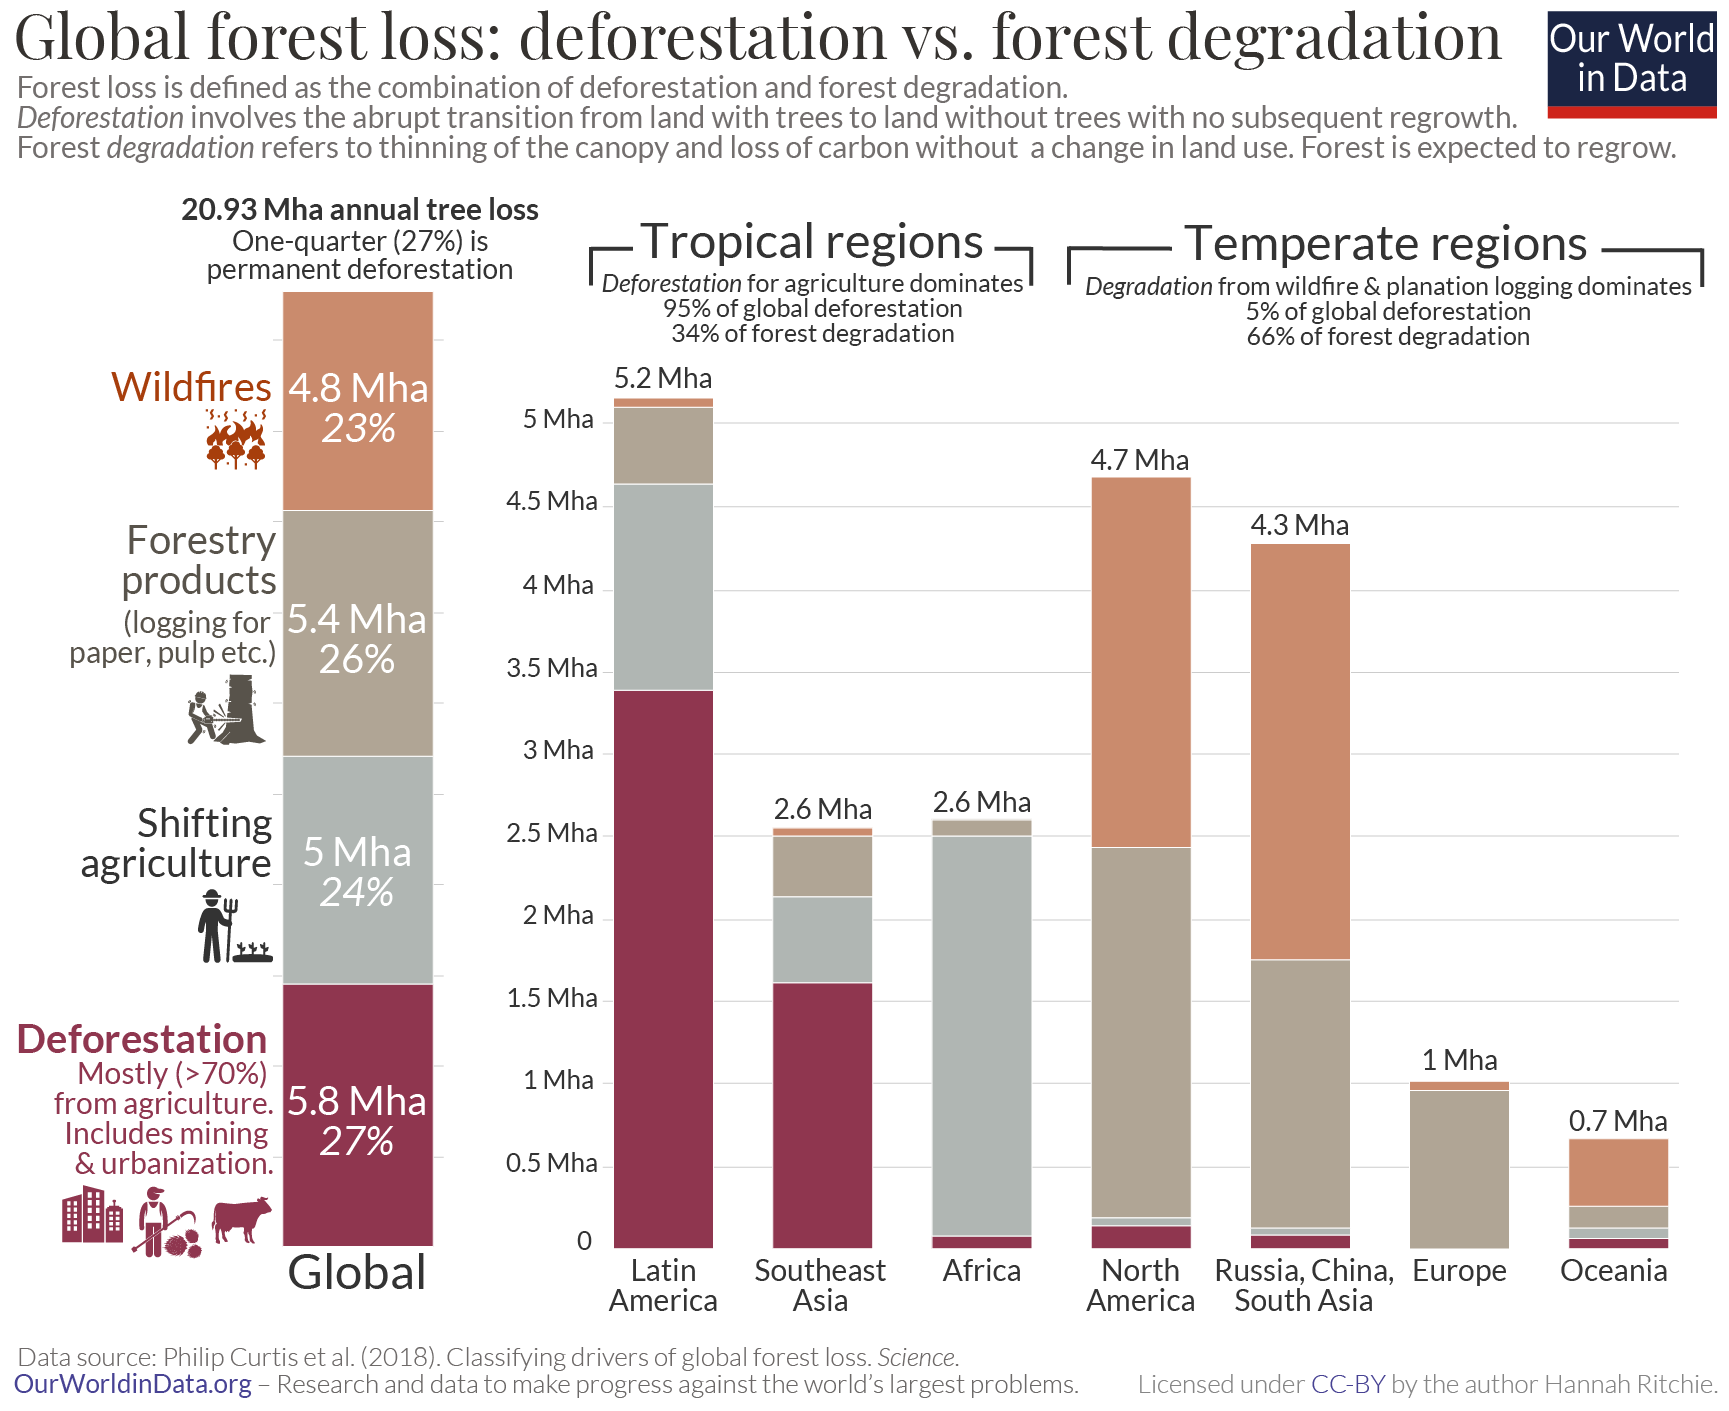
In their analysis of global forest loss, Philip Curtis and colleagues used satellite images to assess where and why the world lost forests between 2001 and 2015. The breakdown of forest loss globally, and by region, is shown in the chart.25
Just over one-quarter of global forest loss is driven by deforestation. The remaining 73% came from the three drivers of forest degradation: logging of forestry products from plantations (26%); shifting, local agriculture (24%); and wildfires (23%).
We see massive differences in how important each driver is across the world. 95% of the world’s deforestation occurs in the tropics [we look at this breakdown again later]. In Latin America and Southeast Asia in particular, commodity-driven deforestation – mainly the clearance of forests to grow crops such as palm oil and soy, and pasture for beef production – accounts for almost two-thirds of forest loss.
In contrast, most forest degradation – two-thirds of it – occurs in temperate countries. Centuries ago it was mainly temperate regions that were driving global deforestation [we take a look at this longer history of deforestation in a related article]. They cut down their forests and replaced it with agricultural land long ago. But this is no longer the case: forest loss across North America and Europe is now the result of harvesting forestry products from tree plantations, or tree loss in wildfires.
Africa is also different here. Forests are mainly cut and burned to make space for local, subsistence agriculture or for fuelwood for energy. This ‘shifting agriculture’ category can be difficult to allocate between deforestation and degradation: it often requires close monitoring over time to understand how permanent these agricultural practices are.
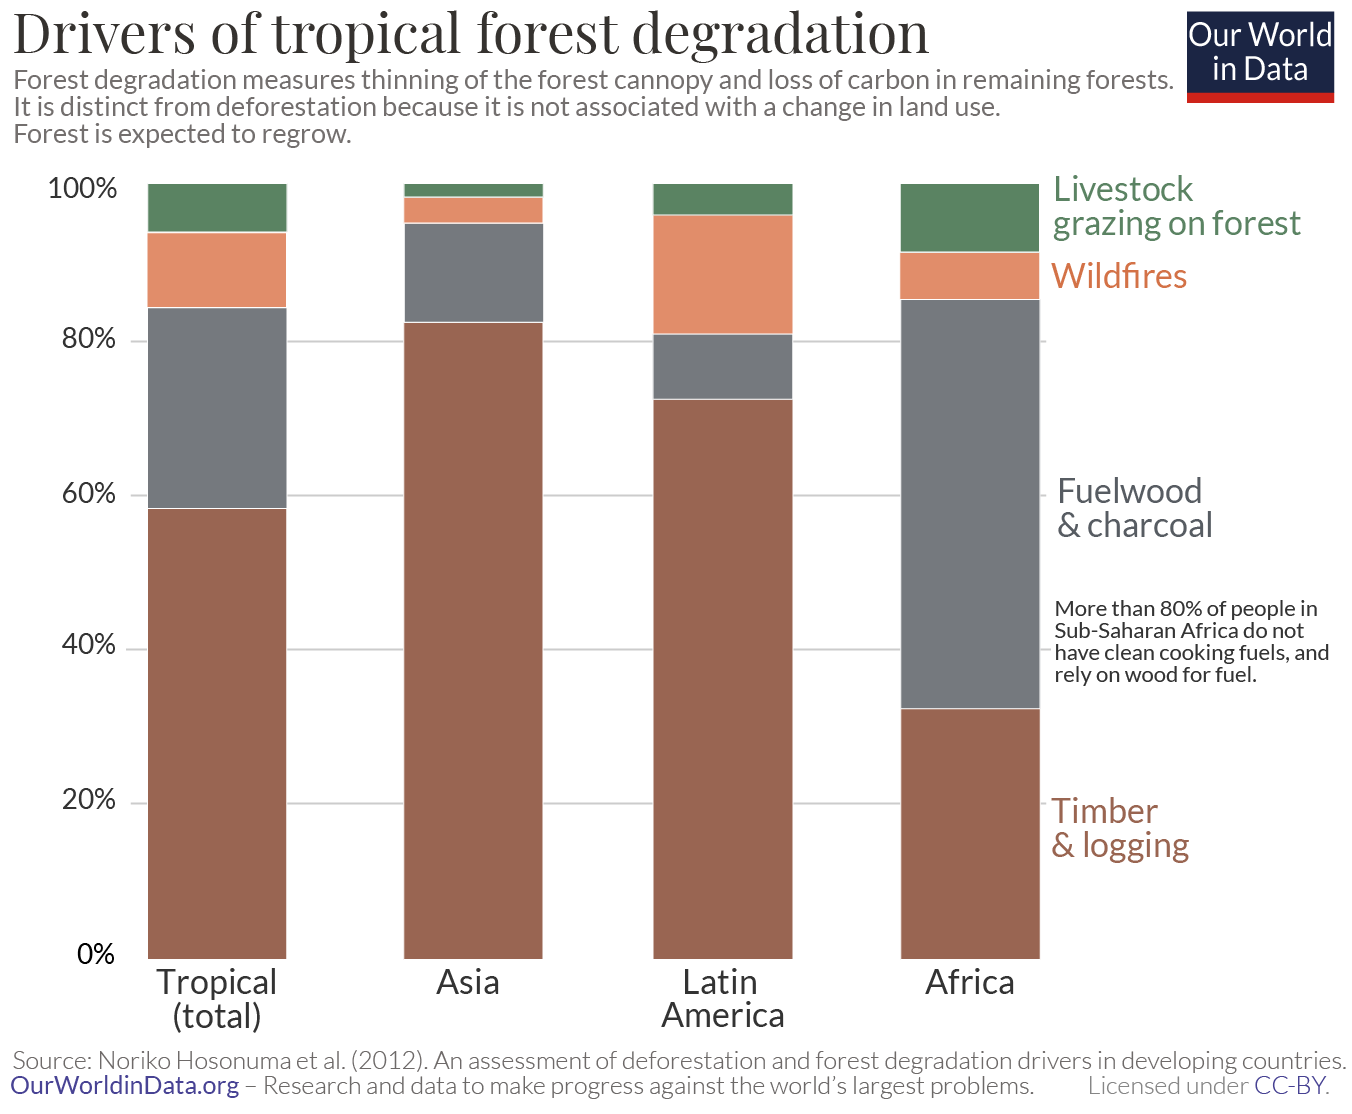
Africa is also an outlier as a result of how many people still rely on wood as their primary energy source. Noriko Hosonuma et al. (2010) looked at the primary drivers of deforestation and degradation across tropical and subtropical countries specifically.26 The breakdown of forest degradation drivers is shown in the following chart. Note that in this study, the category of subsistence agriculture was classified as a deforestation driver, and so is not included. In Latin America and Asia the dominant driver of degradation was logging for products such as timber, paper and pulp – this accounted for more than 70%. Across Africa, fuelwood and charcoal played a much larger role – it accounted for more than half (52%).
This highlights an important point: less than 20% of people in Sub-Saharan Africa have access to clean fuels for cooking, meaning they still rely on wood and charcoal. With increasing development, urbanization and access to other energy resources, Africa will shift from local, subsistence activities into commercial commodity production – both in agricultural products and timber extraction. This follows the classic ‘forest transition’ model with development, which we look at in more detail in a related article.
The world loses almost six million hectares of forest each year to deforestation. That’s like losing an area the size of Portugal every two years. 95% of this occurs in the tropics. The breakdown of deforestation by region is shown in the chart. 59% occurs in Latin America, with a further 28% from Southeast Asia. In a related article we look in much more detail at what agricultural products, and which countries are driving this.
As we saw previously, this deforestation accounts for around one-quarter of global forest loss. 27% of forest loss results from ‘commodity-driven deforestation’ – cutting down forests to grow crops such as soy, palm oil, cocoa, to raise livestock on pasture, and mining operations. Urbanization, the other driver of deforestation accounts for just 0.6%. It’s the foods and products we buy, not where we live, that has the biggest impact on global land use.
It might seem odd to argue that we should focus our efforts on tackling this quarter of forest loss (rather than the other 73%). But there is good reason to make this our primary concern.
Philipp Curtis and colleagues make this point clear. At their Global Forest Watch platform they were already presenting maps of forest loss across the world. But they wanted to contribute to a more informed discussion about where to focus forest conservation efforts by understanding why forests were being lost. To quote them, they wanted to prevent “a common misperception that any tree cover loss shown on the map represents deforestation”. And to “identify where deforestation is occurring; perhaps as important, show where forest loss is not deforestation”.
Why should we care most about tropical deforestation? There is a geographical argument (why the tropics?) and an argument for why deforestation is worse than degradation.
Tropical forests are home to some of the richest and most diverse ecosystems on the planet. Over half of the world’s species reside in tropical forests.27 Endemic species are those which only naturally occur in a single country. Whether we look at the distribution of endemic mammal species, bird species, or amphibian species, the map is the same: subtropical countries are packed with unique wildlife. Habitat loss is the leading driver of global biodiversity loss.28 When we cut down rainforests we are destroying the habitats of many unique species, and reshaping these ecosystems permanently. Tropical forests are also large carbon sinks, and can store a lot of carbon per unit area.29
Deforestation also results in larger losses of biodiversity and carbon relative to degradation. Degradation drivers, including logging and especially wildfires can definitely have major impacts on forest health: animal populations decline, trees can die, and CO2 is emitted. But the magnitude of these impacts are often less than the complete conversion of forest. They are smaller, and more temporary. When deforestation happens, almost all of the carbon stored in the trees and vegetation – called the ‘aboveground carbon loss’ – is lost. Estimates vary, but on average only 10-20% of carbon is lost during logging, and 10-30% from fires.30 In a study of logging practices in the Amazon and Congo, forests retained 76% of their carbon stocks shortly after logging.31 Logged forests recover their carbon over time, as long as the land is not converted to other uses (which is what happens in the case of deforestation).
Deforestation tends to occur on forests that have been around for centuries, if not millennia. Cutting them down disrupts or destroys established, species-rich ecosystems. The biodiversity of managed tree plantations which are periodically cut, regrown, cut again, then regrown is not the same.
That is why we should be focusing on tropical deforestation. Since agriculture is responsible for 60 to 80% of it, what we eat, where it’s sourced from, and how it is produced is our strongest lever to bring deforestation to an end.
There is a marked divide in the state of the world’s forests. In most rich countries, across Europe, North America and East Asia, forest cover is increasing, whilst many low-to-middle income countries it’s decreasing.
But, it would be wrong to think that the only impact rich countries have on global forests is through changes in their domestic forests. They also contribute to global deforestation through the foods they import from poorer countries.
Today, most deforestation occurs in the tropics. 71% of this is driven by demand in domestic markets, and the remaining 29% for the production of products that are traded. 40% of traded deforestation ends up in high-income countries, meaning they are responsible for 12% of deforestation.32
Let’s take a look at which countries are causing deforestation overseas and the size of this impact.
How much do people in rich countries contribute to deforestation overseas?
To investigate this question, researchers Florence Pendrill et al. (2019) quantified the deforestation embedded in traded goods between countries.33 They did this by calculating the amount of deforestation associated with specific food and forestry products, and combining it with a trade model.
In the map we see the net deforestation embedded in trade for each country. This is calculated by taking each country’s imported deforestation and subtracting its exported deforestation. Net importers of deforestation (shown in brown) are countries that contribute more to deforestation in other countries than they do in their home country. The consumption choices of people in these countries cause deforestation elsewhere in the world.
For example, after we adjust for all the goods that the UK imports and exports, it caused more deforestation elsewhere than it did domestically. It was a net importer. Brazil, in contrast, caused more deforestation domestically in the production of goods for other countries than it imported from elsewhere. It was a net exporter.
Although there is some year-to-year variability [you can explore the data use the timeline on the bottom of the chart from 2005 to 2013] we see a reasonably consistent divide: most countries across Europe and North America are net importers of deforestation i.e. they’re driving deforestation elsewhere; whilst many subtropical countries are partly cutting down trees to meet this demand from rich countries.
Most deforestation occurs for the production of goods that are consumed within domestic markets. 71% of deforestation is for domestic production. Less than one-third (29%) is for the production of goods that are traded.
High-income countries were the largest ‘importers’ of deforestation, accounting for 40% of it. This means they were responsible for 12% of global deforestation.34 It is therefore true that rich countries are causing deforestation in poorer countries.


Many rich countries are driving deforestation in other parts of the world, but are regrowing forests domestically. 79% of exported deforestation ended up in those countries that had stopped losing domestic forests.
How do these two measures compare? Are they causing more deforestation elsewhere than they are regenerating in forests at home?
Let’s take an example. Imagine some temperate country was responsible for the deforestation of 25,000 hectares in tropical countries but was restoring its own forests at a rate of 50,000 hectares per year. On balance, it would still have a positive impact on the size of global forests; its net contribution would be increasing forest area by 25,000 hectares.35 However, this country might still be causing more damage than this for a couple of reasons. Not all forest is equal. Tropical forests are often more productive than temperate forests, meaning they store more carbon. They are also richer sites of biodiversity. And, we might place more value on preserving primary, native forests that haven’t yet been deforested over regrowing forests that have lost their previous ecosystems. Hence, we should keep in mind that forest area is not the only aspect that matters – where that forest is and how rich in life it is matters too.
It would be good if there was data available that would capture these additional aspects. We manage to capture some of these differences in carbon in our related article on deforestation emissions embedded in trade. Without reliable metrics that capture all of these differences, we will have to stick with total changes in forest area for now. But we should keep these important aspects in mind when comparing forest losses and gains.
In the chart we see the comparison between the change in domestic forest area, and deforestation driven by imported goods.36 On the vertical axis we have the domestic change in forest area: this is shown only for countries where the forest area is increasing. Since there is often year-to-year variability in deforestation or reforestation rates, this is shown as the five-year average. On the x-axis we have imported deforestation. The grey line marks where the area of domestic regrowth of forests is exactly equal to imported deforestation. Countries that lie along this line would have a net-neutral impact on global forests: the area they are causing to deforestation overseas is exactly as large as the area they are regrowing at home.
Countries which lie above the grey line – such as the United States, Finland, China – restore more forest each year domestically than they import from elsewhere. For example, the US ‘imported’ 64,000 hectares of deforested land, but increased its domestic forest area by 275,000 hectares. More than four times as much. On balance, they add to the global forest stock.
Countries below the line – such as the UK and Germany – are not growing forests fast enough to offset the deforestation they’re creating elsewhere. The UK ‘imported’ 34,000 hectares of deforestation but increased its domestic forests by only 19,000 hectares. These countries might have high levels of afforestation at home, but they’re still having a net negative impact on the size of the world’s forests.

After seeing this data, people might argue that we should cut back on trade. If poorer countries are cutting down forests to make food for rich consumers, then we should just stop trading these goods.
But the solution is not so simple. There are other aspects to consider. International trade is important for socioeconomic development. Many farmers rely on international buyers to earn a living and improve their livelihoods. Not only would this be bad for people, it might also be bad for forests.
One of the reasons poorer countries clear forest to make room for farmland is that they achieve low crop yields. If you struggle to increase crop yields but want to produce more food, then expanding your agricultural land is the only option. This often comes at the cost of forests. Improvements in agricultural productivity tends to both drive and follow economic growth. International trade plays an important role in this growth, and may allow farmers to see the yield gains they need to produce more food using less land.
So, what can we do?
One option is to adopt stricter guidelines on what suppliers to source from, and implementing zero-deforestation policies that stop the trade of goods that have been produced on deforested land. Another way that richer countries can contribute is by investing in technologies – such as improved seed varieties, fertilizers and agricultural practices – that allow farmers to increase yields. That’s both an economic and environmental win.
The first step in doing this is for rich countries to monitor their deforestation impacts overseas more closely. They should keep their domestic reforestation targets in perspective with their net impact on global forests. Sometimes these restoration programmes pale in comparison to the deforestation they’re driving elsewhere.
95% of global deforestation occurs in the tropics. Brazil and Indonesia alone account for almost half. After long periods of forest clearance in the past, most of today’s richest countries are increasing tree cover through afforestation.
This might put the responsibility for ending deforestation solely on tropical countries. But, supply chains are international. What if this deforestation is being driven by consumers elsewhere?
Many consumers are concerned that their food choices are linked to deforestation in some of these hotspots. Since three-quarters of tropical deforestation is driven by agriculture, that’s a valid concern. It feeds into the popular idea that ‘eating local’ is one of the best ways to reduce your carbon footprint. In a previous article I showed that the types of food you eat matter much more for your carbon footprint than where it comes from – this is because transport usually makes up a small percentage of your food’s emissions, even if it comes from the other side of the world. If you want to reduce your carbon footprint, reducing meat and dairy intake – particularly beef and lamb – has the largest impact.
But, understanding the role of deforestation in the products we buy is important. If we can identify the producer countries, importing countries, and specific products responsible, we can direct our efforts towards interventions that will really make a difference.
In a study published in Global Environmental Change, Florence Pendrill and colleagues investigated where tropical deforestation was occurring; what products were driving this; and, using global trade models, they traced where these products were going in international supply chains.37
They found that tropical deforestation – given as the annual average between 2010 and 2014 – was responsible for 2.6 billion tonnes of CO2 per year. That was 6.5% of global CO2 emissions.38
International trade was responsible for around one-third (29%) of these emissions. This is probably less than many people would expect. Most emissions – 71% – came from foods consumed in the country that they were produced. It’s domestic demand, not international trade, that is the main driver of deforestation.
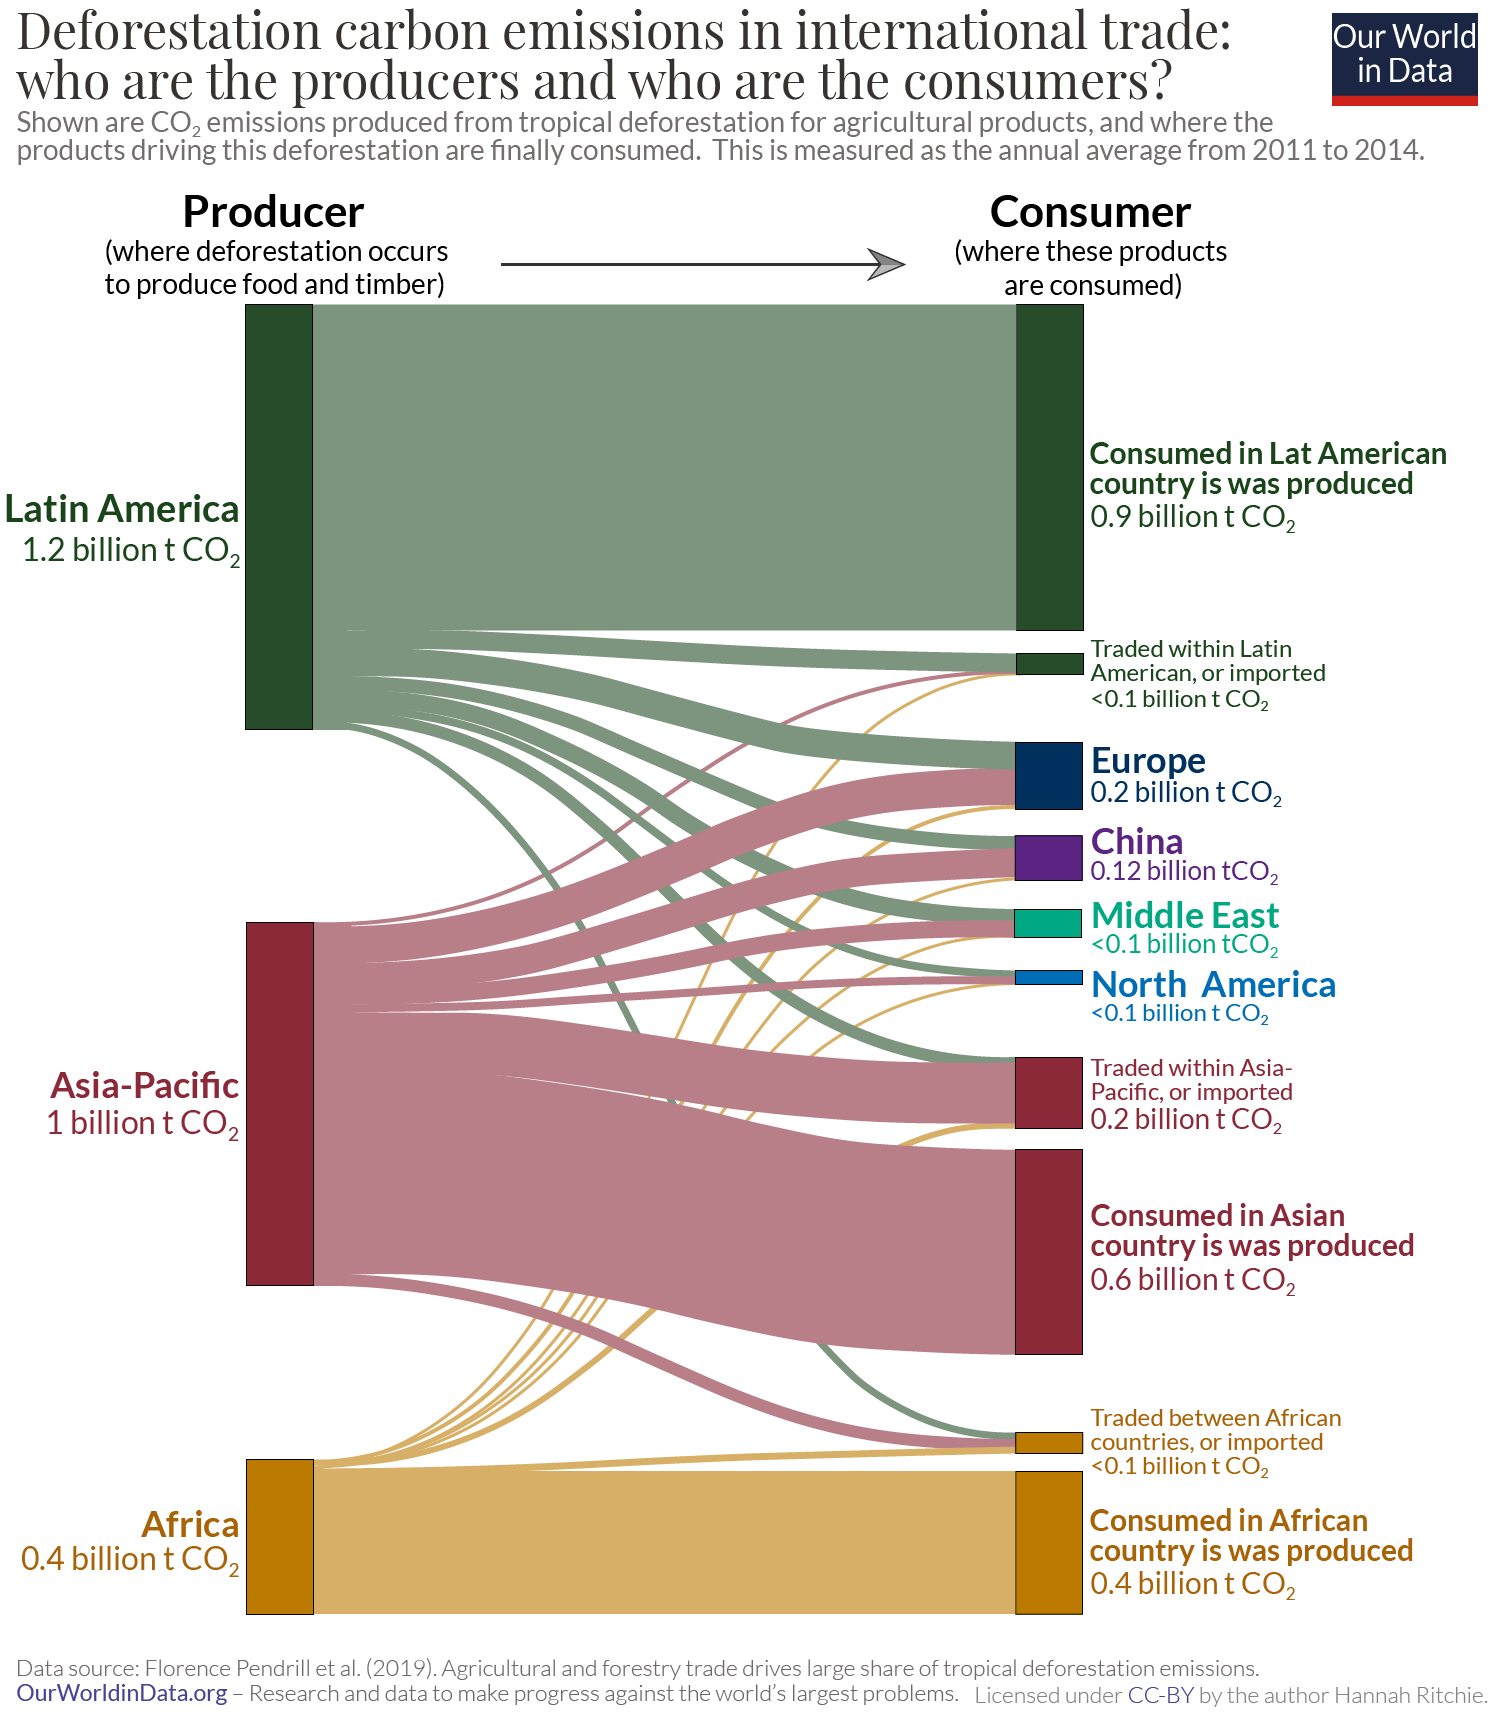
In the chart we see how emissions from tropical deforestation are distributed through international supply chains. On the left-hand side we have the countries (grouped by region) where deforestation occurs, and on the right we have the countries and regions where these products are consumed. The paths between these end boxes indicate where emissions are being traded – the wider the bar, the more emissions are embedded in these products.
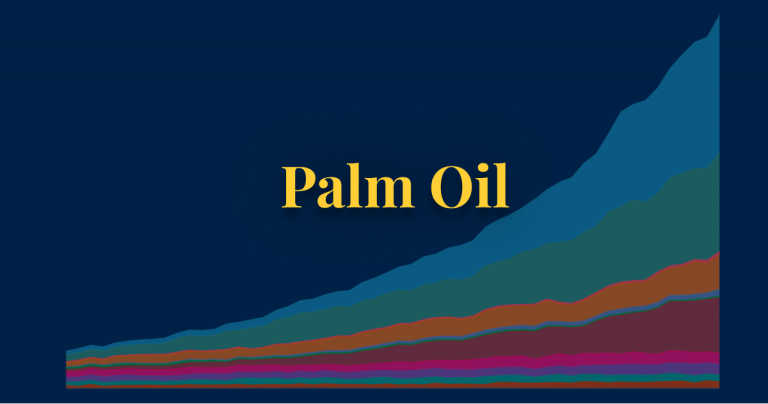
Latin America exports around 23% of its emissions; that means more than three-quarters are generated for products that are consumed within domestic markets. The Asia-Pacific region – predominantly Indonesia and Malaysia – export a higher share: 44%. As we will see later, this is dominated by palm oil exports to Europe, China, India, North America and the Middle East. Deforestation in Africa is mainly driven by local populations and markets; only 9% of its emissions are exported.
Since international demand is driving one-third of deforestation emissions, we have some opportunity to reduce emissions through global consumers and supply chains. But most emissions are driven by domestic markets – this means policies in the major producer countries will be key to tackling this problem.
Let’s now focus on the consumers of products driving deforestation. After we adjust for imports and exports, how much CO2 from deforestation is each country responsible for?
Rather than looking at total figures by country [if you’re interested, we have mapped them here] we have calculated the per capita footprint. This gives us an indication of the impact of the average person’s diet. Note that this only measures the emissions from tropical deforestation – it doesn’t include any other emissions from agricultural production, such as methane from livestock, or rice, or the use of fertilizers.
In the chart we see deforestation emissions per person, measured in tonnes of CO2 per year. For example, the average German generated half a tonne (510 kilograms) of CO2 per person from domestic and imported foods.
At the top of the list we see some of the major producer countries – Brazil and Indonesia. The fact that the per capita emissions after trade are very high means that a lot of their food products are consumed by people in Brazil and Indonesia. The diet of the average Brazilian creates 2.7 tonnes of CO2 from deforestation alone. That’s more than the country’s CO2 emissions from fossil fuels, which are around 2.2 tonnes per person.
But we also see that some countries which import a lot of food have high emissions. Luxembourg has the largest footprint at nearly three tonnes per person. Imported emissions are also high for Taiwan, Belgium and the Netherlands at around one tonne.
The average across the EU was 0.3 tonnes CO2 per person. To put this in perspective, that would be around one-sixth of the total carbon footprint of the average EU diet.39


We know where deforestation emissions are occurring, and where this demand is coming from. But we also need to know what products are driving this. This helps consumers understand what products they should be concerned about, but also allows us to target specific supply chains.
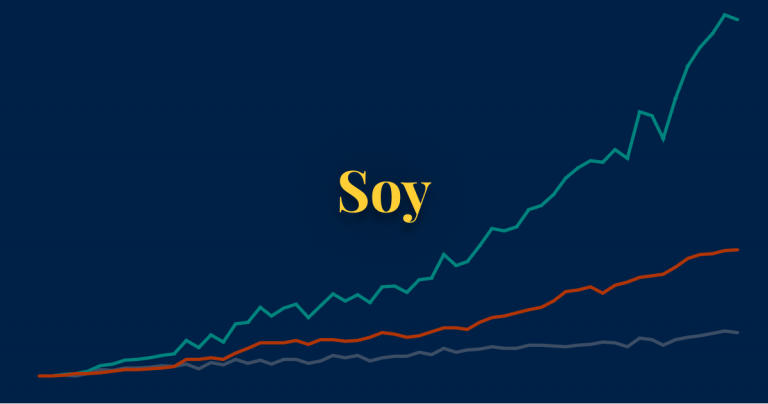
As we covered in a previous article, 60% of tropical deforestation is driven by beef, soybean and palm oil production. We should not only look at where these foods are produced, but also where the consumer demand is coming from.
In the chart here we see the breakdown of deforestation emissions by product for each consumer country. The default is shown for Brazil, but you can explore the data for a range of countries using the “Change country” button.
We see very clearly that the large Brazilian footprint is driven by its domestic demand for beef. In China, the biggest driver is demand for ‘oilseeds’ – which is the combination of soy imported from Latin America and palm oil, imported from Indonesia and Malaysia.
Across the US and Europe the breakdown of products is more varied. But, overall, oilseeds and beef tend to top the list for most countries.
Bringing all of these elements together, we can focus on a few points that should help us prioritise our efforts to end deforestation. Firstly, international trade does play a role in deforestation – it’s responsible for almost one-third of emissions. By combining our earlier Sankey diagram, and breakdown of emissions by product, we can see that we can tackle a large share of these emissions through only a few key trade flows. Most traded emissions are embedded in soy and palm oil exports to China and India; and beef, soy and palm oil exports to Europe. The story of both soy and palm oil are complex – and it’s not obvious that eliminating these products will fix the problem. We therefore look at them both individually in more detail, to better understand what we can do about it.
But international markets alone cannot fix this problem. Most tropical deforestation is driven by demand for products in domestic markets. Brazil’s emissions are high because Brazilians eat a lot of beef. Africa’s emissions are high because people are clearing forests to produce more food. This means interventions at the national-level will be key: this can include a range of solutions including policies such as Brazil’s soy moratorium, the REDD+ programme to compensate for the opportunity costs of preserving these forests, and improvements in agricultural productivity so countries can continue to produce more food on less land.