Notice: This is only a preliminary collection of relevant material
The data and research currently presented here is a preliminary collection or relevant material. We will further develop our work on this topic in the future (to cover it in the same detail as for example our entry on World Population Growth).
If you have expertise in this area and would like to contribute, apply here to join us as a researcher.
The skill premium is usually defined as the ratio of the wages of skilled to unskilled workers. If we consider the process of wage determination in the labour market, we can understand the skill premium through the lens of demand and supply. As an economy develops and new technologies emerge, the demand for skills changes. Meanwhile on the supply-side, we would expect that both the costs of, and returns to education influence an individual’s human capital investment.
All our charts on Returns to Education
Historically, the most significant changes to the skill premium took place during the Black Death, the Industrial Revolution, the Machine Age and, most recently, the information technology revolution. The advent of new technologies can reduce the demand for unskilled labour, whose tasks can be performed by machines or automated, or skilled labour whose skills become obsolete. Although technological progress can displace labour, it tends to increase real wages as the price of goods fall.
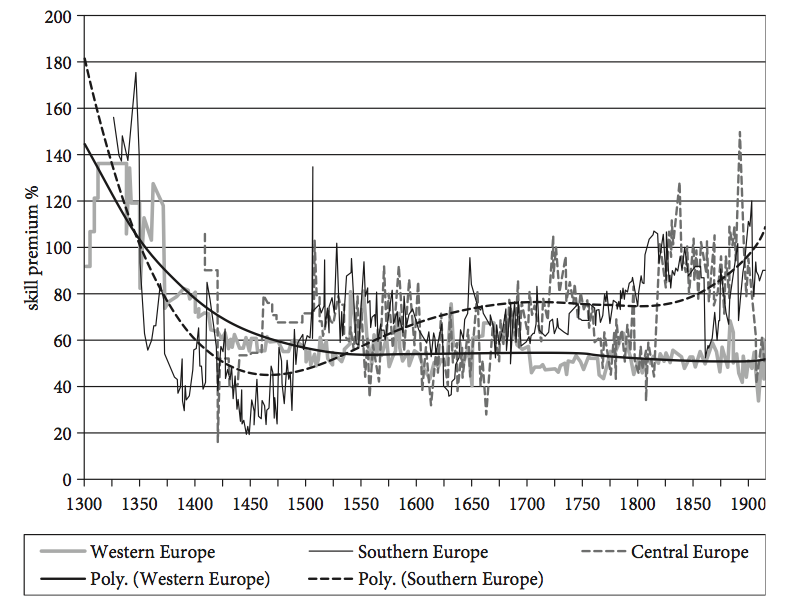
The best available data on the historical skill premium suggests that the skill premium was very high before the Black Death. Jan Luiten van Zanden attributes this decline to a fall in interest rates after the Black Death caused by the substantial drop in population levels altering the labour/land and labour/capital ratios.1
Lower interest rates induced households to increase investment in human capital, and this increase in supply caused the observed fall in the skill premium. After the decline, we see remarkable stability in the skill premium through to the 19th-20th century. The skill premium for craftsmen (carpenters) relative to labourer’s in construction remained stable at around 1.5 between the end of the Black Death and the end of the Industrial Revolution.
Note that the author defines skill premium here as “the difference between the wage of a skilled labourer (mostly a carpenter) and an unskilled labourer, divided by the wage of the unskilled labourer. For example, a skill premium of 100 means that the carpenter earns twice the wage of the unskilled labourer.”

The skill premium of craftsmen in construction in Western, Southern and Central Europe, 1300-1914 – Van Zanden (2009)2
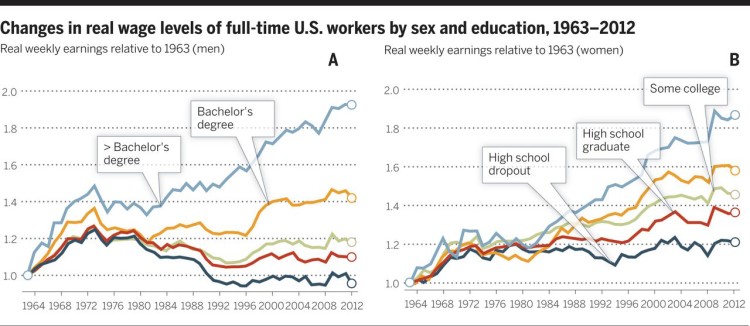
In recent years the skill premium has been increasing in the US, especially for those with advanced degrees. Less educated workers in the US saw their real wages fall between 1980 and the present day. David Autor attributes this decline to three forces: technological change, de-unionisation, and globalisation.3
Technological change has eroded demand for blue-collar production and white-collar office, clerical and administrative support. The weakening of unions has reduced the bargaining power of workers, depressing their wages, while globalisation has brought increased competition from developing economies. For more information on globalisation, click here.
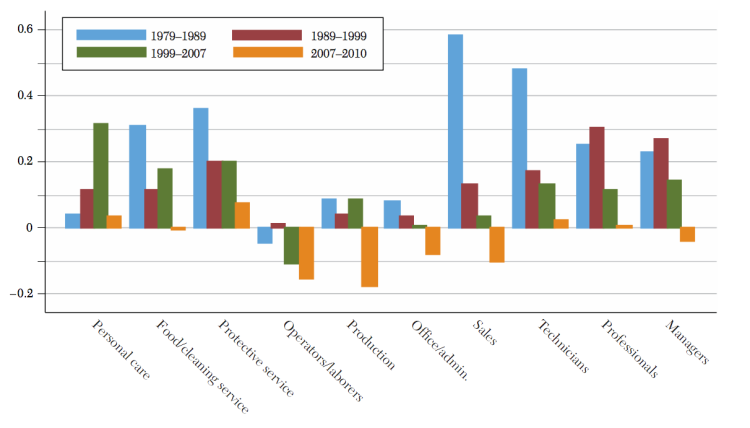
We can see this pattern in the changing composition of the labour market. In the years 1979-2010 employment growth has declined in medium skill occupations, namely, sales, office/administration, production and operators/labourers. These occupations were also the hardest hit by the recession period of 2007-2010.
Skill premium across the world
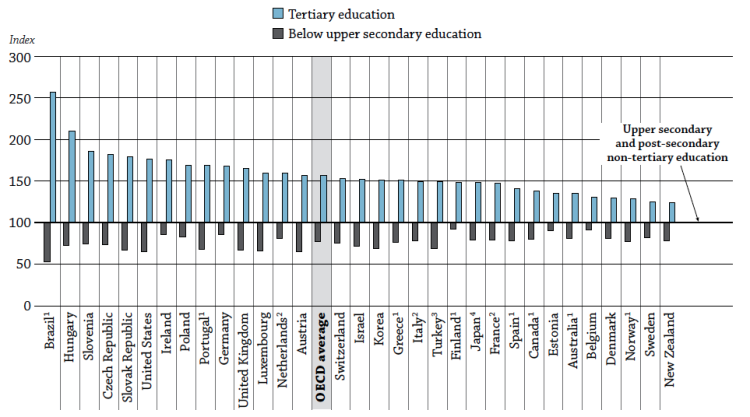
There exist differences in the value of higher education by country. Much of this can be understood through the country-specific demand and supply factors. Nevertheless, the average skill premium for the OECD measured as the relative wages of those with a university degree relative to a high school education is around 1.5.
Relative earnings from employment by level of educational attainment for 25-64 year-olds (2009 or latest available year) (upper secondary and post-secondary non-tertiary education = 100) – OECD (2012)6
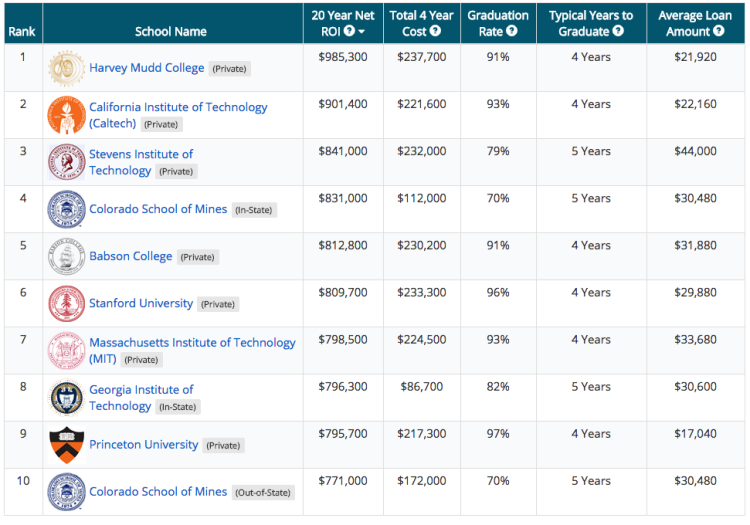
Unsurprisingly, the value of a degree is tied to the institution and specialisation. The precise effect the particular institution or specialisation has on earnings is difficult to estimate since universities are academically selective and student self-select into different degree programmes and careers. Computer science majors at Stanford can expect 20 year return on investment of $1,619,700, meanwhile some universities have a negative estimated return on investment.
2015 College Return on Investment Report: Best Value Colleges in the US – PayScale7
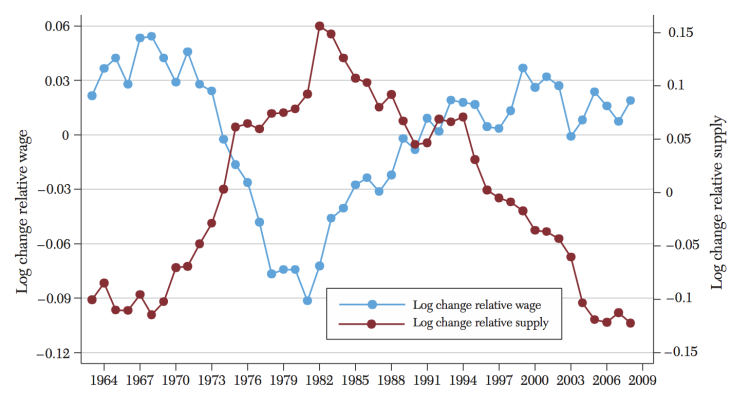
There is a strong association between the relative supply of skilled to unskilled workers and the skill premium. It should come as no surprise that an increase in the supply of skilled workers, all other things being equal, should depress the wages of skilled workers, and hence lower the skill premium. In the following chart the (log) change in relative supply and (log) change in relative wage of college graduates to high school graduates is plotted showing the inverse relationship.
The following scatter plot highlights this supply effect for the OECD economies. There is a clear negative correlation between the proportion of tertiary/university educated individuals and the skill premium of degree holders over high school graduates.
Detrended Changes in College–High School Relative Supply and Relative Wages for the US, 1963-2008 – Acemoglu and Autor8

Prior to the Industrial Revolution, consumer goods were primarily produced by skilled artisans. The advent of labour saving technologies in textile manufacture brought about by the Industrial Revolution in England threatened the livelihoods of skilled textile workers. The new technologies meant that the work of an artisan could be divided into smaller tasks and completed by unskilled labourers operating machines. Those opposed to these labour saving technologies became known as Luddites. In response to the increasing protests, Parliament introduced harsh penalties for the breaking of mechanised looms.9 Unskilled agricultural workers were also affected by the new technologies of the Industrial Revolution. The introduction of threshing machines significantly reduced the demand for labour and led to the Swing Riots of 1830 across England.
Over the last century technology has made more professions obsolete. Typists have been replaced by computers and printers and telegraphists were made obsolete by the internet. Nevertheless, protesting labour-saving technologies has persisted into the modern day. More recently, taxi drivers around the world have protested against the rise of Uber and other technologies that have disrupted their business models. In London, black cab drivers have to learn the Knowledge of London and pass famously difficult exams to obtain their licenses; modern GPS has made this intricate knowledge of London’s streets redundant. Tube staff in London have strongly resisted the introduction of ticket machines and driverless trains.
In this section the skill premium is defined as the wage ratio of skilled to unskilled labour unless otherwise stated.
It is important to note that the long-run data presented on the skill premium is not directly comparable with the contemporary data. The historical data from Clark and van Zanden is primarily constructed from the wages of carpenters and labourers. For this reason, it is not possible to make more general statements about the skill premium that existed in other industries, or exactly what the returns to education were during this time.
- Data: Comprehensive data on enrollments, out-of-school children, repetition, completion, gender, teachers, education expenditures, learning outcomes, educational attainment, education equality, literacy, population, labor, and EMIS.
- Geographical coverage: Global by country
- Time span: 1999-2015
- Available at: http://data.uis.unesco.org/
- Data: indicators on educational attainment, enrolment, attendance, teachers, financing and more
- Geographical coverage: Global, over 200 countries
- Time span: 1970 to most recent data year; Projections to 2050
- Available at: It is online here
- Data: Historical skill premium and real wages
- Geographical coverage: England
- Time span: 1200-2000
- Available at: Available online here.
- Clark, Gregory. “The condition of the working class in England, 1209–2004.” Journal of Political Economy 113, no. 6 (2005): 1307-1340.
- Data: Data on the state of education around the world; outcomes, financial and resource investment, access and participation, and the learning environment
- Geographical coverage: 34 OECD countries and additional partners
- Time span: 1998-2014
- Available at: Available online here.