How much money would we need to transfer to poor households in order to end extreme poverty? Answering this question is difficult because redistributive transfers typically entail inefficiencies. First, transfers are hard to target (it is hard to reach the desired population); and second, transfers have knock-on effects on economic behaviour (transfers change incentives and therefore may affect, among other things, baseline income levels).
One way to get a broad sense of the cost of ending poverty is hence to simplify matters, and suppose that we could rely on non-distortionary perfectly-targeted transfers: How much money would we need then to lift the incomes of all poor people up to the global poverty line of $1.90 a day?
This blog post takes this question seriously.
The short answer is that we’d need around 160 billion ‘international dollars’ per year to close the global poverty gap, according to 2013 figures (the latest year for which we have good data). To give you a rough idea of the order of magnitude of this number, the equivalent figure in market dollars is about 90 billion – much less than, for example, the yearly military expenditure of the US ($600 billion as I show below).
The monetary size of the global poverty gap is of course a lower bound to the actual cost of ending poverty, since transfers are likely to entail inefficiencies and administrative costs in practice. But taking these numbers seriously is still worthwhile: they tell us that in recent years we have substantially reduced both the incidence and the intensity of poverty. Ending extreme poverty is very much within our reach.
What’s the poverty gap and why should we care about it?
The most straightforward way to measure poverty is to set a poverty line and to count the number of people living with incomes or consumption levels below that poverty line. This is the so-called poverty headcount ratio.
Measuring poverty through the headcount ratio provides information that is straightforward to interpret; by definition, it tells us the share of the population living with consumption (or incomes) below some minimum level.
Unfortunately, measuring poverty through headcount ratios fails to capture the intensity of poverty – individuals with consumption levels marginally below the poverty line are counted as being poor just as individuals with consumption levels much further below the poverty line.
The most common way to deal with this is to measure the intensity of poverty, by calculating the amount of money required by a poor household in order to reach the poverty line. In other words, the most common approach is to calculate the income or consumption shortfall from the poverty line.
To produce aggregate statistics, the sum of all such shortfalls across the entire population in a country (counting the non-poor as having zero shortfall) is often expressed in per capita terms. This is the mean shortfall from the poverty line.
The ‘poverty gap index’ – a common statistic routinely estimated by the World Bank – takes the mean shortfall from the poverty line, and divides it by the value of the poverty line. It tells us the fraction of the poverty line that people are missing, on average, in order to escape poverty.
The poverty gap index is often used in policy discussions because it has an intuitive unit (per cent mean shortfall) that allows for meaningful comparisons regarding the relative intensity of poverty. But given that the poverty line is very low, and some countries have more poor people than others, it’s often easy to lose perspective on the actual absolute magnitude of the numbers we are dealing with.
Here I want to show the evolution of both the poverty gap index, and the absolute size of the poverty gap (i.e. the absolute value, in international dollars, of closing the poverty gap).
The poverty gap index, country by country
The following map shows the poverty gap index, country by country. As we can see, there is a clear positive correlation between the incidence of poverty and the intensity of poverty: sub-Saharan Africa, where the share of people below the poverty line is higher, is also the region where people tend to be furthest below the poverty line.
Interestingly, the correlation is very strong, but is far from perfect. For example, India and Bolivia have relatively similar poverty gaps (mean shortfall is close to 4% of the poverty line), but they have very different poverty rates (the share of population in poverty in India is 21%, while in Bolivia it is 7.7%). This can be appreciated in a scatter plot of poverty headcount rates vs. poverty gap indices. The fact that the correlation is not perfect justifies the discussion below. The intensity of poverty contains information that is not captured by the poverty headcount rate.
The following two visualization show the absolute yearly value of the poverty gap, for the world (top chart) and country by country (bottom chart). Estimates are expressed in international dollars (int.-$) using 2011 PPP conversion rates. This means that figures account for different prices levels in different countries, as well as for inflation.
These estimates were obtained by applying reverse engineering to the poverty gap index figures published by PovcalNet – an interactive computational tool for poverty measurement developed by the Development Research Group of the World Bank. There is a technical note at the end of this blog post explaining the methodology in more detail.
As can be seen, the yearly cost of closing the global poverty gap today is about half of what it was a decade ago. The total amount of resources required to end extreme poverty across the world is getting smaller and smaller.
This very positive development is largely, but not exclusively driven by the remarkable improvements in China. You can read more about the ‘Chinese effect’ on global poverty reductions in our last blog post here.
In the bottom chart, you can also explore trends country by country by clicking on the ‘chart’ tab. While in most cases there is a downward trend, in some countries, such as Nigeria, the size of the poverty gap has been growing. (When adding or removing countries from the chart view bear in mind that, in levels, there are huge cross-country differences; so including countries such as India will stretch the scale).
Some perspective on the cost of ending extreme poverty
The estimates above show that the yearly amount of money required to close the poverty gap is close to 160 billion int.-$. As mentioned before, this is a rough approximation of the cost of ending extreme poverty if we use efficient redistributive mechanisms.
Is this number large? The question is not trivial, since the unit is rather abstract – international dollars are a helpful theoretical construct for cross-country comparisons, but they remain a hypothetical currency. How much is the global poverty gap in market dollars?
Using the same underlying data, they find that the 160 billion int.-$ gap for 2013, amounts to about 90 billion market dollars (in 2015 prices).2
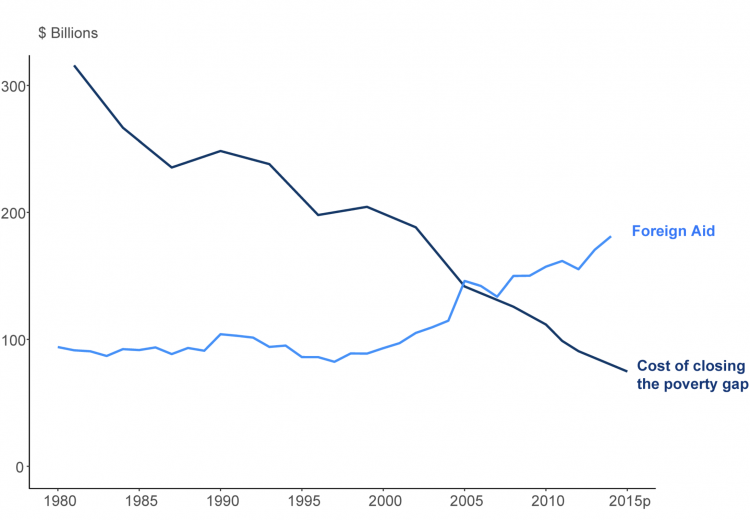
So, how much are 90 billion market dollars? It’s less than the global value of foreign aid flows, estimated by Chandy et al. at around 150 billion market dollars for the same year. The visualization below shows the results from this benchmarking exercise in more detail.
Other benchmarks are also helpful to grasp the dimensions of these numbers. 90 billion market dollars are much less than, for example, the latest figure of US military spending, estimated at nearly 600 billion market dollars for 2015.
90 billion market dollars is also not a huge number when compared to the net worth of billionaires. Chandy et al. compare the value of national poverty gaps to the net worth of billionaires in each country, and conclude that “In each of three countries – Colombia, Georgia, and Eswatini – a single individual’s act of philanthropy could be sufficient to end extreme poverty with immediate effect.”
Annual cost of closing the global poverty gap, and official foreign aid, in constant 2015 market dollars, 1981-2015 – Chandy et al. (2016)3
Technical notes:
The poverty gap index is defined as the mean shortfall in income (or consumption) from the poverty line, expressed as a percentage of the poverty line. That means that if you multiply a country’s poverty gap index by both the poverty line and the total number of individuals in the country, you get the absolute monetary value of that country’s poverty gap. We constructed all estimates this way, using the International Poverty Line (1.90 int.$) and the poverty gap index estimates from the World Bank’s PovcalNet data.
The poverty gap index estimates from the World Bank’s PovcalNet data cover low and middle income countries, with observations every three years in the period 1981-2013. To achieve this level of granularity, the World Bank relies on interpolation for countries in which survey data are not available in particular years, but are available either before or after (or both). The process of interpolation requires adjusting the mean income or expenditure observed in the survey year by a growth factor to infer the unobserved level in the missing year. You can read more about this process in http://iresearch.worldbank.org/PovcalNet/methodology.aspx.
It should be noted that adding the absolute monetary value of the poverty gaps across all countries with available data in Povcal, yields a global total that is slightly smaller than what Povcal reports as the global total. This is because some countries in the Middle East and North African region do not have data, but are included in the global total. Povcal explains this as follows: “As a compromise between precision and coverage, the regional poverty totals and headcount ratios are not reported for the Middle East and North Africa, but an estimate of the number of the poor is included in the global total (based on regression-based PPPs and 2011 PPPs, depending on the country).”
Finally, it is also important to note that we have found a discrepancy between the global poverty gap index reported in PovcalNet, and the global poverty gap index reported in the World Development Indicators (WDI); and this is despite the fact that WDI lists PovcalNet as its source. The discrepancy seems to stem from the reference population that is used to calculate the mean shortfall in each case.4