Notice: This is only a preliminary collection of relevant material
The data and research currently presented here is a preliminary collection or relevant material. We will further develop our work on this topic in the future (to cover it in the same detail as for example our entry on World Population Growth).
If you have expertise in this area and would like to contribute, apply here to join us as a researcher.
All our charts on Technological Progress
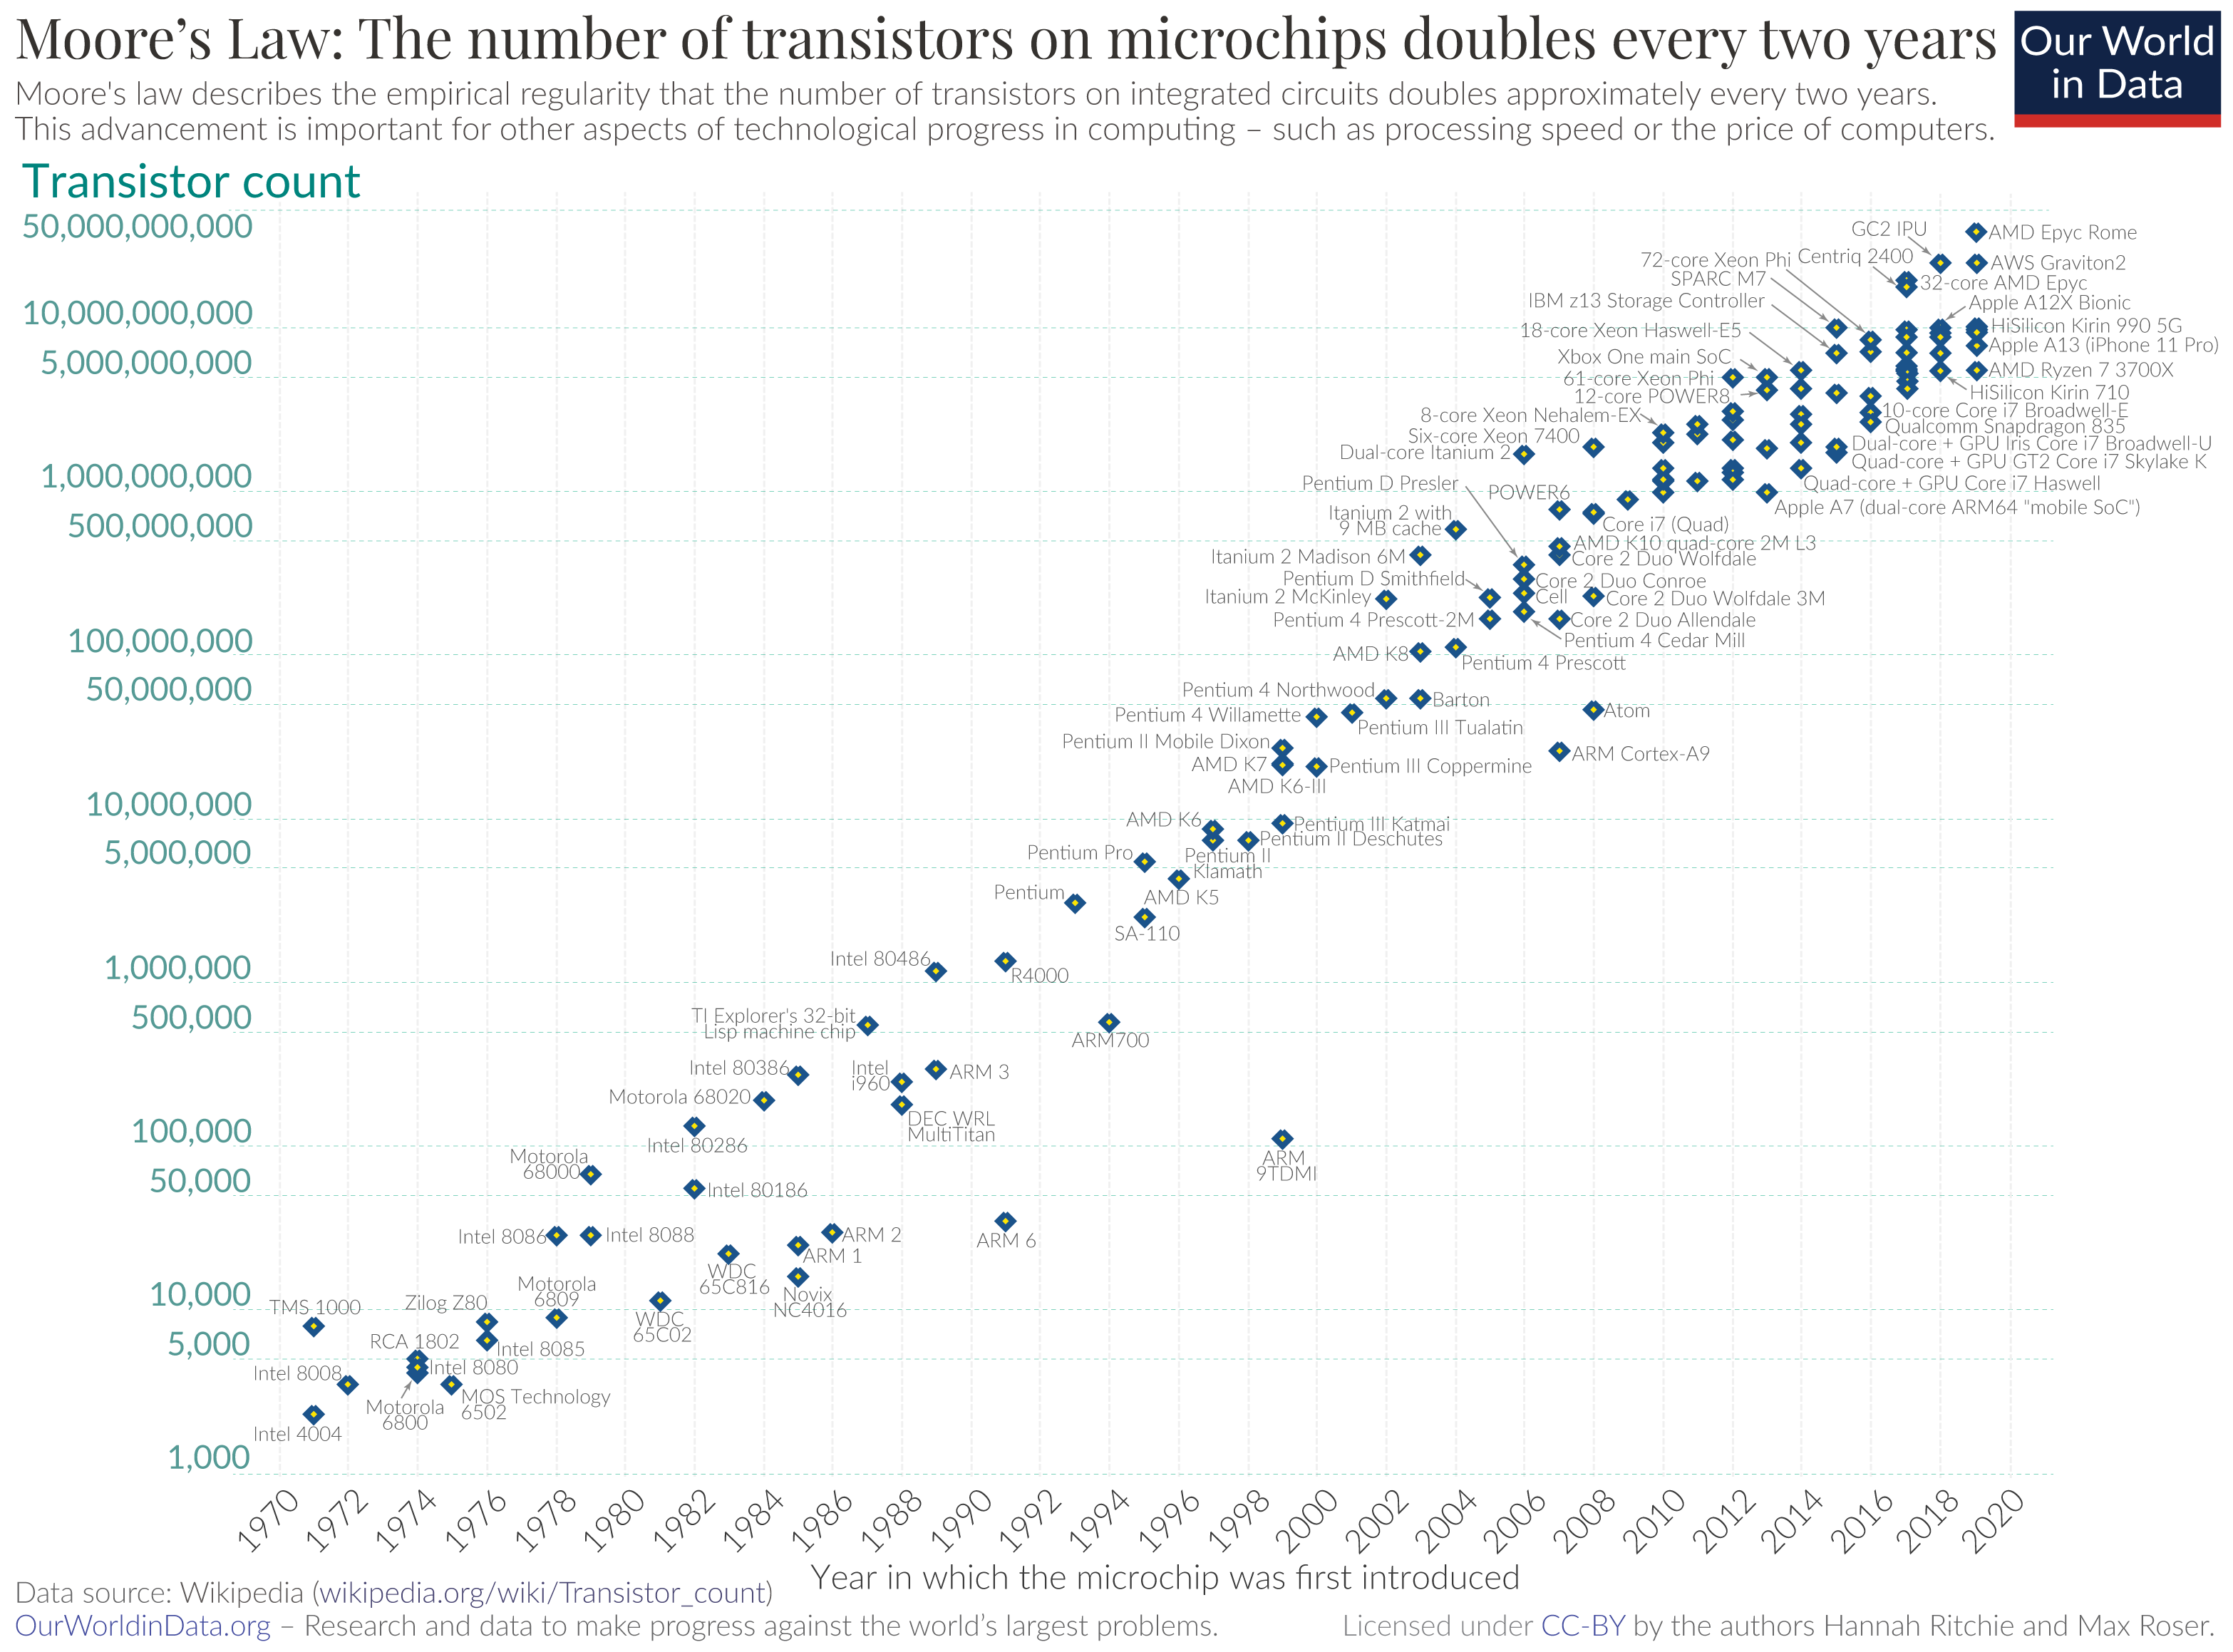
Moore’s Law is the observation that the number of transistors on integrated circuits doubles approximately every two years. This aspect of technological progress is important as the capabilities of many digital electronic devices are strongly linked to Moore’s Law. Below I will show how aspects as diverse as processing speed, product price, memory capacity, and even the number and size of pixels in digital cameras have also been progressing exponentially.
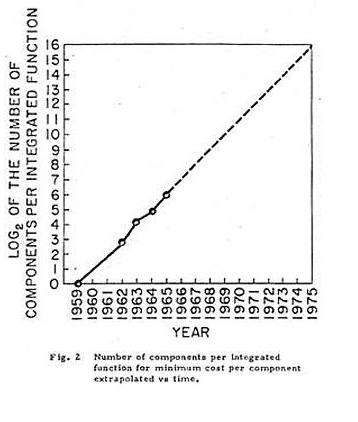
The law was described as early as 1965 by the Intel co-founder Gordon E. Moore after whom it is named.1 Below you find the famous little graph that Moore published in 1965. As you can see, Moore had only seven observations from 1959 until 1965, but he predicted a continuing growth saying, “There is no reason to believe it will not remain nearly constant for at least 10 years”.2
As our large updated graph here shows, he was not only right about the next ten years but astonishingly the regularity he found is true for more than half a century now.
Note the logarithmic vertical axis chosen to show the linearity of the growth rate. The line corresponds to exponential growth with the transistor count doubling every two years.
Moore’s Original Graph: ‘The Number of Components per Integrated Function’ – Intel3

Other laws of exponential technological progress
In the following, I show that technological developments in many respects are growing exponentially. Moore’s early observation is important as it showed that technological advances do not progress linearly but exponentially. But in and of itself, the doubling of transistors every two years does not directly matter in our lives. Therefore, I ask in which ways the exponential growth of technology matters and will give an overview of how the exponential technological advancement is a driver of technological and social change that very much matters for our lives now.
More importantly for us is that the power and speed of computers increased exponentially; the doubling time of computational capacity for personal computers was 1.5 years between 1975 and 2009. The increasing power of a wider range of computers — starting with the first general purpose computer (ENIAC) in 1946 — is shown in the black and white chart.
We also show this series in interactive form, updated to the year 2020. Here, the growth of supercomputer power is measured in terms of the number of floating-point operations carried out per second (FLOPS) by the largest supercomputer in any given year. FLOPS are a measure of calculations per second for floating-point operations. Floating-point operations are needed for very large or very small real numbers, or computations that require a large dynamic range. It is therefore a more accurate measured than simply instructions per second.
Exponentially increasing computational capacity over time (computations per second) – Koomey, Berard, Sanchez, and Wong (2011)4


Whilst some technological change follows a continued linear progression, many of the technological innovations we see follow a non-linear pathway. This non-linearity is observed most clearly in examples which show rapid evolution following an important enabling innovation. Below we have included two examples of such trends: the take-off of human flight, and the sequencing of the human genome.
Progress in human flight
This chart shows the global distance record set by non-commercial flights since 1800. This record represents the maximum distance a non-commercial powered aircraft has traveled without refueling. We see that prior to 1900, humans had not yet developed the technology necessary to enable powered flight. It wasn’t until 1903 that the Wright Brothers were able to engineer the first powered flying technology. This initial innovation sparked continued, rapid progress in modern aviation, with the record distance increasing nearly 150,000-fold from 0.28 kilometers in 1903 to just under 41,500 kilometers in 2006.
This provides one examples of non-linear evolution of technological change: a single enabler shifted us from a civilization unable to fly, to one which could. Progress in aviation — and space exploration — has been rapid since.

Progress in human genome DNA sequencing
Another example which demonstrates this non-linear progress is the field of human genome DNA sequencing.5 The Human Genome Project (HGP), which aimed to determine and map the complete set of nucleotide base pairs which make up human DNA (which total more than three billion) ran over 13 years from 1990-2003. This initial discovery and determination of the human genome sequence was a crucial injection point in the field of DNA sequencing.
As reported by the NHGRI Genome Sequencing Program (GSP), the cost of sequencing DNA bases has fallen dramatically (more than 700,000-fold) since the completion of the first sequencing project. Note that this costing refers to the price of raw base pairs of DNA sequence; the cost of producing the full human genome is higher than the sum of 30 million base pairs would suggest. This is because some redundant sequence coverage would be necessary to complete and assemble the full genome. Nonetheless, this rapid decline in cost is also observed in prices for the sequencing of a complete human genome.
This can also be observed in another way: in this chart, we have plotted the number of human genome base pairs which can be sequenced for one US$. In the early 2000s, we could sequence in the order of hundreds of base pairs per US$. Since 2008, we have seen a dramatic decline in the cost of sequencing, allowing us to now produce more than 133 million base pairs per US$.

Increasing product quality for a decreasing price
Increasing computational power – and increasing product quality – matters indeed more than a mere doubling of transistors. But if the technologically-advanced products are prohibitively expensive then they can only have a limited impact on the whole society. For this reason, it is interesting to look at both the product quality and the price. The author and inventor Ray Kurzweil analyzed the change of price and quality for computing machines since 1900. He not only analyzed the improvements of integrated circuits but also looked at the predecessors – earlier transistors, vacuum tubes, relays and electromechanical computers. What he found is that Moore did not only make a valid prediction of the future, but his description is also valid for the past! The exponential growth rate that Moore picked up in the 1960s was driving technological progress since the beginning of the century.
This graph shows the computer power that consumers could purchase for a price of $1000. It is especially insightful if one wants to understand how technological progress mattered as a driver of social change.
The extension of the time frame also makes clear how our modern computers evolved. It is an insightful way of understanding that the computer age really is the successor to the Industrial Revolution.
One could also view the previous graph as a function of price instead of calculations per second; in this view you would find an exponentially decreasing price for a given product quality over 110 years.
The implication of this rapid simultaneous improvement in quality and decrease of the product price is that, according to a detailed discussion on reddit (here), a current laptop (May 2013) has about the same computing power as the most powerful computer on earth in the mid 1990s.
Calculations per second per $1000 – exponential growth of computing for 110 years – Kurzweil6

Prices of consumer durables
In the chart shown we see the price changes in goods and services in the United States from 1997-2017, measured as the percentage price change since 1997. Positive values indicate an increase in prices since 1997, and negative values represent a price decline. Here we see a distinct divide between consumer durables and technologies (which have typically seen a price decline), and service-based purchases (which have increased in price).
A combination of industrial offshoring, technological innovation and economies of scale have resulted in a price decline in goods such as televisions (-96% since 1997), software (-67%), toys (-69%), and clothing (-4%). In contrast, the prices of goods and services such as education, childcare, medical care, and housing have increased significantly, rising by 150%, 110%, 100% and 58%, respectively.
The observed rise in costs of services may be partly attributed to the so-called ‘Baumol’s cost disease‘, which is an important exception from the general regularity that the pay for labor – the wage – reflects the productivity of labor. Baumol’s cost disease describes the phenomenon whereby wages rise in jobs which have experienced little improvements in labor productivity in order to compete with salaries in other sectors.
Examples of service-based roles such as nursing, healthcare, childcare and education have experienced little productivity growth relative to manufacturing sectors which have seen continued improvements through technological innovation. In order to retain employees in service-based roles, salaries have risen in order to remain competitive with industrial sectors; this increase in pay has occurred despite minimal gains in productivity. This may in part explain why the cost of education, healthcare and other services have risen faster than the general rate of inflation.

Exponential increase in computing efficiency
The cost to keep the machine running also matters. Electrical efficiency measures the computational capacity per unit of energy, and it is also important with respect to the environmental impact that energy production has.
The progress in this respect has been tremendous: researchers found that over the last six decades the energy demand for a fixed computational load halved every 18 months.7
In this chart we see the computing efficiency of various processors over time. Here, computing efficiency is measured as the number of watts (a measure of electrical power) needed to carry out a million instructions per second (Watts per MIPS).

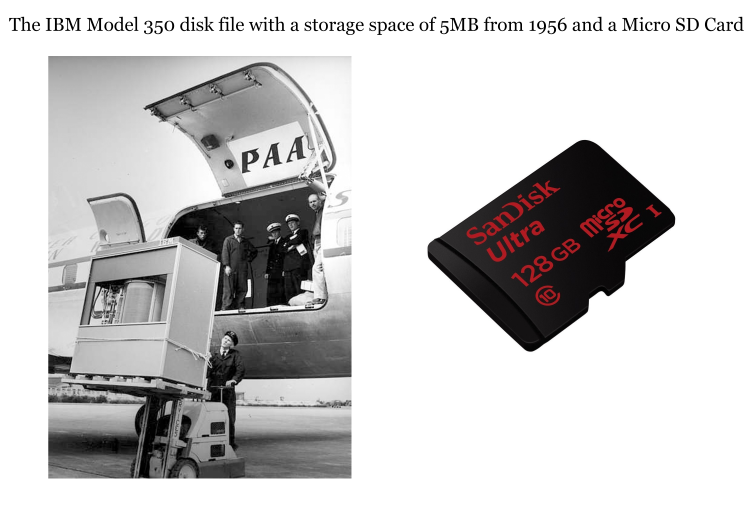
Costs of computer storage
Looking at these two picturesit becomes immediately clear how fast technological progress increased the storage capacity. The left image is a hard disk from 1956 with a storage of 5MB on the right is a cheap modern Micro SD Card that stores as much as 12 800 of the old IBM drive.
Considering the time since the introduction of the IBM 350 in 1956, the growth rate of storage capacity has not been as constant as for the other measures discussed before. Early on, technological revolutions boosted the capacity stepwise and not linearly. Yet for the time since 1980, progress has been very steady and at an even higher rate than the increase of computer speed – as shown in the chart here.

The price and quality of digital cameras
Exponentially advancing technological progress can not only be found in computing machines. Cameras are a different example: for a given price consumers can buy cameras with more and more pixels. The number of pixels has again exponentially increased, as seen in the graph here.
Exponential growth of pixels per Australian dollar, 1994-2005 – Wikipedia10
The exponential growth rates that we have observed over the last decades seem to promise more exciting technological advances in the future.
Many other types of technology have seen exponential growth rates beyond the ones discussed above. A couple of exceptionally promising examples are: Butters’ Law of Photonics and Rose’s Law. Butters’ Law says the amount of data one can transmit using optical fiber is doubling every nine months, which you can convert and say that the cost of transmission by optical fiber is halving every nine months. Rose’s Law describes the exponential growth of the number of qubits of quantum computers. If this growth rate should remain constant, it leads to some mind-bending opportunities.11
Number of digits in the largest known prime since computers started looking for them, 1952-2008 – Wikipedia12
