Education systems around the world have expanded significantly over the last fifty years. This is true both in terms of funding and outcomes: in most countries education expenditure and mean years of schooling have increased.
What has this implied in terms of education inequality?
The short answer is that in most countries education is much more equally distributed today than fifty years ago.
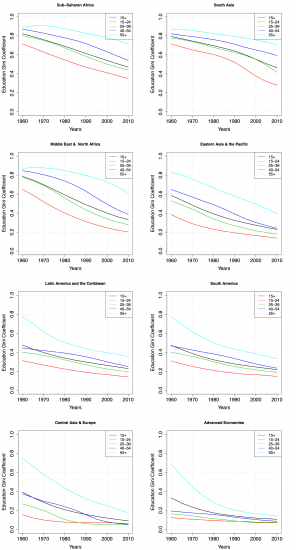
The figure, from Crespo Cuaresma et al. (2013)1, shows a series of graphs plotting changes in the Gini coefficient of the distribution of years of schooling, by age groups, across different world regions. The Gini coefficient is a measure of inequality, with higher values denoting higher inequality.
As it can be seen, in the period 1960-2010 education inequality went down every year, for all age groups and in all world regions.
In fact, notice that inequality is lower among today’s younger generations – this implies that further reductions in education inequality are still to be expected, particularly within developing countries where the generational gap is largest; and if the expansion of global education can be continued, we can get closer to global convergence.
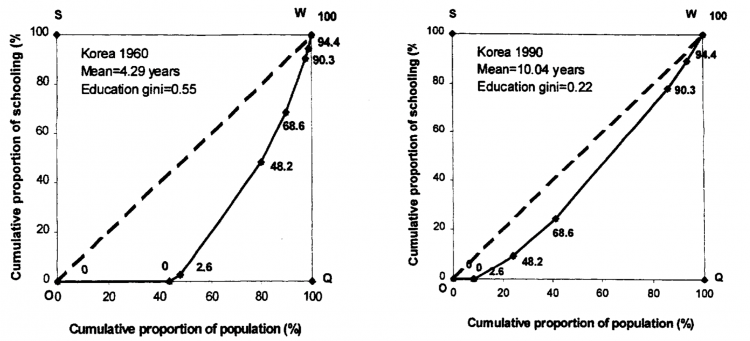
The experience of South Korea shows that it is possible to reduce education inequality very rapidly, across all levels of education.
The following visualization shows two graphs comparing the concentration of years of education in South Korean between the years 1960 and 1990. To be precise, each of these graphs shows an ‘education Lorenz curve’: a plot showing the cumulative percentage of the schooling years across all levels of education on the vertical axis, and the cumulative percentage of the population on the horizontal axis.3
As it can be seen, in 1990 education was much less concentrated than in 1960, not only because there was a smaller share of individuals without schooling at the bottom (in 1990 only 10% of the population had no schooling, compared to 40% in 1960), but also because there was a smaller share of individuals concentrating large proportions of school-years at higher levels of education. Indeed, in only 30 years South Korea was able to double the mean years of schooling and get remarkably close to the 45-degree line marking the hypothetical scenario of complete equality of schooling. In this same period South Korea increased drastically its GDP per capita while significantly improving health outcomes, such as child mortality.
→ We discuss this in more detail in our entry on Financing Education.