Every year the world loses around 5 million hectares of forest. 95% of this occurs in the tropics. At least three-quarters of this is driven by agriculture – clearing forests to grow crops, raise livestock and produce products such as paper.1
If we want to tackle deforestation we need to understand two key questions: where we’re losing forests, and what activities are driving it. This allows us to target our efforts towards specific industries, products, or countries where they will have the greatest impact.
In a study published in Global Environmental Change, Florence Pendrill and colleagues addressed both of these questions.2 They quantified how much and where deforestation occurs from the expansion of croplands, pasture and tree plantations (for logging), and what products are grown on this converted land. They also combined this with global trade flows to assess how much of this deforestation was driven by international trade – we look at the role of trade specifically in a related article.
Here we’ll look at both where tropical deforestation is happening and what products are driving it.
The study by Pendrill et al. (2019) found that, between 2005 and 2013, the tropics lost an average of 5.5 million hectares of forest per year to agricultural land. That was a decade ago, but the world is still losing a similar amount today: using satellite data, researchers at Global Forest Watch estimate that global deforestation in 2019 was around 5.4 million hectares.3 95% of this was in the tropics. But where in the tropics did we lose this forest?
In the chart we see the share of tropical deforestation by country and region. It’s measured as the annual average between 2010 and 2014.
One-third of tropical deforestation happened in Brazil. That was 1.7 million hectares each year. The other single country where large forest areas are lost is Indonesia – it accounted for 14%. This means around half (47%) of tropical deforestation took place in Brazil and Indonesia. Again, if we look at more recent satellite data we find that this is still true today: in 2019, the world lost 5.4 million hectares to deforestation, with Brazil and Indonesia accounting for 52% of it.4 As we will see later, the expansion of pasture for beef production, croplands for soy and palm oil, and increasingly conversion of primary forest to tree plantations for paper and pulp have been the key drivers of this.
The expansion of pasture lands have also had a major impact on land use in the rest of the Americas – outside of Brazil, Latin America accounted for around one-fifth of deforestation.
The expansion of agricultural land in Africa accounted for around 17.5% of deforestation. This may slightly underestimate the loss of forests in Africa, for two reasons. Much of Africa’s deforestation has been driven by subsistence agricultural activities, which are not always fully captured in national statistics. Secondly, depending on the permanence of agricultural activities such as slash-and-burn farming, some of this forest loss might be classified as temporary forest degradation rather than permanent deforestation.


If we want to tackle deforestation we also need to know what causes it. That allows us to avoid the foods that drive deforestation or innovate the ways we produce them.
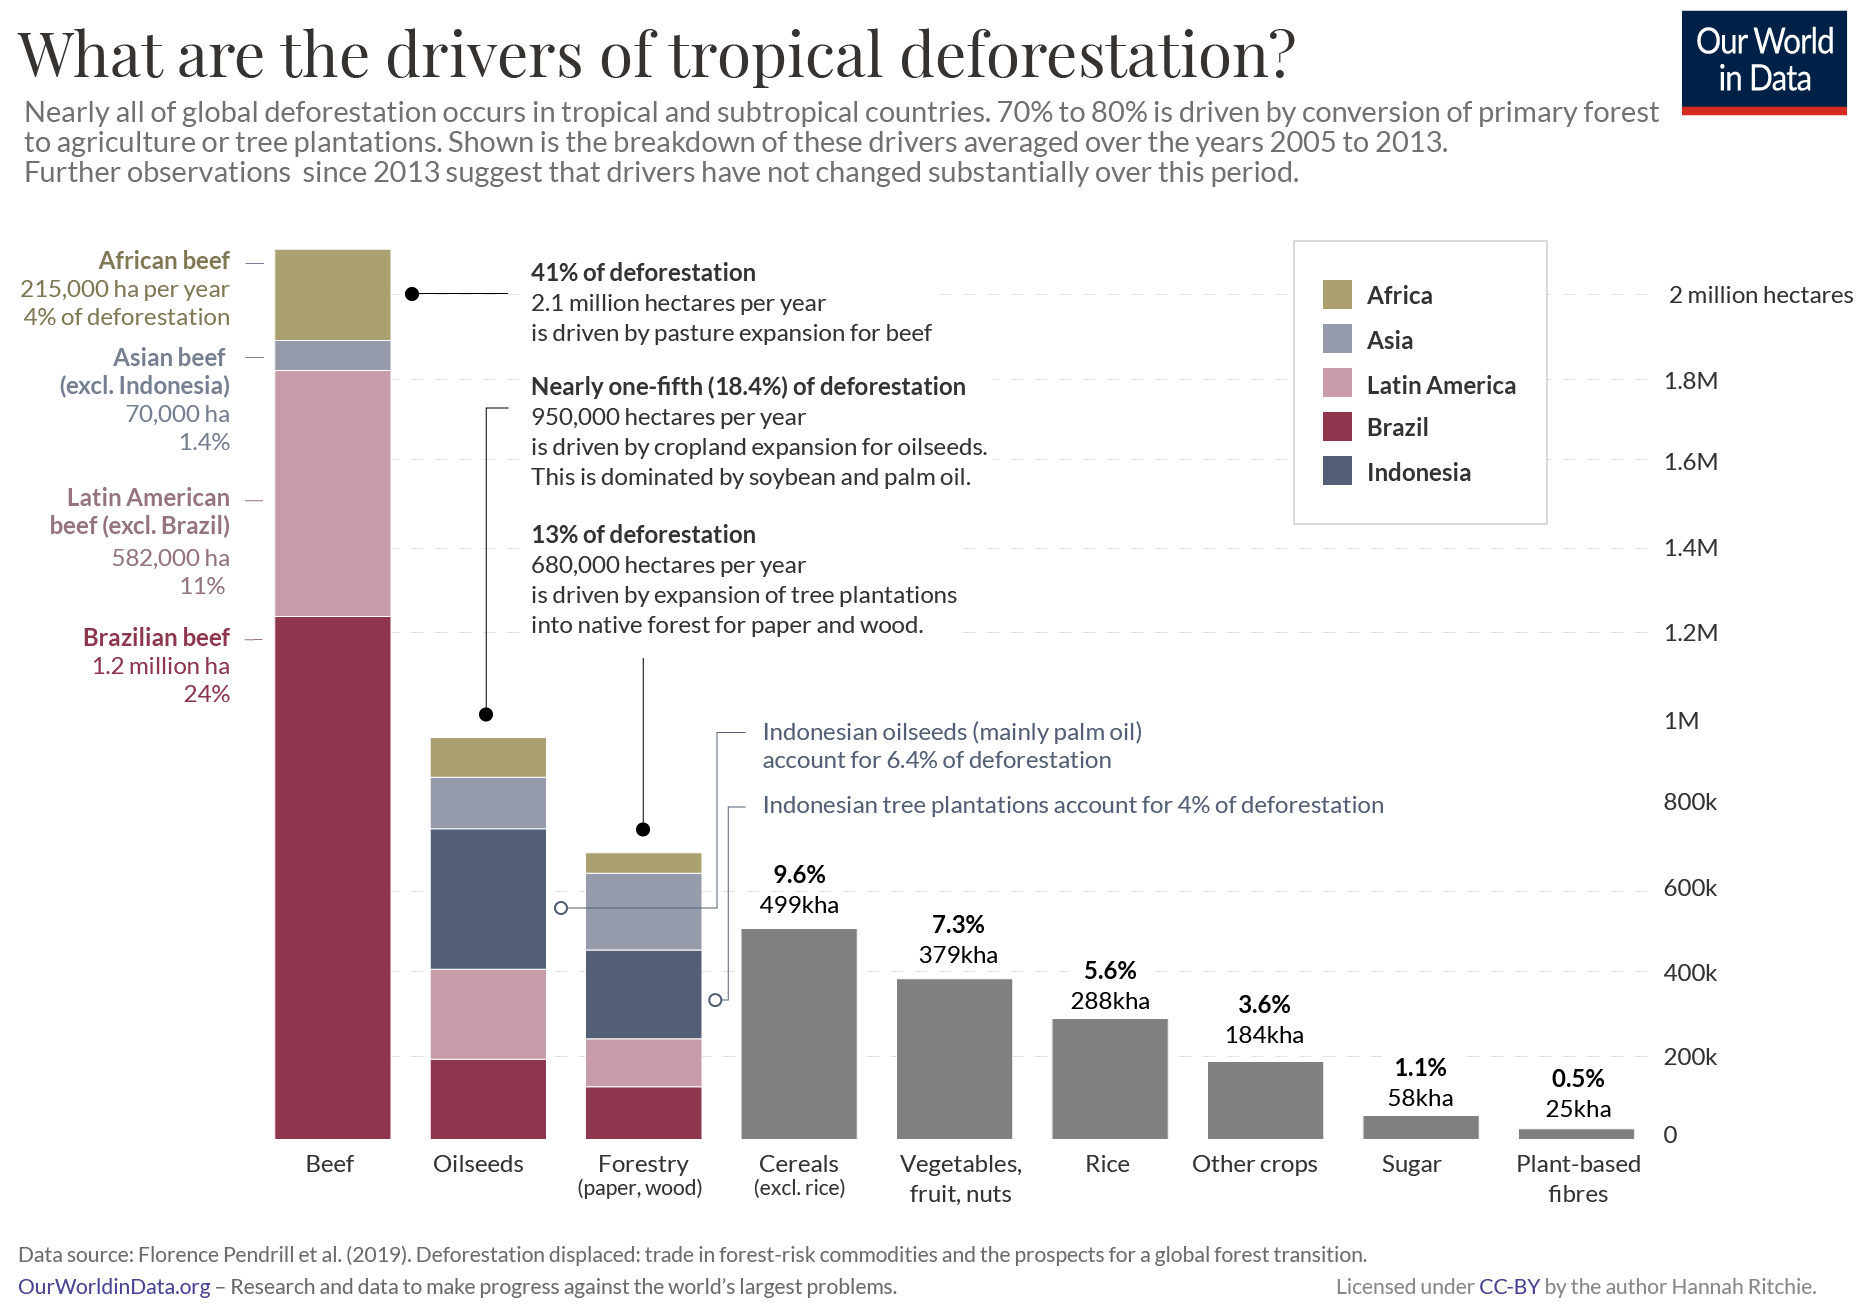
In the chart here we see the breakdown of tropical deforestation by the types of agricultural production.
Beef stands out immediately. The expansion of pasture land to raise cattle was responsible for 41% of tropical deforestation. That’s 2.1 million hectares every year – about half the size of the Netherlands. Most of this converted land came from Brazil; its expansion of beef production accounts for one-quarter (24%) of tropical deforestation. This also means that most (72%) deforestation in Brazil is driven by cattle ranching.5 Cattle in other parts of Latin America – such as Argentina and Paraguay – also accounted for a large amount of deforestation – 11% of the total. Most deforestation for beef therefore occurs in Latin America, with another 4% happening in Africa.
Palm oil and soy often claim the headlines for their environmental impact. They are categorised as ‘oilseeds’, which also include a range of smaller commodities such as sunflower, rapeseed, and sesame. They drove 18% of deforestation. Here we see that Indonesian palm oil was the biggest component of this. In neighbouring Malaysia the expansion of oil seeds was also a major driver of forest loss. Soybeans are the most common oilseed in Latin America. While many people immediately think of food products such as tofu or soy milk, most of global soybean production is used as feed for livestock, or biofuels. Just 6% is used for direct human food. The impact of soy production is one we look at in more detail in a related article.
Combined, beef and oilseeds account for nearly 60% of deforestation.
If we add the third largest driver – forestry products, which is dominated by paper but also includes timber – then we cover almost three-quarters. Across Europe and North America, forestry products mainly come from managed plantation forests that have been established for a long period of time, or are grown on previously unforested land. This is different from most tropical countries where forestry products also come from the logging of primary rainforests or their replacement with plantations. This destroys primary rainforests and, as shown in the chart, has been an important driver of deforestation in Indonesia and elsewhere in Asia.


If almost three-quarters of tropical deforestation is driven by the production of a few key products – beef, soybeans, palm oil, and paper – then we can achieve a lot by focusing our efforts on these supply chains.
There are some signs that progress is possible. Soybean production in Brazil was once also an important driver of deforestation in the Amazon region.6 In 2006, under pressure from retailers and NGOs, the world’s major soybean traders signed Brazil’s Soy Moratorium (SoyM) – the world’s first voluntary zero-deforestation agreement. Traders agreed that they would not purchase soy that was grown on deforested lands in the Brazilian Amazon after July 2006. Overall, it was a success: in the two years before the agreement, 30% of soybean expansion in the region came at the expense of forest; afterwards, deforestation declined dramatically and by 2014 only 1% of expansion was turning forests into land for oilseed production.7,8
But, as we show in our article on the impact of soy, there are also lessons to learn about how to implement these commitments more effectively. There is evidence that while the moratorium reduced deforestation rates in the Brazilian Amazon, some of this deforestation may have ‘leaked’ to neighbouring regions. Soybean production has shifted from the Amazon to the Cerrado region south of the Amazonas, often at the expense of forests there.9 This suggests that zero-deforestation agreements can be effective but must be considered in the wider context of how they shape forest and agricultural changes elsewhere. To combat this, researchers have suggested the SoyM be expanded to not only include the Amazon but also regions such as the Cerrado.10
If we can take similar action in the other industries – beef, palm oil and paper – then there is the potential to cut out a large share of deforestation today.
Looking to the future, a shift in focus towards Sub-Saharan Africa looks likely. The demands for increased agricultural production in Africa are going to be large, and could come at the cost of forests.11 Solutions there will have to focus on major improvements in crop yields so African farmers can produce more food without increasing the amount of land they need to do so.
Alternative ways of making high-quality protein could also be transformative. Beef is the leading driver of deforestation, and the demand for meat across the world will continue to grow in the coming decades. Technological innovations in meat substitute and cultured meat products would allow people to continue eating meat-like products without the destruction of tropical forests that come with it.
Soy has earned itself a bad reputation with many consumers. Its links to deforestation means that, alongside palm oil, soy has become a product to avoid. Is this reputation justified?
In this article we will take a look at the story of soy: how production has changed over time; where it is produced; what it is used for; and whether it really has been a key driver of deforestation. Although the research suggests that by far the largest driver of deforestation in the Brazilian Amazon has been driven by the expansion of pasture land for beef production, soy is likely to have played at least some role in the loss of forest.
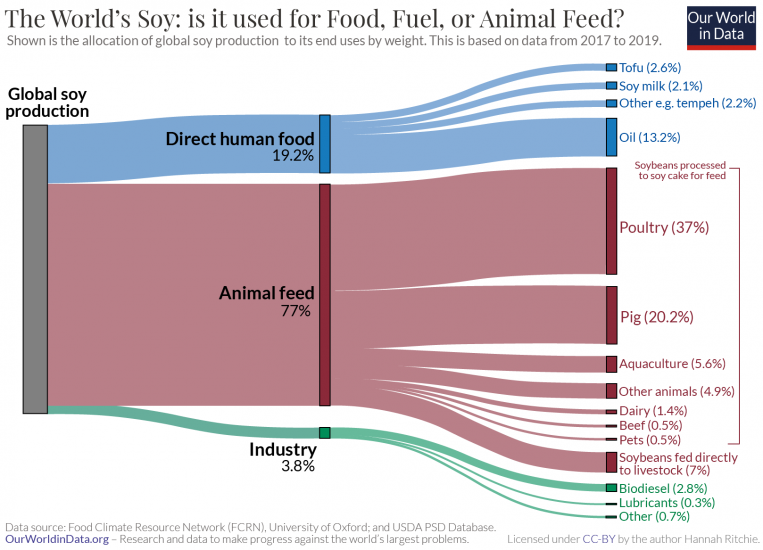
More than three-quarters (77%) of global soy is fed to livestock for meat and dairy production. Most of the rest is used for biofuels, industry or vegetable oils. Just 7% of soy is used directly for human food products such as tofu, soy milk, edamame beans, and tempeh. The idea that foods often promoted as substitutes for meat and dairy – such as tofu and soy milk – are driving deforestation is a common misconception.
How has demand for soy changed over time?
Global soy production has exploded over the past 50 years. Global production today is more than 13 times higher than it was in the early 1960s. Even since the year 2000, production has more than doubled.
In the chart here we see the change in global soybean production from 1961 onwards.12 Back in the 1960s, we were producing 20 to 30 million tonnes per year. This is now 350 million tonnes.
We can increase agricultural production in two ways: by improving yields (growing more on a given plot of land) or expanding the amount of land we use. As we will see later, although countries have seen yield gains over time, much of the increase in production has been driven by the expansion of croplands. Unfortunately, some of this has been at the expense of forests.

Which countries produce the most soy?
Global soy production has increased rapidly over the past 50 years. But to understand whether this has come at a major environmental cost, we also need to understand where this growth has come from.
Which countries are the main producers of soy?
In the map we see the distribution of soybean production across the world. Most of the world’s soy comes from only two countries: the US and Brazil. Combined, they account for more than two-thirds (69%) of global soy production.13 In fact, they produce almost exactly the same amount: in 2018 the US produced 123 million tonnes, and Brazil 118 million tonnes. Individually, they each account for around one-third of global production. The other major producer is Argentina, which accounts for 11% (at 40 million tonnes).
To understand soy as a potential driver of deforestation, it’s also useful to understand how each country’s production has changed over time. It is the change in production, and how this was achieved (either increased yields or cropland expansion), that is the potential driver of deforestation.
In the other chart we see the change in soy production in Brazil and the US. The US was already producing a lot of soy throughout the 1960s, 70s and 80s and so its growth in recent decades has been much slower than Brazil. The US was growing 20 million tonnes per year as early as 1960. Brazil did not reach this level of output until 1990 – three decades later. This means that its rate of growth in the last 30 years has been much faster.


More than three-quarters of global soy is fed to animals
Before we look at the evidence for whether Brazilian soy is responsible for the clearing of the Amazon, we should first understand what products have been driving this growth.
When someone mentions soy we often think about foods such as tofu, soy milk, tempeh or edamame beans. This feeds into the argument that meat and dairy substitutes – such as switching from meat to high-protein tofu, or from dairy to soy milk – is in fact worse for the environment. But, only a small percentage of global soy is used for these products. More than three-quarters (77%) of soy is used as feed for livestock.
In the chart here we see the breakdown of what the world’s soy was used for in 2018. On the left we have total global soy production; in the middle, the three categories of uses (direct human food, animal feed, and industrial processes); and on the right we have the end use products. This data is sourced from an analysis published by the University of Oxford’s Food Climate Research Network (FCRN), which relies on the USDA’s PSD database.14 Over one-third (37%) of global soy is fed to chickens and other poultry; one-fifth to pigs; and 6% for aquaculture. Very little soy is used for beef and dairy production – only 2%.
One-fifth of the world’s soy is used for direct (i.e. not from meat and dairy) human consumption. Most of this is first processed into soybean oil. Typical soy products such as tofu, soy milk, tempeh and edamame beans account for just 7% of global demand.
Soy can also be used for industrial purposes. Around 4% is used for biofuels, lubricants and other industrial processes. Biodiesel alone accounts for 2.8%.
We might therefore conclude that the increased demand for soy has been driven by a growing appetite for meat, dairy and soybean oil. But to double-check we should look beyond this static single-year view and see how demand has changed over time. Maybe demand for these products has always been high, and instead the growth in demand has come from the increased popularity of products such as soy milk and tofu.
In the chart we see the allocation of soybeans to three categories. Processed products include all animal feed from soybean cake (i.e. 70% of global demand); soybean oil; and industrial products such as biofuels. Direct human food includes all non-animal-sourced foods from soy excluding oils. Direct animal feed is soybeans fed directly to livestock (rather than been processed into soybean cake first).
We see that most of this growth has come from the increased demand for processed soy – animal feed, biofuels and vegetable oil. This rise has been particularly steep since 1990. By 2013, it had increased from 88 million to 227 million tonnes. Over this period, demand for human food products such as tofu and soy milk increased by only 3 million tonnes (from 7.4 to 10.7 million).
This should not surprise us. Global meat production has more than tripled over the last 50 years. This increase has been most marked for poultry – the largest consumer of soy feed.
Using the ‘change country’ toggle you can see how this allocation varies by country. For example, we see that this distribution is similar for Brazil.

Is soy production driving deforestation?
So far we’ve established that demand for soy has increased rapidly over the past 50 years; most soy is produced in the US, Brazil (and to a lesser extent, Argentina); and most of this has been driven by increased demand for animal feed, biofuels and vegetable oils.
The big question is whether this has been a key driver of deforestation.
The first step to answering this is to understand whether the amount of land we use to grow soy has increased. If improvements in crop yields were able to keep up with this rise in production then we wouldn’t need any additional land, and there would be no need to cut down forests.
In the chart we see the change in soy production, yields, and area harvested. This tells us the percentage change in each of these variables relative to the first year shown. Here the starting year is 1961 but you can change this by adjusting the time slider at the bottom of the chart. This is shown for the world by default but you can see this for any country using the “Change country” toggle.
Crop yields have not been able to keep up with production. Since 1961 global yields increased by 150%. But production increased by 1200%. This means the area used to grow soy has more than quadrupled.
This is also true for Brazil [you can see this using the “Change country” toggle]. Since Brazilian soy production was very low in 1961, it makes sense to adjust the time slider to see the change since 1980. Soy yields have doubled since 1980. This is impressive but not enough to keep up with demand: soy production increased by 680%. Instead, Brazil has had to devote more and more land to soy production: land use has tripled since 1980.

Brazil has devoted increasing amounts of land to soy production. But has this come at the expense of forests? Has the Amazon been cleared to make room for it?
This is a question many researchers have tried to answer. What makes it complex is that agricultural and land use systems are intricately linked: it’s possible to assess whether soy production has a direct impact on deforestation, but much harder to understand whether it is indirectly causing harm elsewhere.
In a study published in Science, Alexandra Tyukavina et al. (2017) look at the drivers of forest loss in the Brazilian Legal Amazon.15 The change in these drivers from 2000 to 2013 is shown in the chart. Note that this overall trend suggests a major decline in forest loss since 2000 – unfortunately in the years since 2013, rates have increased again.
From this, we would conclude that the dominant driver of deforestation in the Brazilian Amazon was the expansion of pasture for beef production. If we look at forest loss from commercial crops – which is mainly soybeans – we see a significant decline, especially following the introduction of ‘Brazil’s Soy Moratorium’. The ‘Soy Moratorium’ was a campaign involving civil agencies and soybean companies, which stipulated that farmers who grew soy on illegal or legal deforestation areas would not be able to sell them to suppliers. Since 2009, satellite imagery has been used to help to identify soybean crops being grown on deforested areas.16
Numerous studies have reached a very similar conclusion: it is pasture, not soybean production that is driving most deforestation in the Brazilian Amazon.17,18.19 But, this only looks at the direct drivers of deforestation. In other words, the cutting down of forest today to make space for cropland for soy production.

The indirect impacts of soy production
Soy may no longer be a direct driver of deforestation in the Brazilian Amazon. But we should also think about the indirect impacts of increased production. We know that the area being used to grow soy is still increasing, and that land has to come from somewhere. In particular regions, such as Mato Grosso, studies have found that instead of replacing forest, these croplands are replacing pasture.20 If this pasture land is simply shifting into forested areas, we could argue that soy is still a major underlying cause of deforestation.
A recent study by researchers Nikolas Kuschnig, Jesús Crespo Cuaresma, and Tamás Krisztin reached this conclusion.21 They combined high-resolution satellite imagery from the Mato Grosso region in Brazil with socioeconomic panel data to not only quantify the direct impacts of soy production, but also the spillover effects. The results suggest that by only looking at direct impacts we are underestimating the role that soy continues to play in deforestation.
It’s also the case that the Amazonas region in Brazil gets most of the attention. But most soy is now grown in other regions of the country. In 2015, only 13% came from the Amazon, while 48% came from the Cerrado region.22 Some researchers therefore make a strong case that interventions such as the ‘Soy Moratorium’ need to be extended to cover regions beyond the Amazon if they are to be effective. Without wider implementation of these policies, we will continue to see deforestation simply shift elsewhere.
Whilst the expansion of pasture for beef production is the leading driver of deforestation in Brazil, soy still plays a significant role when we take its indirect impacts into account. To end deforestation, there are a couple of key actions we can take. For consumers, since most deforestation is driven by expanding pastures for beef, or soy to feed poultry and pigs, reducing meat consumption is an effective way to make a difference. For companies and regulators, zero-deforestation policies must be more widely implemented (i.e. not only focused on the Amazon) and must be more carefully designed to take spillover effects into account.
- Palm oil production has grown to meet rising demands for vegetable oils
- Who uses palm oil and what is it used for?
- Where is palm oil grown?
- How has land use for palm oil changed over time?
- Is palm oil responsible for deforestation?
- Palm oil versus the alternatives
- What would be the impact of substituting palm oil?
- How can we use palm oil without destroying tropical forests?
In a large-scale consumer survey across the UK population on perceptions of vegetable oils, palm oil was deemed to be the least environmentally-friendly.23 It wasn’t even close. 41% of people thought palm oil was ‘environmentally unfriendly’, compared to 15% for soybean oil; 9% for rapeseed; 5% for sunflower; and 2% for olive oil. 43% also answered ‘Don’t know’, meaning that almost no one thought it was good.
Retailers know that this is becoming an important driver of consumer choices. From shampoos, to detergents, from chocolate to cookies, companies are trying to eliminate palm oil from their products. There are now long lists of companies that have done so [Google ‘palm-oil free’ and you will find an endless supply]. Many online grocery stores now offer the option to apply a ‘palm-oil free’ filter when browsing their products.24
Why are consumers turning their back on palm oil? And is this reputation justified?
In this article I address some key questions about palm oil production: how has it changed; where is it grown; and how this has affected deforestation and biodiversity. The story of palm oil is not as simple as it is often portrayed. Global demand for vegetable oils has increased rapidly over the last 50 years. Being the most productive oilcrop, palm has taken up a lot of this production. This has had a negative impact on the environment, particularly in Indonesia and Malaysia. But it’s not clear that the alternatives would have fared any better. In fact, because we can produce up to 20 times as much oil per hectare from palm versus the alternatives, it has probably spared a lot of environmental impacts from elsewhere.
Palm oil production has grown to meet rising demands for vegetable oils
Palm oil production has increased rapidly over the past 50 years. In 1970, the world was producing only 2 million tonnes. This is now 35 times higher: in 2018 the world produced 71 million tonnes. The change in global production is shown in the chart.25
The rise of palm oil follows the rapid increase in demand for vegetable oils more broadly. The breakdown of global vegetable oil production by crop is shown in the stacked area chart. Global production increased ten-fold since the 1960s – from 17 to 170 million tonnes in 2014. As we will see later in this article, more recent data for 2018 comes to 218 million tonnes.
The story of palm oil is less about it as an isolated commodity, but more about the story of the rising demand for vegetable oils. Palm oil is a very productive crop; as we will see later, it produces 36% of the world’s oil, but uses less than 9% of croplands devoted to oil production. It has therefore been a natural choice to meet this demand.


Who uses palm oil and what is it used for?
Why has the market for palm oil – and vegetable oils more broadly – increased so rapidly? What is it used for?
Palm oil is a versatile product which is used in a range of products across the world:
- Foods: over two-thirds (68%) is used in foods ranging from margarine to chocolate, pizzas, breads and cooking oils;
- Industrial applications: 27% is used in industrial applications and consumer products such as soaps, detergents, cosmetics and cleaning agents;
- Bioenergy: 5% is used as biofuels for transport, electricity or heat.
While food products dominate globally, this breakdown varies from country-to-country. Some countries use much more palm oil for biofuels than others. In Germany, for example, bioenergy is the largest use, accounting for 41% (more than food at 40%). A push towards increased biofuel consumption in the transport sector has been driving this, despite it being worse for the environment than normal diesel (more on this later).
In the next section we will look at what countries produce palm oil, but here we see a map of palm oil imports. Although production is focused in only a few countries across the tropical belt, we see that palm oil is an important product across the world.

Where is palm oil grown?
Oil palm is a tropical plant species. It thrives on high rainfall, adequate sunlight and humid conditions – this means the best growing areas are along a narrow band around the equator.26 Palm oil is therefore grown in many countries across Africa, South America, and Southeast Asia. In the map we see the distribution of production across the world.
Small amounts of palm oil are grown in many countries, but the global market is dominated by only two: Indonesia and Malaysia. In 2018, the world produced 72 million tonnes of oil palm. Indonesia accounted for 57% of this (41 million tonnes), and Malaysia produced 27% (20 million tonnes).
84% of global palm oil production comes from Indonesia and Malaysia.
In the chart we see the production of the palm oil plant across a number of countries. Other producers include Thailand, Colombia, Nigeria, Guatemala, and Ecuador. As we’d expect, all of these countries lie along the zone of ‘optimal conditions’ around the equator.


How has land use for palm oil changed over time?
How has the world achieved such a rapid expansion of palm oil production? There are only two ways in which we can produce more of a given crop: increase yields (growing more on a given amount of land) or expand the amount of land we use to grow it.
Global palm yields have increased over time, but far short of the increase in demand. This means that over the last 50 years the amount of land devoted to growing palm oil has increased a lot. In the chart here we see the change in land use. Since 1980 the amount of land the world uses to grow palm has more than quadrupled, from 4 million to 19 million hectares in 2018. Indonesia and Malaysia account for 63% of global land use for palm. This is low when we consider that it accounts for 84% of production. This is because both countries achieve high yields.
19 million hectares might sound like a lot of land. But we should consider this in the context of all land used to grow oilcrops. The world devotes more than 300 million hectares for oilcrop production. Palm oil accounts for 6% of this land use, which is small when we consider that it produces 36% of the oil.


Is palm oil responsible for deforestation?
Land use to grow palm has more than quadrupled since 1980. But has this expansion came at the expense of tropical forest?
This seems like a simple question, but is not as straightforward as we might expect. The IUCN (International Union for Conservation of Nature) Oil Palm Task Force conducted an in-depth review of the literature to understand the impact of palm oil on deforestation.27 There was a lot of variability in the results, depending on how a forest was defined, the geographic focus of the analysis, and timeframe that was considered.
Having done my own review of the literature I conclude that palm oil has been a significant driver of tropical deforestation, especially in Southeast Asia.
Some studies suggest that palm oil has played a very small role in global forest loss. One study suggests that palm oil is responsible for around 2% of global tree loss.28 Another suggests it is responsible for only 0.2% of intact forest loss.29 This seems very low. But there are a couple of caveats to these figures. Firstly, they measure forest loss, which combines both permanent deforestation (where trees do not regrow) and forest degradation (which is a temporary thinning of forests with subsequent regrowth). As we discuss in our related article on this, deforestation accounts for just one-quarter of global tree loss. Palm oil’s contribution to deforestation – which has greater environmental impacts than degradation – would be higher.
Secondly, the 0.2% figure is based on intact forest loss. Intact forests are a specific subset of primary forests which are very rich sites of biodiversity, and are largely undisturbed by human activity. Only 6% of global intact forest is in Southeast Asia, the hotspot of palm oil expansion. Only 2.8% was in Indonesia, and 0.2% in Malaysia. So, even if all of these countries’ forests were wiped out by palm oil plantations, it would still make very little difference to this metric of global intact forest loss. The authors of the original study make it clear that intact forest loss should not be confused with primary forest loss.
So, how much of palm oil’s expansion has really come at the expense of forests? Let’s focus on the two key countries driving production: Indonesia and Malaysia. In the chart here we see the drivers of deforestation in Indonesia from 2001 to 2016.30 Oil palm plantations were the largest driver of deforestation over this period, accounting for 23%. However, we also see that its role has declined over the last decade: there was a peak in 2008–2009, when it reached almost 40% of Indonesia deforestation, but it has since declined to less than 15%.

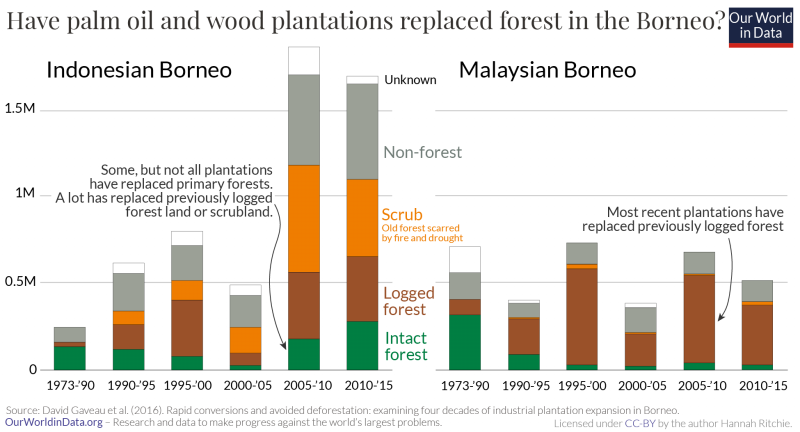
Part of what makes this question so challenging to answer is that it depends on whether you only consider palm plantations which immediately and directly replaced existing forest, or whether you include plantations which very quickly replaced forests which had been logged for wood, paper and pulp. In a paper published in Nature, David Gaveau and colleagues (2016) used satellite imagery to assess what types of land industrial plantations replaced in the Borneo region.31 Industrial plantations include palm oil and pulpwood tree plantations, but are dominated by the former. This is shown for the Indonesian and Malaysian Borneo in the chart.
75% of these plantations were grown on land that was previously forested in 1973. Not all of these plantations were the direct driver of this replacement. In fact, only one-quarter of post-1973 plantations in the Borneo was driven by rapid conversion of this land to plantations (20–21% oil-palm; 4.3–4.8% pulpwood). This is shown in green in the chart. Direct deforestation for palm oil played a larger role in Malaysia; 60% was driven by plantations, whilst in Indonesia it was only 16%.
This study only looks at the Borneo region. But this is reasonably consistent with studies that have looked at the expansion of palm plantations more broadly. A global study of palm-driven deforestation found that in Southeast Asia, 45% of oil palm plantations came from areas that were forests in 1989.32 In Indonesia this was 54% and in Malaysia, 40%.
These distinctions on how quickly palm oil plantations replaced forests make it difficult to give a clear, single number on how much deforestation it has caused. But, most of the research concludes that, particularly in tropical forests in Southeast Asia, palm expansion has played a significant role.
Palm oil versus the alternatives
Palm oil has been an important driver of deforestation. But would the alternatives have fared any better?
There are a couple of reasons why palm oil has been the favored crop to meet growing demand for vegetable oils. Firstly, it has lowest production costs.33 Secondly, its composition means it’s versatile and can be used for food and non-food purposes alike: some oils are not suited for cosmetic uses such as shampoos and detergents. Third, it gets incredibly high yields.
If we weren’t meeting global oil demand through palm oil, another oilcrop would have to take its place. Would the alternatives be any better for the environment?
We can compare crops in terms of their yields – how much oil we can produce from one hectare of land. This comparison is shown in the chart.34 Palm oil stands out immediately. It achieves a much higher yield than the alternatives. From each hectare of land, you can produce about 2.8 tonnes of palm oil. That’s around four times higher than alternatives such as sunflower or rapeseed oil (where you get about 0.7 tonnes per hectare); and 10 to 15 times higher than popular alternatives such as coconut or groundnut oil (where you get 0.2 tonnes per hectare).35

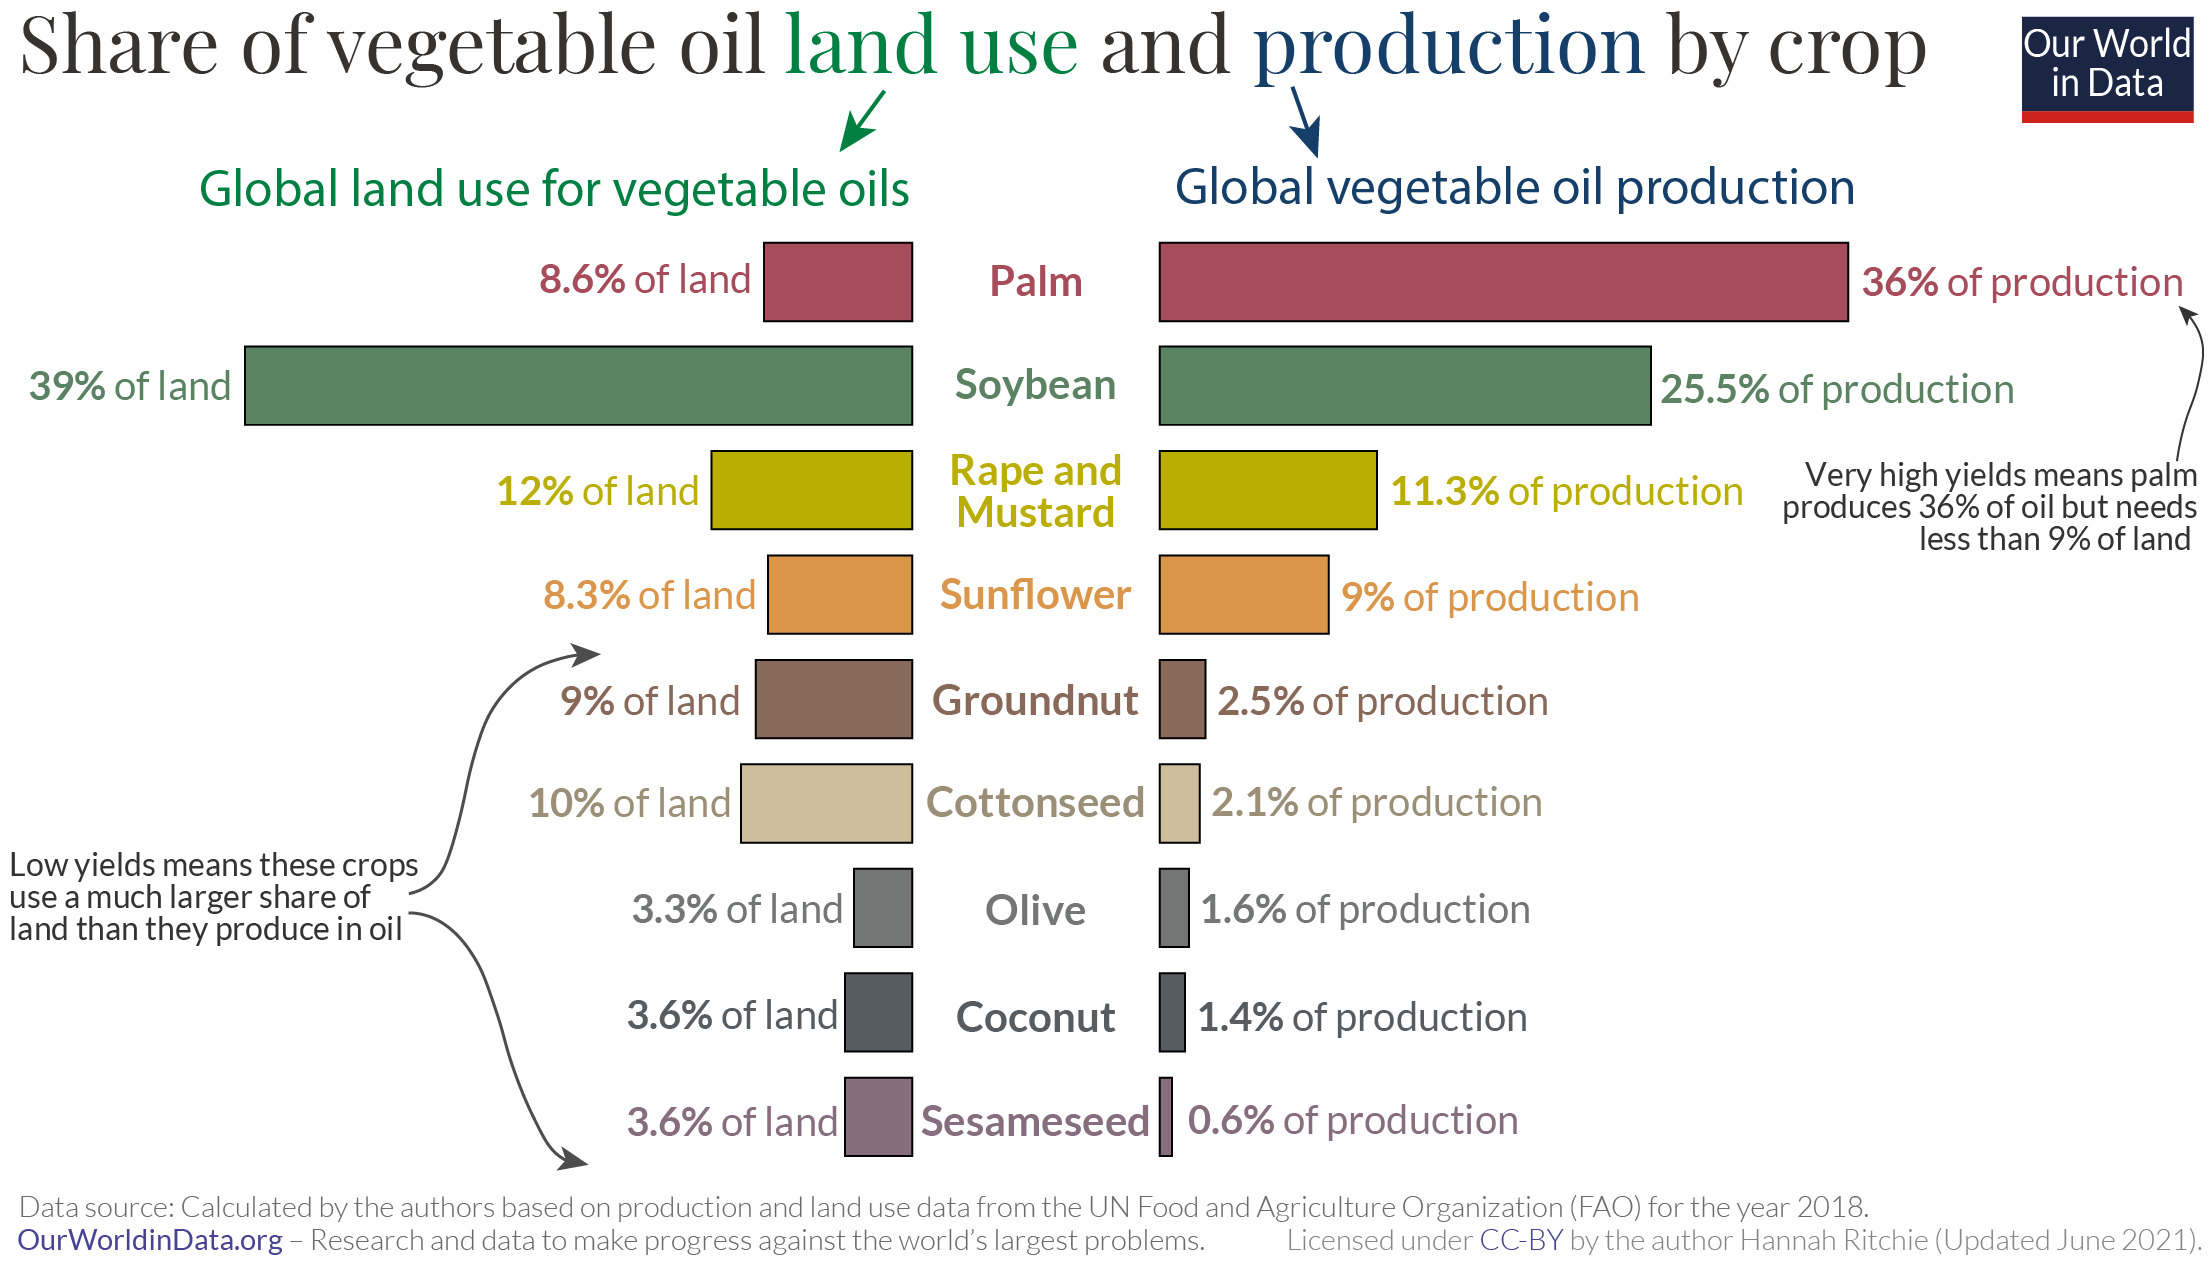
Let’s take a look at how this comparison affects the global landscape of oilcrops in terms of production and land use. In the chart we see the breakdown of global vegetable oil production in 2018. On the left we have each crop’s share of global land use for vegetable oils; on the right we have its share of production.
We know from our yield comparison that palm oil achieves a much higher yield. What this means is that it accounts for a very high share of oil production without taking up much land. In 2017 it produced 36% of our vegetable oil, but took up only 8.6% of the land.
Sunflower oil was almost exactly proportional in terms of how much oil it produced relative to how much land it took up: it produced 9% of oil, and required 8.3% of land. Rape and mustardseed oil were also in proportion. The rest – soybean, olive, coconut, groundnut, and sesameseed – used more land than they gave back in oil production. Coconut oil, for example, provided only 1.4% of global oil but required 3.6% of the land.
It’s of course true that some crops provide co-products in the process. The non-oil fraction of soybeans, for example, can be allocated to other uses such as high-protein animal feed. Therefore using this land to grow the crop is meeting other food demand at the same time. But this doesn’t change the fact that if the world requires a given amount of vegetable oil, it is the oil yield per hectare of each crop that we care about – regardless of whether it provides co-products in the process.
What would be the impact of substituting palm oil?
Palm oil achieves very high yields relative to other oilcrops. Why does this matter?
If we want to limit our environmental impact, reducing the amount of land we devote to agriculture is key. To make space for more croplands and pastures, we have been displacing forests, grasslands and peatlands – areas of rich biodiversity. The less land we need for farming, the better.
The high yields from palm oil means that it, in some sense, ‘spares’ the world additional farmland we would need if we want to meet global oil demand from the alternatives. We can look at this in terms of the amount of land we would need if total global demand for vegetable oil was met from a single crop alone. In other words, how much land would be needed if the 218 million tonnes of oil was only produced from palm oil, or only produced from rapeseed? This comparison is shown in the chart. As we’d expect, we see vast differences.
Let’s give these numbers some context. Currently the world devotes around 322 million hectares to oilseed crops. That’s an area similar to the size of India. If global oil was supplied solely from palm, we’d need 77 million hectares, around four times less. If we got it from rapeseed we’d need an area similar to the size we use today; from coconuts, an area the size of Canada; and in the most extreme case, we’d have to devote 2 billion hectares to sesame seeds – a bit more than Canada, the USA, and India combined.
In this sense, palm oil has been a ‘land sparing’ crop. Switching to alternatives would mean the world would need to use more farmland, and face the environmental costs that come with it. A global boycott on palm oil would not fix the problem: it would simply shift it elsewhere, and at a greater scale because the world would need more land to meet demand.
This is true for other tropical oilcrops such as coconut, groundnut, or soy. However, we might argue that this oversimplifies the comparison to more temperate crops: it assumes the environmental impact of devoting one hectare of land for sunflower seeds in Europe is the same as cutting down tropical rainforests to grow palm or coconut plantations. We know that tropical forests are incredibly rich in biodiversity, and store a lot of carbon from the atmosphere. In some cases, especially for European domestic markets, some substitution for rapeseed or sunflower seed oils could have a positive environmental impact even if it required using a bit more land.

How can we use palm oil without destroying tropical forests?
There are a number of steps we can take to ensure we meet global demand for oils, without destroying our tropical forests.
Substitutes for palm oil do not always exist. As we’ve discussed, substituting palm oil with alternatives can do more harm than good. But it’s also true that alternative oils are not always suitable for the products we need. Palm oil is unique in its versatility, meaning it is suitable for a range of foods, cosmetics, industrial applications and biofuels. Substitution would be feasible for most food products. Substitution in industrial processes would be more difficult, especially if we want to replace it with oils grown in temperate countries: sunflower or rapeseed oil is not suited to products such as soaps, detergents or cosmetics. One sector where alternatives do exist is bioenergy, which brings us to our next point.
European countries should stop using palm oil for biofuels. The EU – after China and India – is the third largest importer of palm oil. There are some products where using palm is our best option. This is not the case for biofuels, yet two-thirds of the EU’s imported palm oil goes to bioenergy production. Using palm oil as a biofuel is worse for the environment than petrol. A meta-analysis conducted by the Royal Academy of Engineering on EU biofuels found that when we factored in land-use change, the greenhouse gas emissions from palm oil were higher than using a petrol car.36 Other studies have shown that when we take the additional environmental impacts into account, these biofuels are much worse than conventional fuels.37 By using palm oil, EU countries are not only increasing emissions, they’re passing the responsibility and accountability of these emissions on to other countries. A ban on using palm oil for biofuels would reduce this impact while allowing global palm oil to be used for purposes where there are few better alternatives – food and cosmetic products.
Increase companies sourcing from suppliers with sustainability certification. There are now a number of certification schemes which help to verify whether palm oil is being produced in a sustainable way. The most well-known is the Roundtable on Sustainable Palm Oil (RSPO). The RSPO was launched in 2004, and provides certification for suppliers who produce their crop in a more sustainable way by conducting impact assessments, managing high-value areas of biodiversity, not clearing primary forest and avoiding land clearance through fires.38 For example, suppliers can only be certified if their plantations since 2005 have not replaced primary forest or areas rich in biodiversity. Consumer demand for sustainable palm oil puts pressure on food and cosmetic companies to source from certified suppliers, and ultimately rewards the most sustainable growers.
Only 19% of palm oil production is covered by the RSPO.39 Research into the impact of the RSPO found that it was successful in reducing deforestation.40 However, it found that this most avoided deforestation from older plantations, which is not where most tropical forests remain. To have a real, permanent impact, certification needs to cover a much larger number of growers.
Increased crop yields. If we want to reduce agricultural expansion, we want to maximise crop yields through effective management practices, improved varieties and choosing the most productive areas of land.
This combination of interventions involves actors across the full production line, from agricultural scientists improving crop varieties, to palm oil growers, governments, food and cosmetic producers, retailers and consumers. Pressure from consumers can filter through to growers. To do this effectively, understanding for consumers has to be clearer. Many believe that boycotting palm oil is how we make a difference. But as we’ve seen, the alternatives are not necessarily better; more sustainable palm oil (used for food, not fuel) rather than no palm oil is what we should be pushing for.