How much of the earth’s surface is forested?
How much of the world’s land surface today is covered by forest?
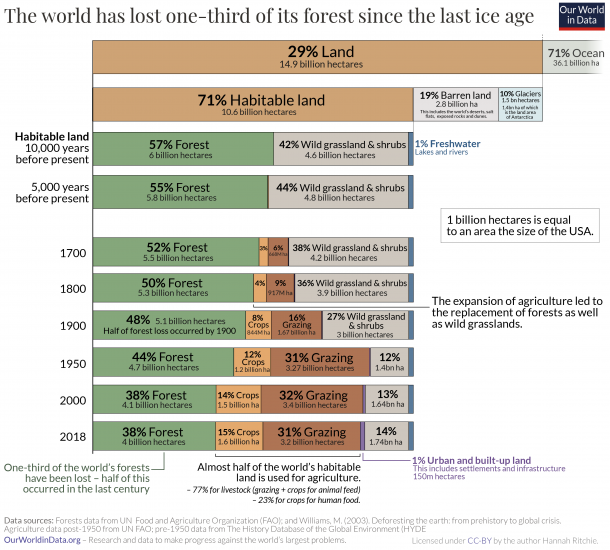
In the visualization we see the breakdown of global land area.
10% of the world is covered by glaciers, and a further 19% is barren land – deserts, dry salt flats, beaches, sand dunes, and exposed rocks. This leaves what we call ‘habitable land’.
Forests account for a little over one-third (38%) of habitable land area. This is around one-quarter (26%) of total (both habitable and uninhabitable) land area.
This marks a significant change from the past: global forest area has reduced significantly due to the expansion of agriculture. Today half of global habitable land is used for farming. The area used for livestock farming in particular is equal in area to the world’s forests.
How are our forests distributed across the world regions?
This visualization shows breakdown of global forest area by world region.
We see that Europe – dominated by forests across Russia – holds the greatest share of global forests. They are home to one-quarter of the world’s forest area.
This was followed by South America which has one-fifth of forest area.
What share of each country is forested?
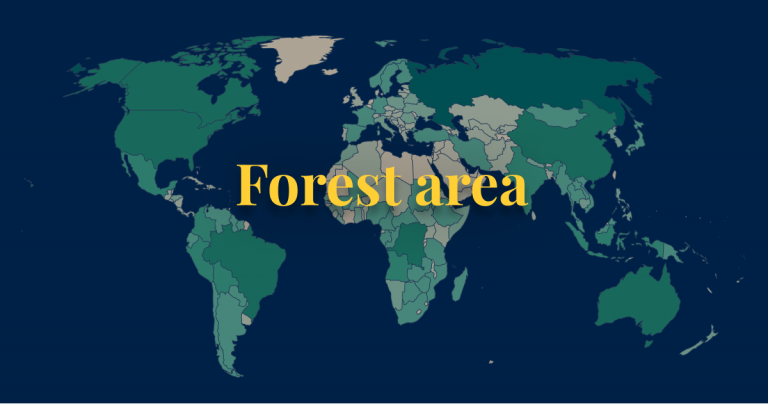
This interactive map shows the share of total land area that is covered by forest.
Total forest area by country
This interactive map shows the total area of forest cover, as measured in hectares (ha).
Russia is home to the largest area of forest – 815 million hectares.
Brazil, the United States, Canada, China, Australia, and the Democratic Republic of Congo also have a largest forest area – more than 100 million hectares each.
What share of the world’s forests does each country have?
This interactive map shows each country’s share of global forest area.
Russia – which has the largest forest area – is home to one-fifth of global forest area. Brazil is the only other country with more than 10% of global forest cover.
Previous visualizations have looked at forests in terms of the area they cover. But what about the number of trees that exist globally and by country?
In a study, published in the journal Nature, Thomas Crowther and colleagues (2015) mapped tree density across the world.3 To do this, they utilised 429,775 ground-sourced measurements of tree density from every continent on Earth to generate a global map of forest trees. They define a tree as a plant with woody stems larger than 10 cm diameter at breast height (DBH).
They estimated that there were approximately 3.04 trillion trees in the world. The authors also estimated that over 15 billion trees are cut down each year, and the global number of trees has fallen by almost half (46%) since the start of human civilization.
The distribution of trees across the world is shown in the interactive map.
Primary vs. planted forest
We previously looked at total forest area across the world. But within this total, there are multiple types of forest: primary forests which have not been disturbed by human activities versus regenerated or planted forests.
This visualization looks at the breakdown of forests by type. The definitions for the three categories – as defined by the UN Food and Agriculture Organization (FAO) – are given below.4
Primary forest:
“Naturally regenerated forest of native species, where there are no clearly visible indications of human activities and the ecological processes are not significantly disturbed.”
Naturally regenerated forest:
“Naturally regenerated forest where there are clearly visible indications of human activities.
Includes selectively logged-over areas, areas regenerating following agricultural land use, areas recovering from human-induced fires, etc.”
Planted forest:
“Forest predominantly composed of trees established through planting and/or deliberate seeding.”
