In this entry we present the latest estimates of mental health disorder prevalence and the associated disease burden. Most of the estimates presented in this entry are produced by the Institute for Health Metrics and Evaluation and reported in their flagship Global Burden of Disease study.
For 2017 this study estimates that 792 million people lived with a mental health disorder. This is slightly more than one in ten people globally (10.7%)
Mental health disorders are complex and can take many forms. The underlying sources of the data presented in this entry apply specific definitions (which we describe in each relevant section), typically in accordance with WHO’s International Classification of Diseases (ICD-10). This broad definition incorporates many forms, including depression, anxiety, bipolar, eating disorders and schizophrenia.
Mental health disorders remain widely under-reported — in our section on Data Quality & Definitions we discuss the challenges of dealing with this data. This is true across all countries, but particularly at lower incomes where data is scarcer, and there is less attention and treatment for mental health disorders. Figures presented in this entry should be taken as estimates of mental health disorder prevalence — they do not reflect diagnosis data (which would provide the global perspective on diagnosis, rather than actual prevalence differences), but are imputed from a combination of medical, epidemiological data, surveys and meta-regression modelling where raw data is unavailable. Further information can be found here.
It is also important to keep in mind that the uncertainty of the data on mental health is generally high so we should be cautious about interpreting changes over time and differences between countries.
The data shown in this entry demonstrate that mental health disorders are common everywhere. Improving awareness, recognition, support and treatment for this range of disorders should therefore be an essential focus for global health.
The table here provides a summary of the data which follows on mental health and substance use disorders. Clicking on a given disorder will take you to the relevant section for further data and information.
Related entries:
The Global Burden of Disease study aggregates substance use disorders (alcohol and drug use disorders) with mental health disorders in many statistics. In the discussion of the prevalence we have followed this practice, but we will change it in future updates of this research.
We address substance use disorders (alcohol and drug use disorders) in separate entries on Substance Use and Alcohol Consumption.
| Disorder | Share of global population with disorder (2017) [difference across countries] | Number of people with the disorder (2017) | Share of males:females with disorder (2017) |
|---|---|---|---|
| Any mental health disorder | 10.7% | 792 million | 9.3% males 11.9% females |
| Depression | 3.4% [2-6%] | 264 million | 2.7% males 4.1% females |
| Anxiety disorders | 3.8% [2.5-7%] | 284 million | 2.8% males 4.7% females |
| Bipolar disorder | 0.6% [0.3-1.2%] | 46 million | 0.55% males 0.65% females |
| Eating disorders (clinical anorexia & bulimia) | 0.2% [0.1-1%] | 16 million | 0.13% males 0.29% females |
| Schizophrenia | 0.3% [0.2-0.4%] | 20 million | 0.26% males 0.25% females |
| Any mental or substance use disorder | 13% [11-18%] | 970 million | 12.6% males 13.3% females |
| Alcohol use disorder | 1.4% [0.5-5%] | 107 million | 2% males 0.8% females |
| Drug use disorder (excluding alcohol) | 0.9% [0.4-3.5%] | 71 million | 1.3% males 0.6% females |
All our charts on Mental Health
Prevalence of mental health and substance use disorders
The predominant focus of this entry is the prevalence and impacts of mental health disorders (with Substance Use and Alcohol Use disorders covered in individual entries). However, it is useful as introduction to understand the total prevalence and disease burden which results from the broad IHME and WHO category of ‘mental health and substance use disorders’. This category comprises a range of disorders including depression, anxiety, bipolar, eating disorders, schizophrenia, intellectual developmental disability, and alcohol and drug use disorders.
In the map we see that globally, mental and substance use disorders are very common: around 1-in-7 people (15%) have one or more mental or substance use disorders.

It’s estimated that 970 million people worldwide had a mental or substance use disorder in 2017. The largest number of people had an anxiety disorder, estimated at around 4 percent of the population.

The scatterplot compares the prevalence of these disorders between males and females. Taken together we see that in most countries this group of disorders is more common for women than for men. However, as is shown later in this entry and in our entries on Substance Use and Alcohol, this varies significantly by disorder type: on average, depression, anxiety, eating disorders, and bipolar disorder is more prevalent in women. Gender differences in schizophrenia prevalence are mixed across countries, but it is typically more common in men. Alcohol and drug use disorders are more common in men.

Deaths from mental health and substance use disorders
The direct death toll from mental health and substance use disorders is typically low. In this entry, the only direct death estimates result from eating disorders, which occur through malnutrition and related health complications. Direct deaths can also result from alcohol and substance use disorders; these are covered in our entry on Substance Use.
However, mental health disorders are also attributed to significant number of indirect deaths through suicide and self-harm. Suicide deaths are strongly linked — although not always attributed to — mental health disorders. We discuss the evidence of this link between mental health and suicide in detail later in this entry.
In high-income countries, meta-analyses suggest that up to 90 percent of suicide deaths result from underlying mental and substance use disorders. However, in middle to lower-income countries there is evidence that this figure is notably lower. A study by Ferrari et al. (2015) attempted to determine the share disease burden from suicide which could be attributed to mental health or substance use disorders.1
Based on review across a number of meta-analysis studies the authors estimated that only 68 percent of suicides across China, Taiwan and India were attributed to mental health and substance use disorders. Here, studies suggest a large number of suicides result from the ‘dysphoric affect’ and ‘impulsivity’ (which are not defined as a mental and substance use disorder). It is important to understand the differing nature of self-harm methods between countries; in these countries a high percentage of self-harming behaviours are carried out through more lethal methods such as poisoning (often through pesticides) and self-immolation. This means many self-harming behaviours can prove fatal, even if there was no clear intent to die.
As a result, direct attribution of suicide deaths to mental health disorders is difficult. Nonetheless, it’s estimated that a large share of suicide deaths link back to mental health. Studies suggest that for an individual with depression the risk of suicide is around 20 times higher than an individual without.
Disease burden of mental health and substance use disorders
Health impacts are often measured in terms of total numbers of deaths, but a focus on mortality means that the burden of mental health disorders can be underestimated.2 Measuring the health impact by mortality alone fails to capture the impact that mental health disorders have on an individual’s wellbeing. The ‘disease burden‘ – measured in Disability-Adjusted Life Years (DALYs) – considers not only the mortality associated with a disorder, but also years lived with disability or health burden. The map shows DALYs as a share of total disease burden; mental and substance use disorders account for around 5 percent of global disease burden in 2017, but this reaches up to 10 percent in several countries. These disorders have the highest contribution to overall health burden in Australia, Saudi Arabia and Iran.

Depressive disorders occur with varying severity. The WHO’s International Classification of Diseases (ICD-10) define this set of disorders ranging from mild to moderate to severe. The IHME adopt such definitions by disaggregating to mild, persistent depression (dysthymia) and major depressive disorder (severe).
All forms of depressive disorder experience some of the following symptoms:
- (a) reduced concentration and attention;
- (b) reduced self-esteem and self-confidence;
- (c) ideas of guilt and unworthiness (even in a mild type of episode);
- (d) bleak and pessimistic views of the future;
- (e) ideas or acts of self-harm or suicide;
- (f) disturbed sleep
- (g) diminished appetite.
Mild persistent depression (dysthymia) tends to have the following diagnostic guidelines:
“Depressed mood, loss of interest and enjoyment, and increased fatiguability are usually regarded as the most typical symptoms of depression, and at least two of these, plus at least two of the other symptoms described on page 119 (for F32.-) should usually be present for a definite diagnosis. None of the symptoms should be present to an intense degree. Minimum duration of the whole episode is about 2 weeks. An individual with a mild depressive episode is usually distressed by the symptoms and has some difficulty in continuing with ordinary work and social activities, but will probably not cease to function completely.”
Severe depressive disorder tends to have the following diagnostic guidelines:
“In a severe depressive episode, the sufferer usually shows considerable distress or agitation, unless retardation is a marked feature. Loss of self-esteem or feelings of uselessness or guilt are likely to be prominent, and suicide is a distinct danger in particularly severe cases. It is presumed here that the somatic syndrome will almost always be present in a severe depressive episode. During a severe depressive episode it is very unlikely that the sufferer will be able to continue with social, work, or domestic activities, except to a very limited extent.”
The series of charts below present the latest global estimates of the prevalence and disease burden of depressive disorders. Depressive disorders, as defined by the underlying source, cover a spectrum of severity ranging from mild persistent depression (dysthymia) to major (severe) depressive disorder. The data presented below includes all forms of depression across this spectrum.
The share of population with depression ranges mostly between 2% and 6% around the world today. Globally, older individuals (in the 70 years and older age bracket) have a higher risk of depression relative to other age groups.


In 2017, an estimated 264 million people in the world experienced depression. A breakdown of the number of people with depression by world region can be seen here and a country by country view on a world map is here.
In all countries the median estimate for the prevalence of depression is higher for women than for men.
Depression is complicated – this is how our understanding of the condition has evolved over time
People often think of depression as a single, uniform condition – deep sadness and a loss of interest in the activities that someone usually enjoys. But depression is complicated and it’s difficult to define what it means in an objective way.
This is because depression is a condition of the mind: it is diagnosed based on people’s psychological symptoms and behavior, not from a brain scan or markers in their blood or DNA.
When we diagnose depression, we have to rely on people to recall their own symptoms. We have to trust that doctors will observe and probe their symptoms reliably. We have to analyze this information to understand what people with depression experience that other people don’t.
Our ability to do all of these things accurately has changed over time, and so has our understanding of depression.
This comes down to three factors.
First, many countries now screen for depression in the general population, not just in a subset of people who are seen by a small number of doctors. In many studies, researchers track patients over long periods of time to understand how the condition progresses.
Second, we use questionnaires and interviews that treat depression as a condition that can occur at different levels and change with time.
Third, we have better statistical tools to help us refine questionnaires and understand how symptoms are related to one another.
Let’s look at each of these factors in more detail before we explore how they have informed our understanding of depression.
Depression traces back to a condition called ‘melancholia.’ The concept of melancholia itself shifted in meaning several times in history. In ancient Greek medicine, it referred to a general condition of sadness and fear. From the 16th century, it was generally considered a type of insanity, and symptoms such as delusions and suspicion became more of a focus in these descriptions. Some people with these symptoms would likely be diagnosed with schizophrenia today.
From the late 18th century onwards, these symptoms became less emphasized, while fatigue and distress became more central to the diagnosis. Over the same time, the word depression was increasingly used in descriptions of melancholia. Since the 20th century, melancholia has been the name given to a severe subtype of depression.3
In the 19th century in Britain, for example, the diagnosis of melancholia was mainly used to decide who to admit to asylums. It was diagnosed based on the judgment of individual physicians who used different methods, and many asylums used broad definitions of suicidality. Talking about death, drinking too much alcohol, refusing food, having thoughts of guilt or damnation, having a fear of persecution, and any kind of self-harm could all be considered suicidal tendencies.4
Different asylums in Britain used different classification systems. This meant that statistics were difficult to compare between regions and were controversial, even at the time. Asylums would only record the overall number of patients with each condition – they wouldn’t record the symptoms of individual patients.5 In contrast, in Imperial Germany, detailed information about asylum patients was collected using census cards.6
Some psychiatrists such as Emil Kraepelin and Philippe Pinel monitored people in asylums in a systematic way. They noted which symptoms they had and how their illness changed over long periods of time. With that information, they designed systems to classify people with disorders.7
For example, Kraepelin noticed that some people with psychosis also had periods of depression, while others did not. He called the former condition ‘manic depression’ (which we would now understand as bipolar disorder or depression) and the latter ‘dementia praecox’ (which we now understand as schizophrenia).
These kinds of classifications began to be applied at large in asylums across Europe.
At the same time, psychologists began to devise questionnaires to measure people’s symptoms empirically. They developed various scales and tested them with college students before applying them to adults in the general population. Large organizations such as the American Psychological Association developed criteria that could be used to diagnose patients in a standardized way.
Depression is a condition that is increasingly recognized and surveyed in the population as a whole.
Now, we collect data on depression from two sources. First, we have data on diagnoses made by doctors. In many countries, doctors inquire about people’s symptoms and how much they correspond to the criteria in the Diagnostic and Statistical Manual of Mental Disorders (DSM). They also use tests to rule out medical conditions, such as thyroid disorders, that result in similar symptoms. Second, we have data on the severity of depression. This data is collected from patients and the general population, using many different questionnaires and rating scales.8 But there are still gaps in our knowledge. Data is lacking especially in many poorer places around the world. Even within high-income countries, people with poorer health or severe depression are much less likely to respond to these community surveys or report their symptoms accurately. If we didn’t take this into account, we would underestimate the prevalence of depression in the population.9
The second reason that we understand depression more accurately now is that we ask more nuanced questions about symptoms.
Depression as measured by Kraepelin focused only on whether symptoms were present or absent. But the measures that are used for screening or diagnosis today go much further.10 Now, people are asked about how frequent or severe their symptoms are.
For example, if someone has trouble sleeping, how many days does that occur each week? If they feel guilt, how often do they feel guilty? How guilty do they feel?
Do they often think about things they did wrong a long time ago? Do they blame themselves for having depression, seeing it as punishment? Do they hear voices accusing them or see hallucinations that threaten them?
We can use more specific questions like this to rate each symptom on levels that relate to how frequent or severe they are. We can place possible answers on a range from, say, 0 to 3. A person’s scores across all the symptoms can then be added up to give a total, and we can use cut-offs to classify an episode as ‘mild’, ‘moderate’ or ‘severe’ depression.
This was a huge step forward. It meant we could find out if patients with mild depression tended to be different from those with severe depression. We could also find out if they responded differently to treatment.
Most importantly though, these ratings have allowed us to record subtle changes over time. Many of these scales were developed as antidepressants were discovered and psychotherapy became more widely used, and the scales were used to track how patients improved while on these treatments. With a crude diagnosis, it would be difficult to detect subtle improvements in patients.11
What this means is that the way we conceptualize depression today is not as a fixed condition, but as something that can occur at varying degrees and that can potentially resolve.
People might experience symptoms on some days but not others, and they might have symptoms that become milder with time. The questionnaires we use probe symptoms in a way that measures how they might change, and how they might be treatable.
We’ve seen how depression has been screened in the wider population and how it is measured in a more nuanced way.
But how would we find out whether these questionnaires were actually measuring depression? How would we know that people’s symptoms were being interpreted in a consistent way?
In the 19th and 20th centuries, statisticians began to develop techniques to measure many aspects of questionnaires, so they could refine them. They were interested in understanding how consistently the questions measured the same underlying concept.
They were also concerned with testing how people’s responses on a questionnaire reflected their behavior in the real world. They could do this, for example, by estimating how their scores on a depression questionnaire correlated with their ability to work or study.
They began to put more focus into understanding how much we could rely on the judgment of individual doctors, instead of treating them as infallible experts.
This was important because patients were included in clinical trials based on their scores on these questionnaires. If doctors had wildly different methods of scoring patients on the questionnaires, it would be very hard to compare patients with each other. It would also be hard to compare patients’ scores at the start of a trial to their scores at the end.
Finally, they were interested in understanding how the symptoms of depression related to each other, and whether it was appropriate to simply add up people’s scores into a total. In the 20th century, statisticians developed methods such as factor analysis and item response theory that could be used to dig into these questions.12
These issues are explained in more detail in the box below. Until recently, it was difficult to apply some of these techniques in datasets that had a large number of people or questions because they required a lot of computational power.13
With all of that in mind, what do we know about depression now?
What are the challenges of measuring depression?
First of all, we know that some of the symptoms of depression are common in the population, even among those who do not suffer from depression.
You can see this in the chart below. It lists symptoms of depression and shows responses from the general US population. The questions come from the PHQ-9 (the patient health questionnaire), which is a popular rating scale for depression that is used around the world and covers all the symptoms in the DSM diagnostic criteria for major depression. 14
This questionnaire asks people about how often they have experienced symptoms of depression in the last two weeks. Half of the respondents (51%) had low energy, and more than one-third (37%) had trouble sleeping.15 Sleeping problems and low energy are also some of the most common symptoms in people who are diagnosed with moderate or severe depression.

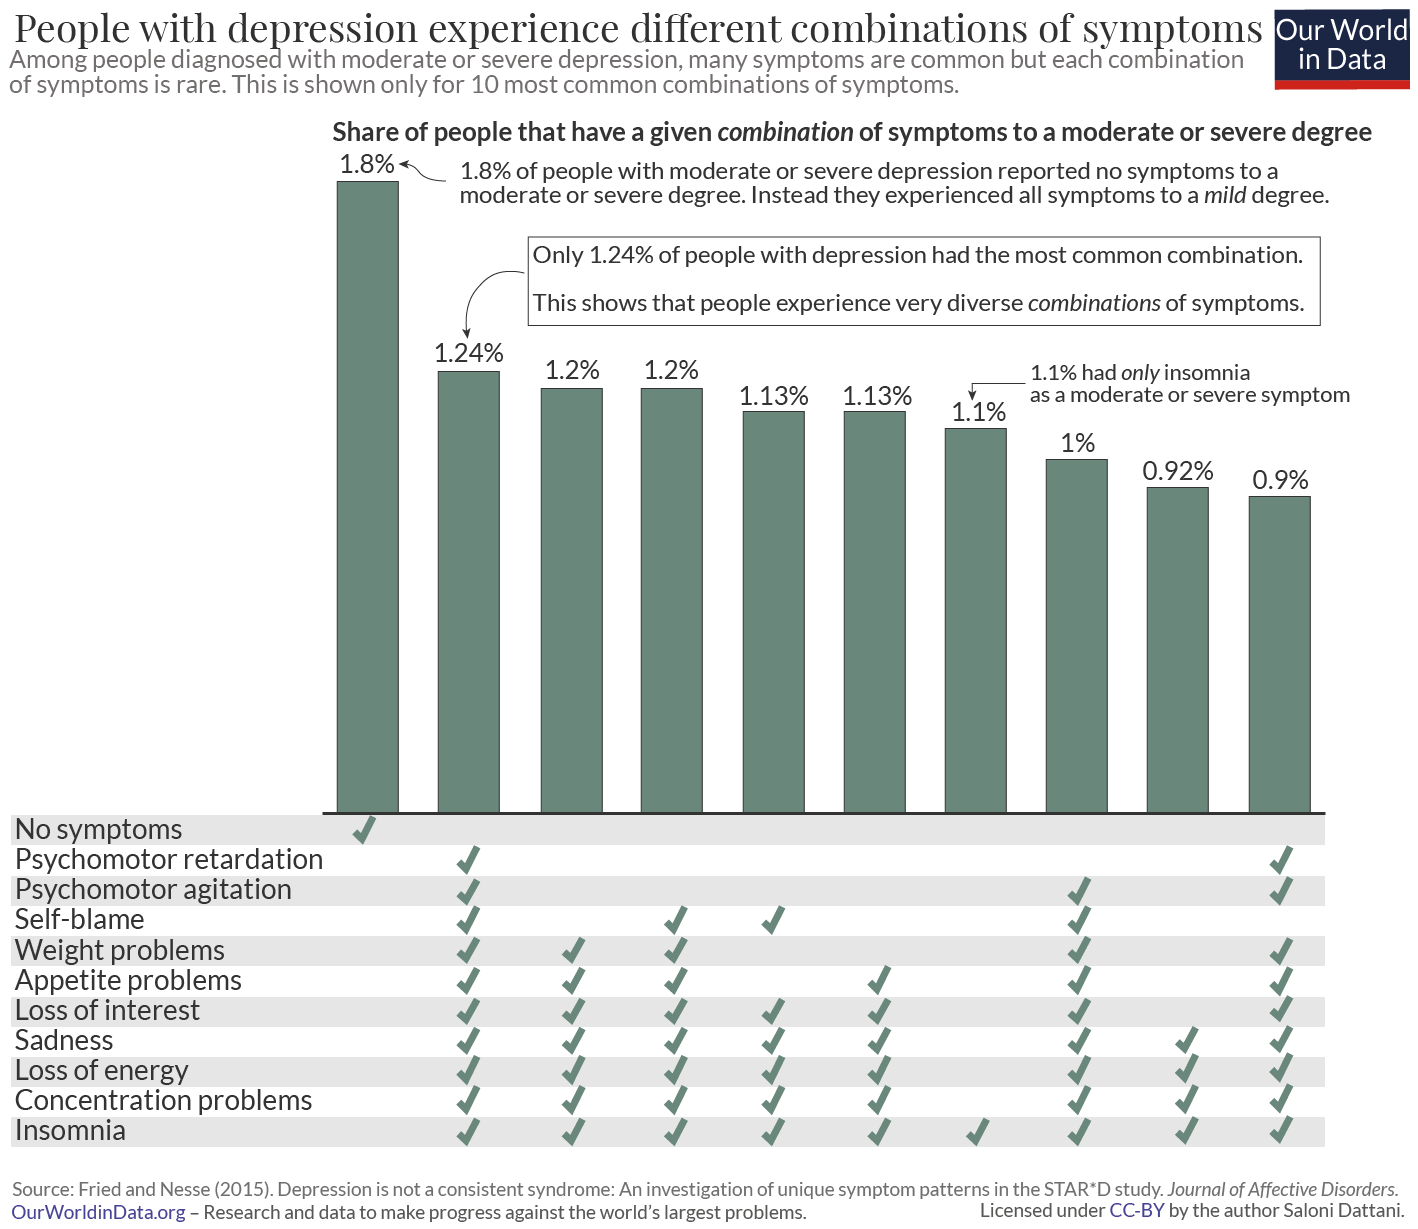
Even though some symptoms are common, depression is complicated. What makes it complicated is not the prevalence of individual symptoms, but rather the differences in the combinations of symptoms that patients experience. We see these combinations in the chart below, using symptoms in the Quick Inventory of Depressive Symptoms (QIDS-16), another questionnaire that covers all of the symptoms of depression in the DSM.16
On the horizontal bars, you can see which symptoms patients have. In this chart, symptoms are marked as present if people experienced them to a moderate or severe degree.
The first thing to notice in this chart is that patients can experience many combinations of symptoms. What’s surprising is how uncommon each combination is. The most common combination is experienced by less than 2% of patients. The combinations of people’s symptoms vary widely.
The second thing to notice is that the most widely reported combination is, in fact, no symptoms at all. This is shown as ‘none’ in the chart. Many patients were diagnosed with moderate or severe depression but didn’t report having any of the individual symptoms to a moderate or severe degree. Instead, patients with the profile of “none” had all of the symptoms to a mild degree. This gave them a total score that was high, and meant they would still be considered to have moderate or even severe depression.
Think about the way that depression questionnaires are scored: each item is rated on a scale and the ratings across all the scales are added together.
This means that people can end up with a high total by rating many symptoms at a ‘mild’ level, or by rating some symptoms ‘severe’ and others ‘absent’, or something in between.
You might wonder if we should treat these different possibilities as equivalent to each other.
Is this a bug or a feature of questionnaires?
If it was a feature, it would imply that when people are mildly depressed, they would probably only experience a few symptoms, such as those that are common, like insomnia. Meanwhile, when people are more severely depressed, they would be more likely to experience more symptoms, including ones that are uncommon, like self-blame and suicidal thoughts.
In the 20th century, statisticians such as Georg Rasch, Jane Loevinger and Robert J Mokken developed models that could be used to test this assumption.
These models test whether people who have uncommon symptoms also have more symptoms overall. They also test whether the scores assigned to each level are appropriate. These assumptions seem to be valid for some questionnaires, including the PHQ-9 and the Hamilton Rating Scale for Depression.17 This means that adding up people’s scores on these questionnaires is an appropriate way to understand how severely they are depressed.
We can find out how people’s responses to questionnaires are related to each other through a method called factor analysis.
Using this method, researchers have usually found that some symptoms are more likely to occur together. In other words, the symptoms are part of groups – they reflect underlying traits called ‘latent factors.’ The latent factors that researchers have usually found are sadness, guilt, changes in sleep and appetite, and despair about the future.18
These latent factors also correlate with each other to a moderate degree, and researchers often find an underlying “general dimension” of depression.
If you knew where someone placed on this general dimension, you would be able to roughly predict which symptoms they had and how many symptoms they had. But their specific symptoms would still be informative and important to understand.
To investigate this more, some researchers use a method called “latent class analysis.” What this does is it tries to identify whether people can be classified into subtypes based on how they respond to questionnaires.
Plenty of studies have used latent class analysis to understand whether there are subtypes of depression. But different studies have identified very different numbers of subtypes, which might be because they analyzed different sets of questions.
Some subtypes relate to how severely people experience depression, while others relate to which symptoms they have. But it is unclear what they mean, how valid some of them are, and how well they have been measured.19 For example, one subtype is called atypical depression, which usually refers to patients who sleep excessively and gain weight.
According to the DSM 5 criteria, people can only be diagnosed with atypical depression if they have ‘mood reactivity’, which refers to when someone can respond positively to good things that happen in their life.
This contrasts with another subtype of depression, called melancholic depression, where people have more severe sadness and find it difficult to feel happy even during these circumstances.
But there is lots of evidence that goes against the idea that mood reactivity is important for identifying people with atypical depression. In other words, people with symptoms of typical or atypical depression are equally likely to have mood reactivity.20
The different subtypes of depression are not stable over time. Studies that follow patients for long periods of time find that those who have multiple episodes of depression tend to fluctuate between having some episodes that are considered typical and others that are considered atypical or melancholic.21
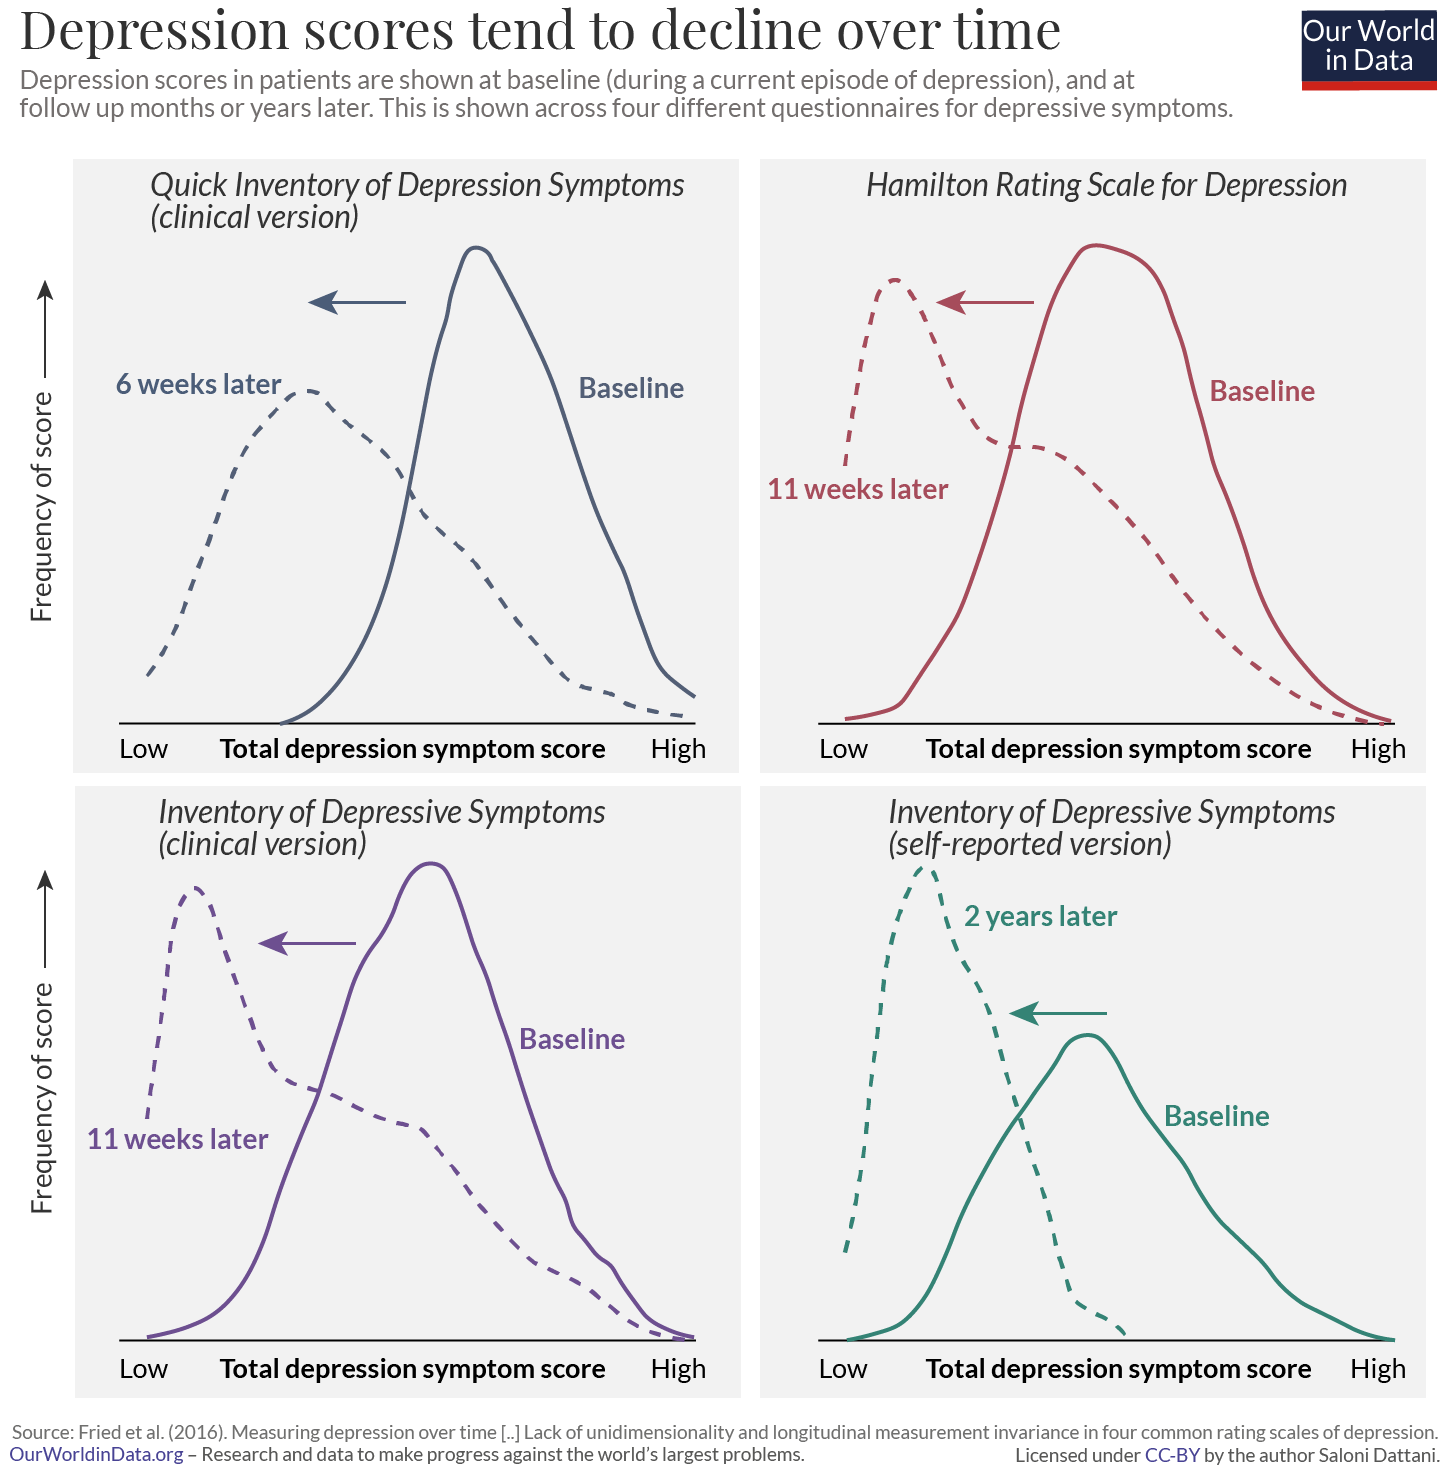
This brings us to another important fact about depression: the symptoms change over time. This is true for which symptoms people report as well as how severe they are.
You can see this in the chart, among people who are diagnosed with depression. Patients’ total scores declined over time after they were diagnosed. The curves of depression scores shift towards the left when patients are surveyed months after the initial questionnaire. This effect is found across many different questionnaires, as shown.
One explanation for this is that their symptoms become milder over time. For example, patients are likely to seek help when they have very severe symptoms, which would become milder later on. This is known as ‘regression to the mean.’ Another explanation is that there is a change in the combination of symptoms they report.22
Some people have episodes of depression frequently. We know this because researchers have regularly interviewed the same people over many years. This gives us more accurate results than relying on them to remember which symptoms they had in the past. One study tracked people’s symptoms over a period of more than thirteen years.23 It took the average person two to three years after their first depressive episode to have a year without depression. This measure – of how long it takes until the average person has a full year without depression – is known as the ‘median time to recovery’.
People’s experiences of depression varied widely. Half of the patients recovered within the same year. In contrast, a small proportion of patients (15%) did not recover even more than 20 years later; they had depression in every year of the study. You can see this in the chart.
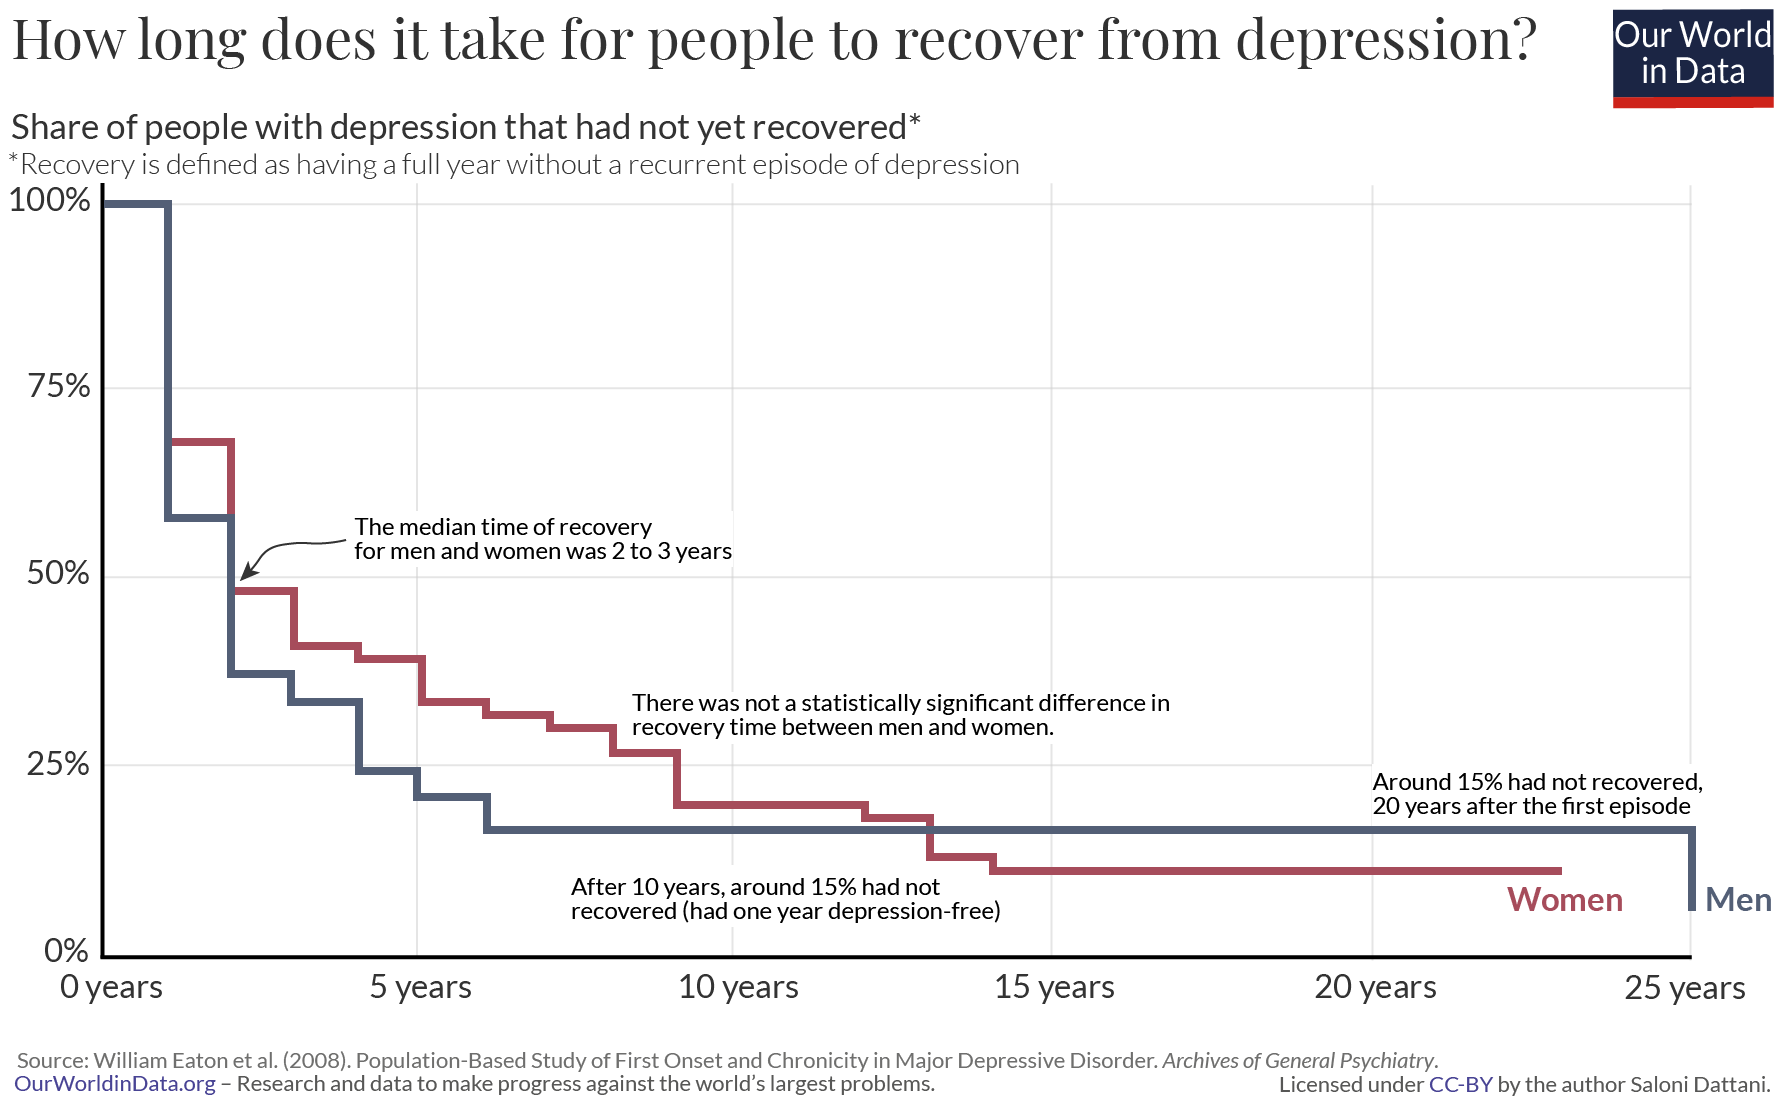
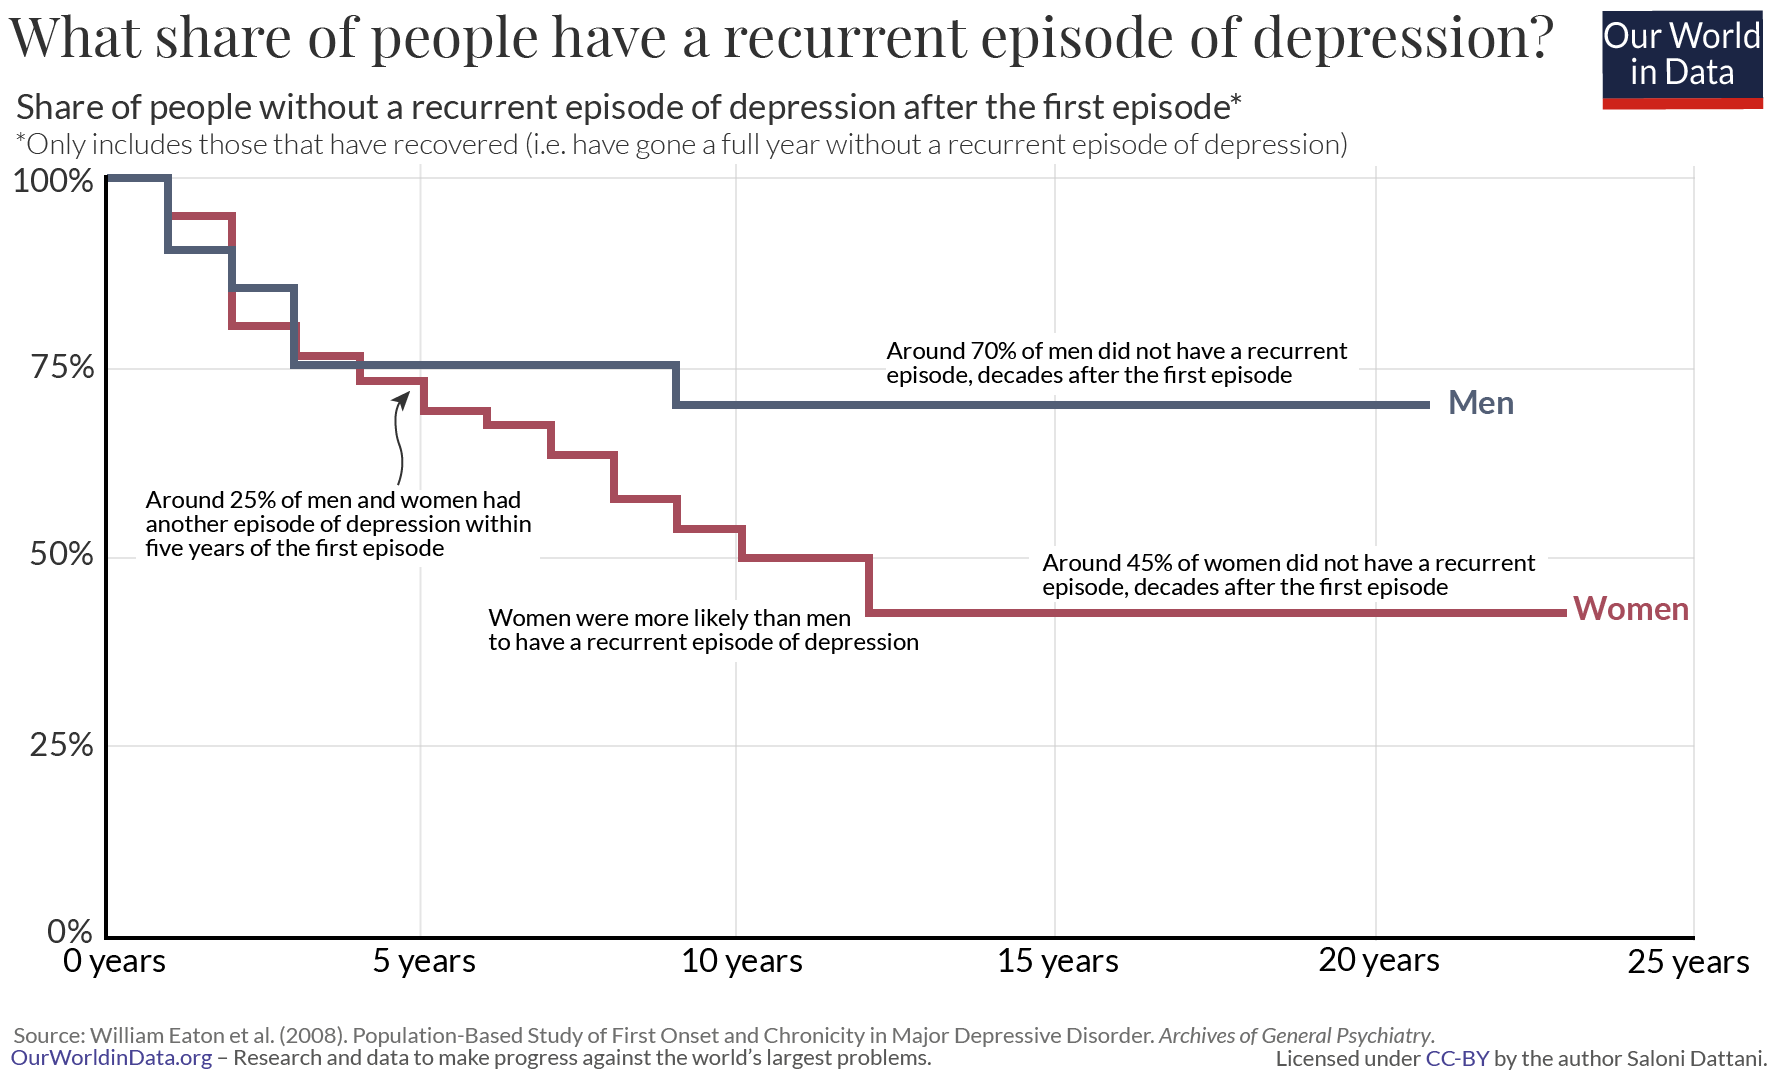
Even among those that recovered, almost half (45%) had another episode of depression during the period of the study.
What all of this tells us is that the condition can progress in different ways.
Some people experience episodes very infrequently: possibly only a single episode followed by years or decades without any recurrences. Others have episodes frequently.
Apart from having episodes of depression frequently, some people also have episodes that last for years.
The DSM criteria requires patients to have symptoms of depression for at least two weeks before they can be diagnosed, but an episode of depression lasts around three months on average. 24 There is a lot of variation between people. When people have episodes that last over two years, their condition is labeled chronic depression.
Is there something different about these patients?
People who have chronic depression tend to be different from the average patient in several ways. They are more likely to also have other conditions, such as anxiety disorder, and more likely to have a family history of mental illness. They are also more likely to have had depression for the first time when they were young, typically under the age of 25.25
This is another way that depression is complex: it occurs at widely different times in people’s lives. The most likely age when people develop depression for the first time (the modal age of onset) is around 19. 26 But most patients develop it much later than this. In this meta-analysis, the median age of onset was around 31, while a quarter of people developed depression for the first time when they were older than 46 years old. There are large differences in the age of onset, as you can see in the chart.
How do we pull this knowledge together to understand depression as a whole?
One simple way to think about depression is to imagine episodes as a series of waves (shown below), where each episode lasts for weeks or months, before the episode ends.
For some people, this will be their only experience of depression for years, possibly ever. After a single wave of symptoms, they will have recovered.
For others, even after an episode of severe depression, they might still have a high baseline level of symptoms. Their level of “normalcy” might still be mild depression.
In this way, we can think of people’s symptoms getting progressively worse during an episode, improving, and potentially worsening again, resulting in a relapse.
Episodes of depression can last different lengths of time. Some people will have episodes that are mild, while others will have episodes that are severe. Many will have a combination of mild and severe episodes. Some will experience many episodes of depression, while others will only experience one episode or none at all.
Depression is one of the most common mental health conditions in the world, so the intricacies of the condition have important consequences for a large number of people. Our understanding of depression influences how we diagnose the condition. It influences how we manage and treat it, and how we track changes in its levels over time.
There is a lot we already know about depression, but there is still a lot that is less clear.
Depression is a condition of the mind, which makes it difficult to study. We still have to rely on people to report their symptoms accurately. Studies have suggested there are many subtypes of depression, but we have limited information on how valid they all are and how to define them.
Depression is a condition of the mind, but that doesn’t mean it’s impossible to understand. With wider surveys, granular scales and more rigorous analysis, we’re uncovering just how complex this condition is. We’re able to find out how the symptoms are related to each other and how common they are.
We now know that people with depression experience different symptoms, with different levels of severity, at different times in their lives, and have episodes lasting different lengths of time. People’s symptoms vary and change over time and we can now measure how that happens.
In the following posts, we’ll explore more of these topics in detail. We’ll see how common depression is and how it varies between people.
We’ll look into antidepressant medication: how it is prescribed, how many people use it, and how effective it is. Finally, we’ll find out what we don’t know about depression and antidepressants, and why it has been difficult to answer many important questions about this condition that affects so many people worldwide.
Anxiety disorders arise in a number of forms including phobic, social, obsessive compulsive (OCD), post-traumatic disorder (PTSD), or generalized anxiety disorders.
The symptoms and diagnostic criteria for each subset of anxiety disorders are unique. However, collectively the WHO’s International Classification of Diseases (ICD-10) note frequent symptoms of:
“(a) apprehension (worries about future misfortunes, feeling “on edge”, difficulty in concentrating, etc.);
(b) motor tension (restless fidgeting, tension headaches, trembling, inability to relax);
(c) autonomic overactivity (lightheadedness, sweating, tachycardia or tachypnoea, epigastric discomfort, dizziness, dry mouth, etc.).”
The series of charts here present global data on the prevalence and disease burden which results from this range of anxiety disorders.
The prevalence of anxiety disorders across the world varies from 2.5 to 7 percent by country. Globally an estimated 284 million people experienced an anxiety disorder in 2017, making it the most prevalent mental health or neurodevelopmental disorder. Around 63 percent (179 million) were female, relative to 105 million males.


In all countries women are more likely to experience anxiety disorders than men. Prevalence trends by age can be found here.
Bipolar disorder (also termed bipolar affective disorder) is defined by the WHO’s International Classification of Diseases (ICD-10) as follows:
“This disorder is characterized by repeated (i.e. at least two) episodes in which the patient’s mood and activity levels are significantly disturbed, this disturbance consisting on some occasions of an elevation of mood and increased energy and activity (mania or hypomania), and on others of a lowering of mood and decreased energy and activity (depression). Characteristically, recovery is usually complete between episodes, and the incidence in the two sexes is more nearly equal than in other mood disorders. As patients who suffer only from repeated episodes of mania are comparatively rare, and resemble (in their family history, premorbid personality, age of onset, and long-term prognosis) those who also have at least occasional episodes of depression, such patients are classified as bipolar.”
The charts here present global data on the prevalence and disease burden of bipolar disorder.
The prevalence of bipolar disorder across the world varies from 0.3 to 1.2 percent by country. Globally, an estimated 46 million people in the world had bipolar disorder in 2017, with 52 and 48 percent being female and male, respectively.
In almost all countries women are more likely to experience bipolar disorder than men. Prevalence of bipolar disorder by age can be found here.


Eating disorders are defined as psychiatric conditions defined by patterns of disordered eating. This therefore incorporates a spectrum of disordered eating behaviours. The underlying sources presented here present data only for the disorders of anorexia and bulimia nervosa (as defined below). It is however recognised that a large share of eating disorders fall outwith the definition of either anorexia or bulimia nervosa (these are often termed ‘eating disorders not otherwise specified’; EDNOS) — some estimates report at least 60 percent of eating disorders do not meet the standard criteria.28
It is therefore expected that the data presented below significantly underestimates the true prevalence of eating disorders, since it concerns only clinically-diagnosed anorexia and bulimia nervosa.
“Anorexia nervosa is a disorder exemplified by deliberate weight loss, and associated with undernutrition of varying severity.
For a definite diagnosis, the ICD note that all the following are required:
(a) Body weight is maintained at least 15% below that expected (either lost or never achieved), or Quetelet’s body-mass index4 is 17.5 or less. 4 Quetelet’s body-mass index = weight (kg) to be used for age 16 or more – 139 – Prepubertal patients may show failure to make the expected weight gain during the period of growth;
(b) The weight loss is self-induced by avoidance of “fattening foods”. One or more of the following may also be present: self-induced vomiting; self-induced purging; excessive exercise; use of appetite suppressants and/or diuretics;
(c) There is body-image distortion in the form of a specific psychopathology whereby a dread of fatness persists as an intrusive, overvalued idea and the patient imposes a low weight threshold on himself or herself;
(d) A widespread endocrine disorder involving the hypothalamic – pituitary – gonadal axis is manifest in women as amenorrhoea and in men as a loss of sexual interest and potency. (An apparent exception is the persistence of vaginal bleeds in anorexic women who are receiving replacement hormonal therapy, most commonly taken as a contraceptive pill.) There may also be elevated levels of growth hormone, raised levels of cortisol, changes in the peripheral metabolism of the thyroid hormone, and abnormalities of insulin secretion;
(e) If onset is prepubertal, the sequence of pubertal events is delayed or even arrested (growth ceases; in girls the breasts do not develop and there is a primary amenorrhoea; in boys the genitals remain juvenile). With recovery, puberty is often completed normally, but the menarche is late.”
“Bulimia nervosa is an illness defined by repeated behaviours of overeating, preoccupation with control of body weight, and the adoption of extreme measures to mitigate the impacts of overeating.
For a definite diagnosis, the ICD note that all the following are required:
(a) There is a persistent preoccupation with eating, and an irresistible craving for food; the patient succumbs to episodes of overeating in which large amounts of food are consumed in short periods of time.
(b) The patient attempts to counteract the “fattening” effects of food by one or more of the following: self-induced vomiting; purgative abuse, alternating periods of starvation; use of drugs such as appetite suppressants, thyroid preparations or diuretics. When bulimia occurs in diabetic patients they may choose to neglect their insulin treatment.
(c) The psychopathology consists of a morbid dread of fatness and the patient sets herself or himself a sharply defined weight threshold, well below the premorbid weight that constitutes the optimum or healthy weight in the opinion of the physician. There is often, but not always, a history of an earlier episode of anorexia nervosa, the interval between the two disorders ranging from a few months to several years. This earlier episode may have been fully expressed, or may have assumed a minor cryptic form with a moderate loss of weight and/or a transient phase of amenorrhoea.”
The prevalence of eating disorders (anorexia and bulimia nervosa) ranges from 0.1 to 1 percent by country. Globally an estimated 16 million had clinical anorexia and bulimia nervosa in 2017. Bulimia was more common: around 79 percent had bulimia nervosa.


In every country women are more likely to experience an eating disorder than men. Eating disorders tend to be more common in young adults aged between 15 and 34 years old. Trends in prevalence by age can be found here.
Direct deaths can result from eating disorders through malnutrition and related health complications. The chart shows the estimated number of direct deaths from anorexia and bulimia nervosa. Evidence suggests that having an eating disorder can increase the relative risk of suicide; suicide deaths in this case are not included here.
Trends in death rates from eating disorders can be found here.

Schizophrenia is defined by the IHME based on the definition within the WHO’s International Classification of Diseases (ICD-10) as:
“The normal requirement for a diagnosis of schizophrenia is that a minimum of one very clear symptom (and usually two or more if less clear-cut) belonging to any one of the groups listed as (a) to (d) below, or symptoms from at least two of the groups referred to as (e) to (h), should have been clearly present for most of the time during a period of 1 month or more:
- (a) thought echo, thought insertion or withdrawal, and thought broadcasting;
- (b) delusions of control, influence, or passivity, clearly referred to body or limb movements or specific thoughts, actions, or sensations; delusional perception;
- (c) hallucinatory voices giving a running commentary on the patient’s behaviour, or discussing the patient among themselves, or other types of hallucinatory voices coming from some part of the body;
- (d) persistent delusions of other kinds that are culturally inappropriate and completely impossible, such as religious or political identity, or superhuman powers and – 79 – abilities (e.g. being able to control the weather, or being in communication with aliens from another world);
- (e) persistent hallucinations in any modality, when accompanied either by fleeting or half-formed delusions without clear affective content, or by persistent over-valued ideas, or when occurring every day for weeks or months on end;
- (f) breaks or interpolations in the train of thought, resulting in incoherence or irrelevant speech, or neologisms;
- (g) catatonic behaviour, such as excitement, posturing, or waxy flexibility, negativism, mutism, and stupor;
- (h) “negative” symptoms such as marked apathy, paucity of speech, and blunting or incongruity of emotional responses, usually resulting in social withdrawal and lowering of social performance; it must be clear that these are not due to depression or to neuroleptic medication;
- (i) a significant and consistent change in the overall quality of some aspects of personal behaviour, manifest as loss of interest, aimlessness, idleness, a self-absorbed attitude, and social withdrawal.”
The following charts present global-level data on the prevalence of schizophrenia.
The prevalence of schizophrenia typically ranges from 0.2 to 0.4 percent across countries. It’s estimated that 20 million people in world had schizophrenia in 2017; the number of men and women with schizophrenia was approximately the same (around 10 million each).


Overall the prevalence of schizophrenia is slightly higher in men than women. Prevalence by age can be found here.
Risk factors for mental health
The determinants, onset and severity of mental health disorders are complex – they can rarely be attributed to a single factor. Identifying potential risk factors form an important element of health research, potential prevention and in some cases, appropriate treatment; nonetheless, many risk factors remain only correlates of observed patterns in mental health. They therefore need to be interpreted carefully.
The World Health Organization synthesize the potential contributors to mental health and wellbeing into three categories:29
- individual attributes and behaviours: these can be particular genetic factors or personality traits;
- social and economic circumstances;
- environmental factors.
In the table we see the WHO’s breakdown of potential adverse and protective factors for mental health within these three categories. These factors often interact, compound or negate one another and should therefore not be considered as individual traits or exposures. For example, particular individual traits may make a given person more vulnerable to mental health disorders with the onset of a particular economic or social scenario — the instance of one does not necessarily result in a mental health disorder, but combined there is a significantly higher vulnerability.
| Level | Adverse Factors | Protective Factors |
|---|---|---|
| Individual attributes | Low self-esteem | Self-esteem, confidence |
| Cognitive/emotional immaturity | Ability to solve problems & manage stress or adversity | |
| Difficulties in communicating | Communication skills | |
| Medical illness, substance use | Physical health, fitness | |
| Social circumstances | Loneliness, bereavement | Social support of family & friends |
| Neglect, family conflict | Good parenting/family interaction | |
| Exposure to violence/abuse | Physical security & safety | |
| Low income & poverty | Economic security | |
| Difficulties or failure at school | Scholastic achievement | |
| Work stress, unemployment | Satisfaction & success at work | |
| Environmental factors | Poor access to basic services | Equality of access to basic services |
| Injustice & discrimination | Social justice, tolerance, integration | |
| Social & gender inequalities | Social & gender equality | |
| Exposure to war or disaster | Physical security & safety |
The risk factors and influencers on mental health vary significantly for an individual as they move through the life-course. The following are acknowledged risk factors for a given stage of life.30
– Pre-conception and pre-natal period
A given individual’s mental health and wellbeing can be influenced by factors present prior to conception or birth. Pregnancies which are unwanted or in adolescence can increase the likelihood of detrimental behaviours of the mother during pregnancy, and the environmental or family conditions of childhood.31
During pregnancy, detrimental behaviours including tobacco, alcohol and drug use can increase the likelihood of later mental health disorders for children; malnutrition, low-birth weight and micronutrient deficiency (for example, iodine deficiency) can also influence later mental health vulnerabilities.32
– Infancy and early childhood
There is a large base of evidence which shows that emotional attachment in early childhood has a considerable impact on later vulnerability to mental health and wellbeing.33 As a result, particular risk factors include separation from the primary caregiver, in some cases post-natal depression in mothers (which can result in sub-optimal attachment), and parents for whom communication and social interaction is challenging. Child maltreatment and neglect has been found to have a significant impact on vulnerabilities to mental wellbeing.34 Malnutrition, poor access to basic services and disease and parasites are also important contributors.
– Childhood
Childhood conditions form a critical component of health and wellbeing later in life. Negative experiences, either at home or outside of the home (for example, bullying in school) can have lifelong impacts on the development of core cognitive and emotional skills. Poor socioeconomic conditions also have a significant effect on vulnerability to mental health disorders; in a study in Sweden, the authors found that children raised in families of poor socioeconomic backgrounds had an increased risk of psychosis.35
Poor economic resources, shown through poor housing conditions for example, can be seen by children as shameful or degrading and affect aspects of childhood learning, communication and interaction with peers.
Children with a parent who has a mental illness or substance use disorder have a higher risk of psychiatric problems themselves.36 This effect between generations can occur as a result of genetic, biological, psychological and social risk factors.
– Adolescence
Adolescence is typically the stage of life where mental health disorders tend to become more apparent. The risk factors and contributors to wellbeing in childhood apply equally to those in adolescence. In addition, several other contributing factors appear. It is in the years of adolescence that the use of substances including alcohol and drugs first appear.
Substance use is particularly hazardous and harmful for adolescents because individuals are still developing both mentally and physically. Peer pressure, and media influences also become more prominent over these years. Exposure to substance use is not only an important risk factor for other mental health disorders, but also linked to poorer educational outcomes, more risky sexual behaviour and increased exposure to violence and conflict.
– Adulthood
Experiences and emotional capabilities developed through childhood and adolescence are important factors in the effect that particular events and scenarios in adulthood have on mental health outcomes.
The WHO highlight that critical to wellbeing in adulthood is the allocation and balance between work and leisure time. Exposure to high stress and anxiety is strongly influenced by the share of time working, caring for others, or time spent in an insecure economic environment. Individuals with poor socioeconomic security, and in particular unemployment, are also at higher risk to mental health disorders.
These factors, balanced with the amount of time spent on ‘consumption’ activities, including leisure time and supportive family and friends, often determine the propensity for poor mental health and wellbeing. Community structures can have a significant positive impact on these outcomes — individuals who have poor access to such communities, either through social exclusion, neighbourhood violence/crime, or lack of respite care have a higher risk of mental health disorders.
Physical health also has an important impact on mental wellbeing; an individual’s ‘physical capital’ can influence their sense of esteem and social inclusion. Individuals with chronic illness or disability are at higher risk of poor mental health; this is particularly true for conditions with high rates of stigmatisation, such as HIV/AIDS.
– Older age
Individuals of older age are of notably high risk of poorer mental health and wellbeing. This typically results from notable changes in life conditions (such as a cease in employment which affects both the feeling of contribution and economic freedom), higher social exclusion, and loneliness. This is particularly true when an older individual begins to lose close family and friends. Bereavement in general is an important predictor of mental health disorders such as depression.
A decline in physical health can have major impacts on life capabilities by affecting an individual’s mobility and freedom. Older individuals are also at higher risk of abuse or neglect from carers and in some cases, family members.
Link between mental health and suicide
The link between mental health and substance use disorders and suicide is well-documented.37 It is however true that not all suicides – or suicide attempts – are attributed to underlying mental health or substance use disorders; as shown in the chart, there is not a direct relationship between mental health prevalence and suicide rates.38
We cover suicide statistics more broadly in our full entry on Suicide, however here we attempt to distil the key findings on the links between mental health and substance use and suicide. Although mental health and substance use disorders is within the top-five causes of disease burden globally (as measured by Disability-Adjusted Life Years; DALYs), accounting for approximately 7 percent of the burden, several authors have highlighted that such figures — since they do not include suicide DALYs — underestimate the true cost of mental health disorders.39
Providing a more accurate estimate of total mental health burden therefore requires some understanding of the connection between these disorders and suicide.
Meta-analyses of psychological autopsy studies of suicide across high-income countries suggest that up to 90 percent of suicides occur as a result of an underlying mental health or substance use disorder.40
While available data and studies are more scarce across lower-to-middle income countries, evidence across countries including China, Taiwan and India suggest that this proportion is significantly lower elsewhere.41
These studies suggest a large number of suicides resultant from the ‘dysphoric affect’ and ‘impulsivity’ (which are not defined as a mental and substance use disorder). In such cases, understanding the nature of self-harm methods between countries is important; in these countries a high percentage of self-harming behaviours are carried out through more lethal methods such as poisoning (often through pesticides) and self-immolation. This means that in a high number of cases self-harming behaviours can prove fatal, even if there was not a clear intent to die.
A study by Ferrari et al. (2015) attempted to determine the share disease burden from suicide which could be attributed to mental health or substance use disorders.42
Based on review across a number of meta-analysis studies the authors estimated that 68 percent of suicides across China, Taiwan and India were attributed to mental health and substance use disorders; across other countries this share was approximately 85 percent. In their estimates of total attributable disease burden, the authors concluded that mental health and substance use disorders were responsible for 62 percent of total DALYs from suicide.

Although the total prevalence of mental health and substance use disorders does not show a direct relationship to suicide rates (as shown in the chart above), there are notable links between specific types of mental health disorders and suicide. In their meta-study of the mental health-suicide relationship, Ferrari et al. (2015) assess the pooled relative risk of suicide across a range of mental health and substance use disorders.43 This represents the increased risk of suicide for those with a particular mental health or substance use disorder.
The figures in the table represent estimates of the increased risk of suicide for an individual with one of the following disorders. An individual with depression, for example, is 20 times more likely to die from suicide than someone without; some with anxiety disorder around 3 times; schizophrenia around 13 times; bipolar disorder 6 times; and anorexia 8 times as likely.
| Disorder | Pooled relative risk (95% UI) |
|---|---|
| Major depressive disorder | 19.9 (9.5-41.7) |
| Anxiety disorder | 2.7 (1.7-4.3) |
| Schizophrenia | 12.6 (11.0-14.5) |
| Bipolar disorder | 5.7 (2.6-12.4) |
| Anorexia nervosa | 7.6 (2.2-25.6) |
| Alcohol dependence | 9.8 (9.0-10.7) |
| Opioid dependence | 6.9 (4.5-10.5) |
| Psychostimultant dependence | 8.2 (3.9-16.9) |
Depression by education level & employment status
The statistics presented in the entry above focus on aggregate estimates of prevalence across total populations. In the chart we present data on depression prevalence across a number of OECD countries, disaggregated by education level and employment status.44 This data is based on self-reported prevalence of depression as requested by surveys. There are multiple reasons why this data may differ from IHME statistics presented above: it is based only on adults aged 25-64 years old, and focuses on self-reported depression only. The lack of differentiation in these surveys between mental health disorders, such as depression, anxiety disorders, and bipolar disorder mean that self-reported depression data may include individuals with these other disorders.
Categories in the chart have been coloured based on education level, with further categorisation based on whether groups are employed, actively seeking employment, and the total of employed, active and unemployed. Across most countries (which you can explore using the “change country” option in the chart) we tend to see the lowest prevalence in depression amongst those with tertiary (postsecondary) education; and highest prevalence in those who did not reach upper secondary education.
It is also notable that the large differences in education level close or disappear when we look only at the sub-group of those employed. Overall, the prevalence of depression appears to be lower in individuals in employment relative to those actively seeking employment, or the total population which also includes the unemployed.

Life satisfaction and mental health
Is the prevalence of mental health disorders reflected in self-reported life satisfaction or happiness? Overall, evidence suggests that there is a negative correlation between prevalence of particular mental health disorders (depression and anxiety have been the most widely assessed) and self-reported life satisfaction. This suggests that life satisfaction and happiness tends to be lower in individuals experiencing particular mental health disorders.
We discuss the link and evidence for this relationship in our entry on Happiness and Life Satisfaction.
Mental health as a risk factor for substance abuse
Mental health is known to be an important risk factor for the development of substance use disorders (either in the form of alcohol or illicit drug dependencies). The increased risk of a substance use disorder varies by mental health disorder type:
- for alcohol dependency the risk is highest in individuals with intermittent explosive disorder, dysthymia, ODD, bipolar disorder and social phobia. This is discussed in our entry on Alcohol Consumption.
- for illicit drug dependency the risk is highest for individuals with intermittent explosive disorder, ADHD, and bipolar disorder. This is discussed in our entry on Substance Use.
Mental health treatment
There are a number of options for mental health treatment and recovery — choice of treatment and its effectiveness will be specific to a number of factors including the mental health disorder, its severity, previous treatment and the individual. There is not a single ‘best approach’ to treatment.
One option for treatment of depression is the prescription of antidepressant drugs. But are antidepressant drugs effective in reducing the severity of depression? In the chart we present the results of the latest and largest meta-analysis on antidepressant drug efficacy to date, as published by Cipriani et al. (2018) in The Lancet.45
This meta-analysis assessed the effectiveness of 21 antidepressant drugs relative to a placebo across 522 trials comprising 116,477 participants. Effectiveness, given as the response rate, was measured by the total number of patients who had a reduction of ≥50% of the total score on a standardised observer-rating scale for depression. The odds-ratio measures the likelihood of a positive response from the antidepressant relative to the placebo (where a value of 2.0 indicates the antidepressant was twice as likely as the placebo).
As shown, all 21 antidepressant drugs were more effective than the placebo in reducing the severity of depression in adults. They did, however, vary in effectiveness. However, this meta-analysis also reported variance in levels of ‘acceptability’, which measures the the proportion of patients who withdrew for any reason (such as side-effects from the antidepressant drug). The use and choice of antidepressants will therefore be specific to the individual dependent on a range of factors and their response to treatment.
How is prevalence defined and measured?
The widespread issue of underreporting means accurate and representative data on the prevalence of disorders is difficult to define. If relying on mental health diagnoses alone, this underestimation would be severe. Prevalence figures would be likely to reflect healthcare spending (which allows for more focus on mental health disorders) rather than giving a representative perspective on differences between countries; high-income countries would likely show significantly higher prevalence as a result of more diagnoses.
The data presented in this entry by the Institute of Health Metrics & Evaluation (IHME) is therefore based on a combination of sources, including medical and national records, epidemiological data, in addition to survey data. Where raw data for a particular country is scarce, epidemiological data and meta-regression models must be used based on available data from neighbouring countries. Data quality issues are described below.
The data presented here therefore offers an estimate (rather than official diagnosis) of mental health prevalence based on medical, epidemiological data, surveys and meta-regression modelling.
Data availability on mental health
The majority of data presented in this entry is based on estimates from the IHME’s Global Burden of Disease (GBD). This is currently one of the only sources which produces global level estimates across most countries on the prevalence and disease burden of mental health and substance use disorders.
Nonetheless, the GBD acknowledges the clear data gaps which exist on mental health prevalence across the world. Despite being the 5th largest disease burden at a global level (and with within the top three across many countries), detailed data is often lacking. This is particularly true of lower-income countries. The Global Burden of Disease note that the range of epidemiological studies they draw upon for global and national estimates are unequally distributed across disorders, age groups, countries and epidemiological parameters.46 Using these studies to provide full coverage of these disorders is challenging.
To overcome these methodological challenges the authors note:
To deal with this issue and be able to include data derived using various study methodologies and designs, GBD 2013 makes use of DisMod-MR, version 2.0, a Bayesian meta-regression tool. The software makes it possible to pool all of the epidemiological data available for a given disorder into a weighted average, while simultaneously adjusting for known sources of variability in estimates reported across studies. If raw data are not available for a given country, the software produces an imputed estimate for each epidemiological parameter based on data available from surrounding countries. This allowed GBD to include estimates for 188 countries.
Comparison of IHME estimates to other sources
In this entry we have focused on data trends published by the Institute of Health Metrics (IHME) Global Burden of Disease study. This is currently the only source which provides estimates for all countries over time, and across the full range of mental health and substance use disorders. The World Health Organization (WHO) publish estimates on depression only; the comparison of depression prevalence from IHME versus WHO is shown in the scatter plot.
A range of national sources also publish estimated prevalence of depression. In many cases, the ‘boundaries’, or category differentiation in mental health disorders is different from IHME estimates. They are often therefore not directly comparable. For example, the Center for Diseases Control (CDC) in the United States provides information and estimates on combined depression and anxiety disorders, treating anxiety as a subset of depression.

- Data: Deaths, DALYs and prevalence of mental health and substance use disorders, by age and sex
- Geographical coverage: Global by country and region
- Time span: 1990 – 2016
- Available at: http://ghdx.healthdata.org/gbd-results-tool
World Health Organization. (1992). The ICD-10 classification of mental and behavioural disorders: clinical descriptions and diagnostic guidelines (Vol. 1). World Health Organization.
- Data: Definitions and classifications of mental and substance use disorders
- Available at: ICD-10 Classification of Mental and Behavioural Disorders
- Data: Prevalence of depression
- Geographical coverage: Global by country
- Time span: 2015
- Available at: WHO Global Health Observatory (GHO)
- Information: Suicide prevention, awareness and support in addition to support on a range of mental health disorders
- Available at: http://suicide.org/
- Information: Free online support groups for individuals with a range of mental health, substance use and neurodevelopmental disorders (among other health conditions)
- Available at: https://online.supportgroups.com/
- Information: Guidance and support on depression and anxiety.
- Available at: https://www.cdc.gov/tobacco/campaign/tips/diseases/depression-anxiety.html
- Information: Factsheets on mental health
- Available at: https://www.cdc.gov/nchs/fastats/mental-health.htm
- Information: Research, education and project on closing inequities in mental health treatment
- Available at: https://www.centreforglobalmentalhealth.org/
- Information: Global network of individuals and organisations aiming to provide global coverage of mental health services
- Available at: http://www.globalmentalhealth.org//