Death by suicide is an extremely complex issue that causes pain to hundreds of thousands of people every year around the world. The objective of this data entry is to contribute to an informed, open debate about ways to prevent suicide. If you are dealing with suicidal thoughts you can receive immediate help by visiting resources such as Suicide.org, or by calling 1-800-SUICIDE in the US.
Every suicide is a tragedy. The World Health Organization (WHO) and the Global Burden of Disease study estimate that almost 800,000 people die from suicide every year.1,2 That’s one person every 40 seconds.
With timely, evidence-based interventions, suicides can be prevented.
Summary
- Globally 800,000 people die from suicide every year – that’s twice the number from homicide.
- Suicide is one of the leading causes of death in young people.
- 1.4% of global deaths in 2017 were from suicide. In some countries, this share is as high as 5%.
- Suicide rates are typically higher for older individuals.
- Globally, the suicide rate for men is twice as high as for women. In many countries this ratio is even higher.
- Suicide rates from firearms are particularly high in the US – 60% of deaths from firearms result from suicide.
- Self-poisoning from pesticides have had a large toll, particularly in low-to-middle income countries. Bans on some pesticides have been effective in reducing suicide rates.
All our charts on Suicide
Globally, close to 800,000 people die from suicide every year.3 That’s one person every 40 seconds.4 Due to the stigma associated with suicide – and the fact that it is illegal in some countries – this figure is also likely to be an underestimate, with some suicides being classified as unintentional injuries.5
The Global Burden of Disease is a major global study on the causes of death and disease published in the medical journal The Lancet.6 These estimates of the annual number of deaths by cause are shown here. This chart is shown for the global total, but can be explored for any country or region using the “change country” toggle.
In the chart we see that the Global Burden of Disease study – alongside the World Health Organization – estimates that close to 800,000 people die from suicide each year.
This makes it one of the leading causes of death globally. Around twice as many die from suicide as from homicide. Suicide is more common than homicide across most countries in the world – often as much as ten to twenty times higher.

Globally, 1.4% of deaths were from suicide in 2017.
In the map here we see suicides as a share of total deaths for countries across the world.
There is a ten-fold difference in this share across the world. At the highest end, 5% of deaths in South Korea in 2017 were from suicide; 3.9% in Qatar; and 3.6% in Sri Lanka.
In Greece this share is ten times lower, at 0.4%. In Indonesia, it’s 0.5%.

Looking at suicide as a share of total death is one way to compare differences across the world. However, this does not gives us a direct comparison of suicide between countries – this share will also be influenced by the magnitude of other causes of death.
To get an isolated comparison of suicide across the world we can use suicide rates – these measure the number of suicides per 100,000 people in a given population.
Globally, 10 people per 100,000 died from suicide in 2017. In the map we show the differences in suicide rates across the world.
Suicide rates range from approximately over 20 per 100,000 across Eastern Europe, South Korea, Zimbabwe, Guyana and Suriname to less than 5 per 100,000 across North Africa, the Middle East, Indonesia, Peru and some Mediterranean countries.
Related chart – number of deaths from suicide by country. This map shows the annual number of deaths from suicide across the world.

Have suicide rates increased or decreased in recent decades?
In the scatterplot we see the comparison of suicide rates across countries in the 1990 (shown on the y-axis) and 2017 (on the x-axis). The grey line here represents parity: countries that lie along this line would have the same rates in 2017 as they did in 1990. Countries which lie above the grey line had higher rates in 1990; and vice versa for countries below the line.
Here we see the overall picture is mixed: the majority of countries lie above the grey line, meaning suicide rates have fallen since 1990. But a significant number fall below it, indicating an increase over this period. Most countries in Europe have seen a decline in suicide rates; Asia too has seen impressive declines. Across other regions, the trend has been more varied.
Related chart – suicide rates since 1950 for select countries. This chart provides available estimates from the WHO on suicide rates from 1950 to 2005.

Suicide rates by age
Suicide is one of the leading causes of death in young people.
But this does not necessarily mean suicide is more likely to occur in young people than old – it’s largely a reflection of the fact that older populations also die from many other causes. We see this we we look at causes of deaths in people aged 70 years and older: most die from cardiovascular diseases, cancers, dementia and respiratory diseases. The number of suicides are high, but lower than other causes.
In the chart here we see suicide rates broken down by age group. These rates are given as the number of suicide deaths per 100,000 people in a given demographic. Globally, suicide rates are actually highest in people aged 70 years and older. And actually, suicides globally follow a standard pattern of the older the age group, the higher the death rate.
In the interactive chart you can view data for any country or region using the “change country” toggle.
Related chart – number of deaths from suicide by age group. This chart shows the breakdown of annual suicide deaths by broad age category.

Globally, suicide rates in men are just over twice as high as for women. In 2017 – as we see in the visualization – the global suicide rate for women was 6.3 deaths per 100,000; for men, it was just over twice that figure at 13.9 per 100,000.
The difference in rates for males and females can be explored for any country or region on the interactive chart using the “change country” toggle.
But this difference can also be seen on the scatterplot. This chart compares suicide rates in men (shown on the y-axis) versus rates in women (shown on the x-axis). The grey line here represents parity: countries that lie along this line would have the same rates in both men and women. Countries which lie above the grey line had higher rates in men; and vice versa for countries below the line.
Here we see that all countries lie above the grey line: this means that across the world suicide rates are higher for men than for women.


Across all countries, in 2017, suicide rates were higher for men than women. But there is large variation in the extent of this difference between the sexes across the world.
In the map we see the male-to-female suicide ratio: the male divided by the female suicide rate. A figure greater than one means suicide rates were higher in men; the higher the number, the large the difference between the sexes.
The suicide rate in men can be as much as ten times higher than for women. Across Eastern Europe, it’s 6 to 7 times higher. Across most countries in the world it’s in the range of 2 to 4 times higher.
Much smaller differences in the ratio are found across South and East Asia: in Pakistan and Bangladesh there is almost no sex difference; in India the ratio is 1.4; in China it’s 1.6.

Firearms
Firearms are one of the most common suicide methods globally. They are responsible for approximately 8% of global suicide deaths.7 But they play a much larger role in some countries.
In the map here we see differences in the suicide rate from firearms across the world; it is expressed as the number of suicide deaths per 100,000 individuals in a given population.
What stands out clearly is the very high firearm suicide rate in the United States – at over 6 deaths per 100,000 it’s more than ten times greater than many countries across Europe. In the UK, for example, this rate is more than 30 times lower.
The Global Burden of Disease study estimates that over 24,000 died from firearm suicide in the United States in 2017. The Center for Disease Control and Prevention (CDC) provide similar estimates: 23,854 deaths in 2017. The number of homicides by firearm in the same year was 14,452. This means the number of suicide deaths by firearm greatly outnumber those from homicide: 60% of firearm deaths in the US are from suicides.8
Related chart – number of suicide deaths from firearms. This map shows the number of annual suicide deaths from firearms across the world.

Pesticide poisoning
One of the most common methods of suicide is deliberate poisoning from pesticides.9 Research by David Gunnell and his co-authors estimated that in 1990s and early 2000s, as much as 30% of suicides globally were the result of pesticide poisoning – most in low-to-middle income countries.10
Just over a decade later, with co-authors Ayanthi Karunarathne, Flemming Konradsen, and Michael Eddleston (2019), David Gunnell attempted to quantify the total number of lives lost to suicide from pesticide poisoning since the agricultural Green Revolution.11 They estimate the total number of lives lost to self-poisoning over the period from 1960 to 2018 to be 14 to 15 million. Considering the illegality of suicide in several countries, and poor records of rural deaths, this is still likely to be an underestimate. As the authors note for context: 14 million is more than the death toll of World War I; and approximately half the number killed from HIV/AIDS.
The issue of pesticide poisoning has, however, received much less attention as a preventable health outcome.
Partly owing to restrictions and the banning of pesticides – alongside overall declines in suicide rates in countries where pesticides were widely used – suicide rates from pesticides have declined in recent years. They are, however, still high.
In the visualization we see estimates of the share of suicides globally and by region that were the result of pesticide poisoning. This research was carried out by Emma Mew et al. (2017) based on a systematic review of WHO records and the literature.12 13.7% – around one-in-seven – suicides in the world were the result self-poisoning from pesticides in 2014. This was approximately 110,000 deaths.
In some regions this share was much higher: almost half across the Western Pacific (such as China, Malaysia, Vietnam and the Pacific Islands) were from pesticides. Pesticide poisoning was also a common methods in South-East Asia, and Latin America. It was much less common across Europe, North America and other high-income countries.
Related chart – number of deaths from suicide self-poisoning. This chart shows estimates of the number of suicide deaths from pesticides in 2014 globally and by region.

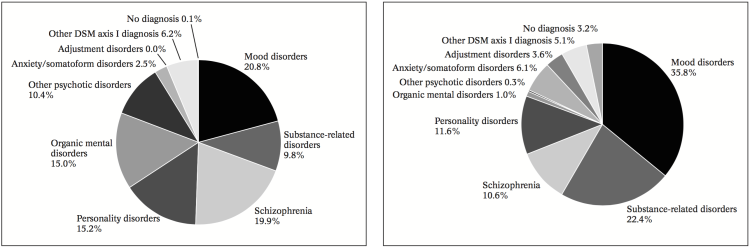
Depression and other mood disorders are widely recognized among the most important risk factors for suicide. Bertolote and Fleischmann (2002), for instance, provide a systematic review of studies reporting diagnoses of mental disorders for individuals dying from suicide, and discuss the implications of psychiatric diagnosis for suicide prevention.13 They report that 98% of those who died by suicide had a diagnosable mental disorder. The following visualization, taken from their paper, provides details regarding the types of mental disorders in question. The two pie-charts correspond to different population sub-groups: the left chart corresponds to individuals who died by suicide and had been admitted to mental hospitals (labelled as ‘psychiatric inpatient population’), and the right chart corresponds to individuals who died by suicide but had not been admitted to mental hospitals (labelled as ‘general population’). Two points are worth emphasizing: (i) mood disorders – mainly depression – account for the largest share of diagnosed disorders in suicide cases, notably for those individuals who were diagnosed without being admitted to a mental hospital; and (ii) suicide is found associated with a variety of mental disorders. As noted by Bertolote and Fleischmann (2002), each one of the listed mental disorders entails a different therapeutic approach, and hence ‘blanket approaches’ are probably unsound.
Distribution of psychiatric diagnoses of people who died by suicide among psychiatric inpatients (left) and the general population (right) – Figures 4 and 5 in Bertolote and Fleischmann (2002)
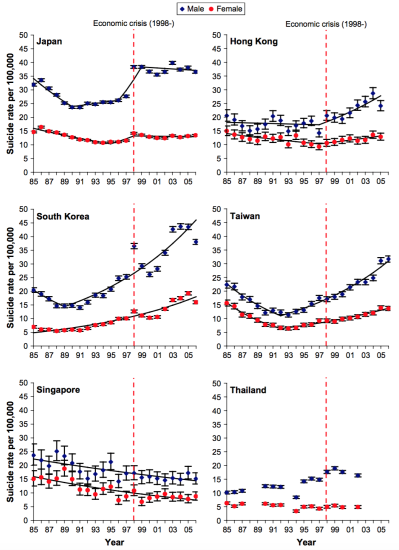
Various studies have analyzed the correlation between economic recessions and suicide rates. Chang et al. (2009)14 used WHO and Taiwanese mortality statistics to explore whether there was a correlation between the Asian economic crisis of 1997-1998 and suicide rates. The following graphs summarize their results. As we can see, male rates in 1998 rose notably in Japan, Hong Kong and Korea, while rises in female rates were less marked in the same countries. Similar patterns in suicide rates were not seen in Taiwan and Singapore, where the economic crisis had a smaller impact on the economy.
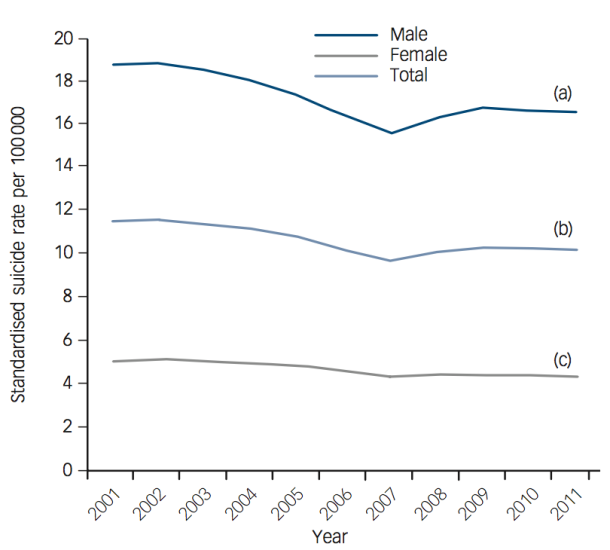
Other studies, such as Reeves, McKee and Stuckler (2014)16, Chang et al. (2013)17 and Nordt et al. (2015)18 have found similar results. The chart by Reeves, McKee and Stuckler (2014) provides descriptive evidence from the Financial crisis of 2007–08 in Europe. As we can see, there is a clear change in suicide trends right after the crisis.
Most of the studies exploring the effect of the economy on suicide tend to focus on patterns for specific events in particular countries or regions. However, more comprehensive studies using cross-country data over several different world regions and over longer time windows find similar results. Recently, Nordt et al. (2015)20 retrospectively analyzed public data for suicide, population, and economy over the period 2000-2011 across 63 countries in four world regions. Their results correspond with previous research indicating that a rise in unemployment is linked to an increase in suicides; however, they find that the relationship is non-linear – the correlation between unemployment and suicide is stronger in countries with a lower rather than with a higher pre-crisis unemployment rate.
Data from the US indicate that firearms account for 46% of all suicides; in other high-income countries where the prevalence of firearms in the household is lower, firearms account for only 4.5% of all suicides.21
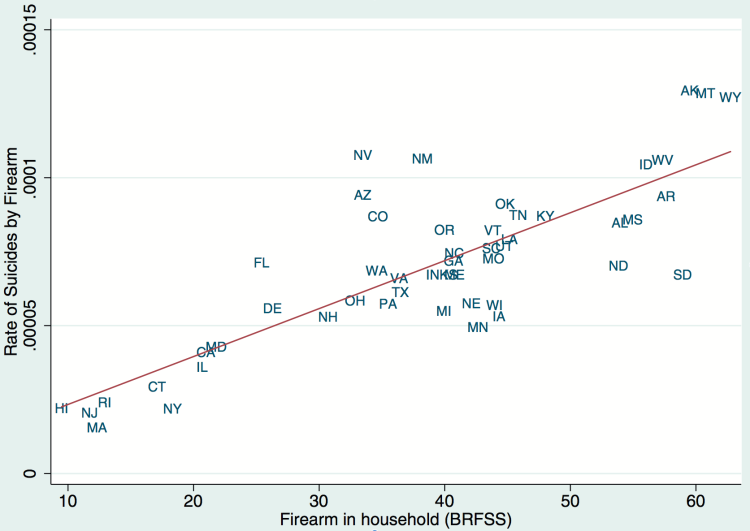
Briggs and Tabarrok (2014)22 investigate the relationship between firearm prevalence and suicide in a sample of all US states over the years 2000–2009. The scatter plot shown here provides evidence of the strong positive correlation that they find. The vertical axis shows the rate of suicide by firearms, and the horizontal axis shows the percent of households that have firearms (according to data from the Behavioral Risk Factor Surveillance System telephone survey conducted by the Center for Disease Control). The authors report that (i) firearms are very strongly related to firearm suicides; (ii) firearms are also strongly related to overall suicides – despite evidence for substantial substitution in method of suicide; and (iii) there is evidence for a diminishing effect of guns on suicides as ownership levels increase.
Scatterplot of rate of suicide by firearm and the prevalence of guns in the household – Briggs and Tabarrok (2013)23
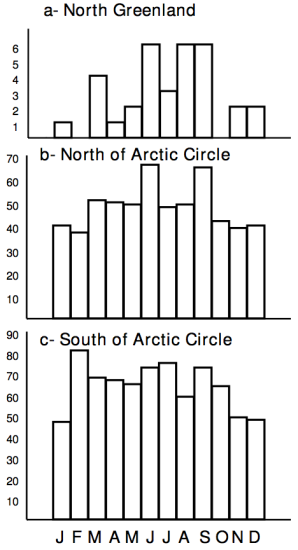
Seasonal variation in suicides has been shown in many countries, with most studies showing spring and summer peaks, contrary to the common belief that suicides peak when nights are longest (see Björkstén et al. (2009)24 and the references therein). Björkstén et al. document the accentuation of suicides – but not homicides – with rising latitudes of Greenland in the sunny months. They find that suicides were more concentrated in the summer months north of the Arctic Circle than south of it, and most concentrated in North Greenland where 48% of suicides occurred during the period of constant light. The following visualization provides evidence supporting these results. It shows the monthly distribution of suicides in different areas of Greenland – the y-axis shows the number of suicide cases and the x-axis shows the corresponding month of the year, from January to December.
Monthly distribution of suicides in areas of Greenland – Björkstén, Kripke and Bjerregaard (2009) 25
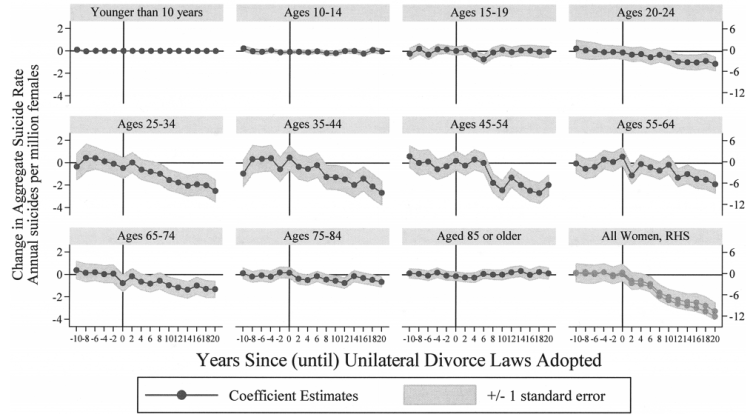
Unilateral divorce is the process in which one can seek the dissolution of one’s marriage without the consent of a spouse. Legal unilateral divorce laws make seeking divorce easier, and is seen as being especially important for people to be able to escape abusive marriages. Stevenson and Wolfers (2006)26 exploit the variation occurring from the different timing of divorce law reforms across the United States to evaluate how unilateral divorce changed family violence and whether the option provided by unilateral divorce reduced suicide and spousal homicide. The authors estimate a regression of suicide rates using the time since (until) the introduction of unilateral divorce as an explanatory variable (conditional on a series of other control variables). The following graphs summarize their results – further technical details are provided in their paper. Each panel shows the effect of unilateral divorce on suicide rates for a specific age group (with the last panel showing the aggregate effect). Specifically, we can see from the second row of this figure that prime-age women account for the bulk of the main effect, with unilateral divorce substantially reducing the suicide rates of women in each of the age groups from 25–65.
Effects of unilateral divorce laws on female suicide by age group – Stevenson and Wolfers (2006)27
A number of empirical studies have found that there is an increase in suicides following media reports of suicide – a relationship referred to as ‘copycat’ behaviour. Gould et al. (2003)28 provide a number of references from the literature on suicide clusters supporting the contention that suicide is “contagious”. Indeed, based on such findings, the WHO has developed guidelines for the reporting of suicides in the media.
In a review of the literature studying the link between media coverage and suicides, Stack (2003)29 analyzes a total of 293 findings from 42 academic studies, concluding that specific media content makes a substantial difference: studies measuring the effect of either an entertainment or political celebrity suicide story were 14.3 times more likely to find a copycat effect than studies that did not; and studies based on a real as opposed to fictional story were 4.03 times more likely to uncover a copycat effect.
More recent studies corroborate this result. Using data from Austria, Niederkrotenthaler (2010)30 find that repetitive reporting of the same suicide and the reporting of suicide myths were positively associated with higher suicide rates; while coverage of positive coping in adverse circumstances – as covered in media items about suicidal ideation (i.e. suicidal thoughts, rather than suicidal behavior) – was negatively associated with suicide rates.
Alcohol abuse is strongly linked to death by suicide. In the US, in 2007 alcohol was involved in approximately a third of reported suicides.31
Indeed, several academic studies have found a positive and significant association between per capita alcohol consumption and male suicide rates in a number of countries.32).
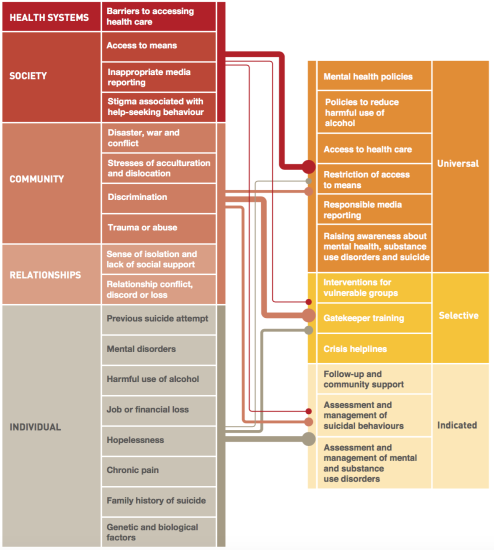
The following chart, taken from the report Preventing suicide: a global imperative, summarizes the key risk factors for suicide – as per the WHO’s analysis of available evidence – aligned with relevant interventions. Its message is clear: to prevent suicide, interventions need to take place from the universal to the individual level. One-size-fits-all approaches are likely to be ineffective.
Key risk factors for suicide aligned with relevant interventions – WHO (2014)33
Measurement
The World Health Organization (WHO) and Institute of Health Metrics and Evaluation (IHME) often report data on self-harm, and use this term interchangeably with the term ‘suicide’. This can be confusing, since self-harm and suicide are not generally considered to be synonyms.
The term self-harm is often used by researchers to denote behaviour that is not explicitly intended to lead to death. Some researchers go further and point out that self-harm and suicide attempts should be distinguished, because self-harm tends to involve more frequent but less severe injuries, so the distinction matters for identifying risk factors and providing help.34
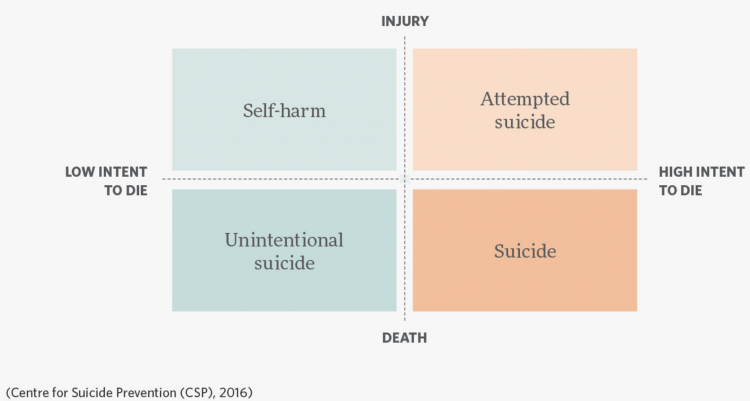
The following diagram, from the Centre for Suicide Prevention – a branch of the Canadian Mental Health Association – provides an idea of how different terms related to self-harm are often used.
Distinguishing the threshold between ‘low’ and ‘high’ intent to die is of course complicated in practice, and because of this, it is not always possible to measure these concepts separately. Indeed, in terms of the data provided by the IHME and the WHO, the terms are used interchangeably, and the variables often capture both intended and unintended deaths.
Self-harm vs Suicide – Centre for Suicide Prevention (2016)
Suicide rates are typically reported as number of deaths per 100,000 people; that is, the number of suicides in a country in a year, divided by the population and multiplied by 100,000.
In the data published by the WHO, suicide rates are ‘age-adjusted’. This means that the figures are adjusted for the corresponding age structure of the relevant population. This is necessary because the numbers of deaths per 100,000 population are influenced by the age distribution – two populations with the same age-specific mortality rates for a particular cause of death will have different overall death rates if the age distributions of their populations are different (for more information see the WHO’s Indicator and Measurement Registry).
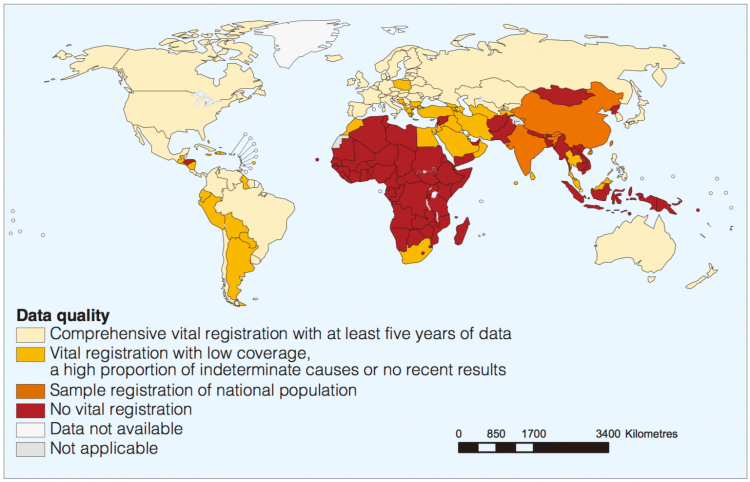
Data quality
Data on suicides is deficient for two important reasons. Firstly, there is a problem with the frequency and reliability of vital registration data in many countries – an issue undermining the quality of mortality estimates in general, not just suicide. The WHO reports that, of its 172 Member States for which suicide estimates are published, only 60 have good-quality vital registration data that can be used directly to estimate suicide rates. The estimated suicide rates in the other 112 Member States (which account for about 71% of global suicides) are based on modelling assumptions. The following visualization, from the WHO, shows the distribution of mortality data quality around the world. As might be expected, good quality vital registration systems are more likely available in high-income countries.
Secondly, there are problems with the accuracy of the official figures made available to WHO by its Member States, since suicide registration is a complicated process involving several responsible authorities with medical and legal concerns. In spite of the fact that in the International Classification of Diseases the category name and code of suicide has remained relatively stable, it is widely accepted that suicide as a cause of death is hidden and underreported for different reasons, notably social and religious attitudes. Moreover, the illegality of suicidal behaviour in some countries contributes to under-reporting and misclassification. According to the WHO, suicides are most commonly found misclassified as “deaths of undetermined intent” and “accidents”.
Quality of Suicide Mortality Data – Map 2 in WHO (2014)35
The World Health Organization compiles and disseminates data on mortality and morbidity reported by its Member States, according to one of its mandates. This is the main source of cross-country data on suicide rates.
- Data: Total deaths by suicide and suicide rates per 100,000 people overall and by age group and sex
- Geographical coverage: 198 countries
- Time span: 1950 onwards
- Available at: The WHO publishes data here. The same data are also made available via Gapminder.org
- Data: Death rates & absolute number of deaths from suicide
- Geographical coverage:Global, across all regions and countries
- Time span: 1990 onwards
- Available at: Online here