This post draws on data and research discussed in our entry on world poverty
–––
The last two centuries have seen a remarkable improvement in living conditions around the world. The chart below shows estimates of the share of the world population living in extreme poverty. As can be seen, in 1820 the vast majority of people in the world lived in conditions that we would call extreme poverty today. Since then, the share of people living in extreme poverty has fallen continuously. This is a remarkable achievement.
Many people are not aware of this decline of extreme poverty. And among those discussing these statistics, significant confusion remains about the extent to which the figures truly reflect changes in poverty over time, rather than changes in income sources. For instance, in a discussion of the below chart on reddit, one user noted: “That is indicative of the fact that quite a lot of the world was enslaved to Colonial powers or did not use fiat currency.” In other words, the argument frequently put forward is that the decline of poverty seen in the chart is an artefact of measuring welfare by relying solely on market transactions, and therefore it fails to take into account non-monetary sources of welfare.
Here we want to briefly explain how long-run estimates for absolute extreme poverty are obtained, and focus on how non-market transactions – specifically non-monetary forms of income, such as subsistence farming – are taken into account.
Our main message is that, despite significant limitations in data quality, it is not the case that the observed progress in the reduction of poverty is an artefact of the estimation methodology.

The most straightforward way to measure poverty is to set a poverty line and to count the number of people living with incomes or consumption-levels below that poverty line. The methodology used by the World Bank to measure extreme poverty today follows this approach.
For the purpose of measuring ‘extreme poverty’, the World Bank currently uses a poverty line equivalent to $1.90 international dollars per day. The metric (‘international dollars’) can be thought of as a hypothetical currency that aims to correct for the changing value of money over time (inflation), as well as for the fact that people in different countries face different price levels. You can read more about this metric in our entry on economic growth.
The level of the ‘international poverty line’ was chosen by the World Bank in a way that reflects the national poverty standards set in the poorest countries for which national poverty lines are available. You can read more about where the poverty line comes from in our entry on world poverty.
Given the metric (international dollars) and the threshold ($1.90), measuring poverty requires one more key ingredient: per capita consumption.
For the recent past (1981 until today), household surveys are the most common source of data to estimate per capita consumption. For the more distant past, the main sources are academic studies that reconstruct historical income levels from cross-country macro estimates on economic output and inequality. Let’s examine each of these sources.
Consumption is defined as “the use of resources whether acquired through purchase (expenditure) or through household production or provided from outside the household, such as by relatives, charities, or the government”. 1
In principle, one could use household surveys to estimate (i) resource outflows (monetary expenditures, home production and transfers); (ii) resource inflows (earnings and other non-market sources of income such as, again, home production and transfers); and (iii) change in assets between the beginning and end of the relevant period (including savings, owned durable goods, etc.).
Given all this information, consumption, as per the definition above, could be estimated directly from (i), or as the difference between (ii) and (iii). Either approach would give the same result. In practice, however, surveys on expenditures are different to surveys on incomes.
For the majority of countries, the World Bank estimates consumption directly from household surveys on expenditures. For a significant minority of countries, however, the World Bank estimates are based on income surveys. Notably, in both cases, the estimation methodology does include home production and transfers, by attaching monetary values to such non-market transactions.
How are monetary values placed on things like food grown at home and gifts from relatives? One common approach is to ask survey-respondents about the amount of such resources consumed over a given reference period. The aim is to then ascribe a monetary value to the reported consumption. This is done by multiplying the consumed amounts by extrapolated market prices. A second approach asks households directly about their own valuation of the amount of money they would expect to pay if they had bought such items themselves, or, the amount of money they would expect to receive if they had sold these items. The second approach is commonly used to establish a rental equivalent for housing and durable goods owned by the household.
How are income and expenditure surveys actually conducted? Different countries use different surveying instruments, and while there is much scope for harmonization (see Beegle et al 20122), there are some basic common features that allow for cross-country comparisons. In most cases, surveys are representative at the national level and record responses provided by ‘primary respondents’ such as the head of the household. Respondents report expenditures (or incomes) either by answering questions from memory (the ‘retrospective recall method’) or by consulting written records (the ‘diary method’). In the case of expenditures, different reference periods are used to record responses across different categories of goods, with longer periods for goods or services that tend to be acquired less frequently.
Clearly, there are several issues with the quality of the estimates that are obtained from applying the various methodologies we have discussed here. And specifically in the context of non-market transactions there are certainly important limitations of the data, independently of the methodology adopted. For example, it is difficult to monetize the private benefits from consuming public goods (e.g. infrastructure such as roads but also education). Yet the fact remains: World Bank global figures on extreme poverty do aim to take into account non-market transactions.
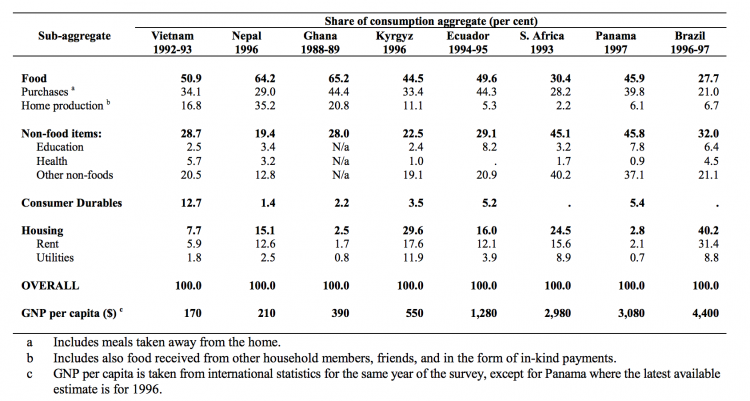
Deaton and Zaidi (2002)3 provide guidelines for constructing consumption aggregates from survey data, specifically in the context of poverty measurement and welfare analysis. The following table, from their paper, provides some details regarding the main components of consumption aggregates in several countries. As can be seen, home-produced food is indeed an important form of consumption captured by household surveys.
Main components of the consumption aggregate – Deaton and Zaidi (2002)4
Historical estimates of poverty come from academic studies that reconstruct income levels in the past, using cross-country macro estimates on economic output and inequality.
A seminal paper following this approach is Bourguignon and Morrison (2002)5 and their work is the source of the estimates for the time 1820 to 1970 shown in the first graph of this text. Bourguignon and Morrison’s starting point is to estimate the global distribution of incomes over time. The change of extreme poverty is then calculated via changes in the share of the world population with incomes below the poverty line, according to the corresponding estimated distribution of incomes.
Bourguignon and Morrison (2002) rely on three types of data in order to estimate the distributions of income: economic output (real GDP per capita), population and inequality. The first two sources provide information regarding ‘the size of the pie’, while the third one provides evidence regarding the distribution of that pie.
The approach outlined above leads to a natural question: How can researchers construct economic output for the distant past? Fouquet and Broadberry (2015)6 provide a detailed account of how economic historians construct these estimates. It is painstaking work with which researchers occupy themselves for years. The generally preferred approach to estimating national income is the output approach, which relies on historical records by economic sector. For example, for agricultural production, researchers use church records for the estates of farmers, as well as accounting documents produced by farmers and kept in local record offices. Agricultural outputs are then calculated by multiplying the acreage for each crop by the yield per acre. Once this is established, prices for individual crops and animal products are used to convert the output into current prices and create weights for an ‘agricultural real output index’. Outputs related to other sectors, such as leather and food processing, are estimated using a similar approach applied for the specifics of each sector. Finally all these series are then brought together using a set of sectoral weights that capture the changing structure of the economy.
Once again, the estimates obtained from applying this methodology are surrounded by a considerable margin of error; but the point we want to emphasize is that those estimates of poverty do take into account non-market transactions such as subsistence farming.
We have already noted that long-run series on poverty combine information from national accounts (macro data) and household surveys (micro data). What is the conceptual relationship between these two sources? This question is particularly relevant for the period after 1981, when both sources become simultaneously available.
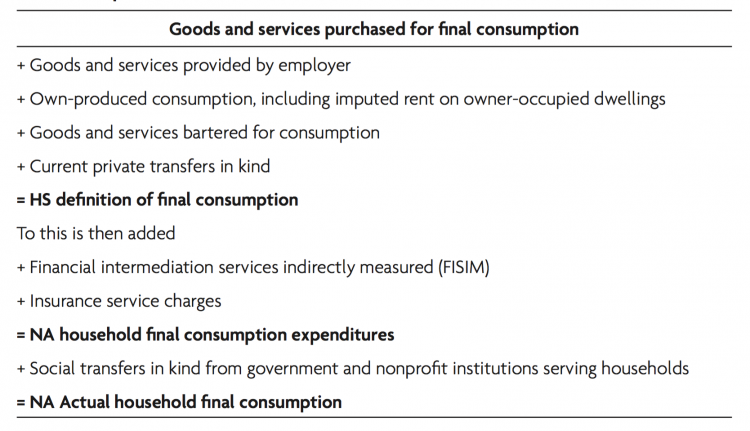
The following table, from Atkinson (2016),7 provides some definitions for household-survey (HS) and national-accounts (NA) concepts of consumption.
The main message from this table – in the context of the question we are trying to answer here – is that there are differences, but in both cases transfers and in-kind incomes are a critical part of the equation.
In our entry on world poverty you can read more about the reliability of national-account poverty estimates vis-a-vis household-survey estimates.
Linking household survey (HS) and national accounts (NA) concepts of consumption – Atkinson (2016)8