Notice: This is only a preliminary collection of relevant material
The data and research currently presented here is a preliminary collection or relevant material. We will further develop our work on this topic in the future (to cover it in the same detail as for example our entry on World Population Growth).
If you have expertise in this area and would like to contribute, apply here to join us as a researcher.
This entry is concerned with primary and secondary education.
Primary school education today is focussed on establishing the fundamental literacy and numeracy skills of children, as well as developing their understanding of the world. For this reason, primary education is compulsory and provided by the state in almost all countries around the world.
The second United Nations Millennium Development Goal was to “ensure that, by 2015, children everywhere, boys and girls alike, will be able to complete a full course of primary schooling.” This goal was missed but significant progress has been made. In 1970, 28% of primary-school-age children in the world were not attending school, today this share has decline to 9% – equivalent to 60 million children not in primary education as the first visualization below shows.
All our charts on Primary and Secondary Education
How many children are not in primary school?
There were 60 million children of primary school age out-of-school in 2014. This number has fallen by 50 million since the late 1990s.
In the chart we see the distribution by world region. More than half (57 percent) of primary-aged children not in school were in Sub-Saharan Africa. This was followed by South Asia at 19 percent.
The trajectory for Sub-Saharan Africa may look stubbornly flat, but the total number of primary school children out-of-school has fallen by 10 million since the late 1990s. Progress in getting children into school is even more marked when we look at the share of children not in school.
As of 2014, 1-in-5 primary aged children in Sub-Saharan Africa were out-of-school. This is unacceptably high. But it’s also a marker of progress: in the mid-1990s 46 percent were not in school — the rate has therefore more than halved within a few decades.
We know that positive change is therefore possible. But without accelerated progress we will be far off-track in meeting our target of free, quality education for all by 2030.

Enrolment in primary school


In this scatter plot you can compare the gross and net enrollment rate in primary education in countries around the world.


Attendance of primary school

The world map of the adjusted net attendance rate is here.
Primary School Completion


How many children are not in primary and secondary school?

Enrolment in secondary education

Completion and attainment of secondary education
The world map shows the estimates by Barro and Lee on the share of the population with secondary education.

Completion rate for secondary education
Shown are the estimates for the lower secondary completion rate for both sexes.
The UNESCO publishes a very patchy dataset on the share of the population with secondary education.

Secondary education enrollment by sex
This chart shows what share of girls among all enrolled secondary education students.
With the time-slider it’s possible to explore how the inequality changed over recent decades.

Historically, formal education was propagated by religious institutions as a way of spreading and preserving their traditions as well as training clergy. Although schools and religious institutions existed long before the 19th century, education was not compulsory and, in the majority of cases, costly. What is more, the value of a child’s labour meant that only the richest families could afford to educate their children, a phenomenon that still exists in many developing countries today.
The chart shows the global development of attainment of at least some basic education. The estimates from the OECD and the IIASA institute show for the global population older than 15 years the share that has not received any formal education. In 1820 this was the huge majority of the world: More than 4 out 5 people alive then had not received any formal education. Over the last 2 centuries this turned around completely and today fewer than 1 out of 5 have received no education at all.

The earliest universal primary education system was established in Prussia by Frederick William in 1717.1
It was greatly expanded during the first half of the 19th Century and later copied by other European nations and the US. While many countries followed suit during the 20th century, others have been much slower at adopting the model of universal education. India only passed laws introducing universal, free and compulsory education in 2009. There also still remain a handful countries that do not have laws making attendance mandatory.

Population having attained at least basic education by region, 1870-2010 – OECD (2014)2
Full screen view Download DataPrivate vs public educational institutions

Future projections of education
Current projections predict that the proportion of people receiving no education at all will converge to zero. By 2050, only five countries are predicted to have a rate of no education above 20%: these are Burkina Faso, Ethiopia, Guinea, Mali and Niger.


Primary Education and Growth
The economics literature has long studied whether the level of education in a country is a determinant of economic growth. Indeed, a number of studies have found that education in the form of cognitive skills –rather than mere school attainment– matters for predicting individual earnings and economic growth. You can read more about this in our related post here.3
His argument rests on the observation that “in the United States and Germany [the] development of widespread formal schooling preceded the onset of modern economic growth.” Furthermore, Easterlin argues that mass (primary) schooling of a “secular and rationalistic type” is the most conducive to economic growth and not simply just education of the elite:
Raising productivity levels involves active participation in new production methods by large numbers of the population—by workers in agriculture, industry, transportation, and so on. This is not to say that secondary and higher education can be ignored; clearly one needs technologists as well as mass education. But increases at higher levels of education typically go together with the expansion of primary education. On the other hand, education of the elite without mass education is unlikely to foster economic growth.
Easterlin suggests that the focus on educating the elite at the expense of the masses in the Ottoman Empire may have contributed to its decline. He also points out that while Spain had relatively high levels of primary education, it was tightly controlled by the Catholic Church and did not teach science, mathematics or other subjects that constitute a modern elementary education. For this reason, by 1900 almost two-thirds of Spain’s population remained illiterate
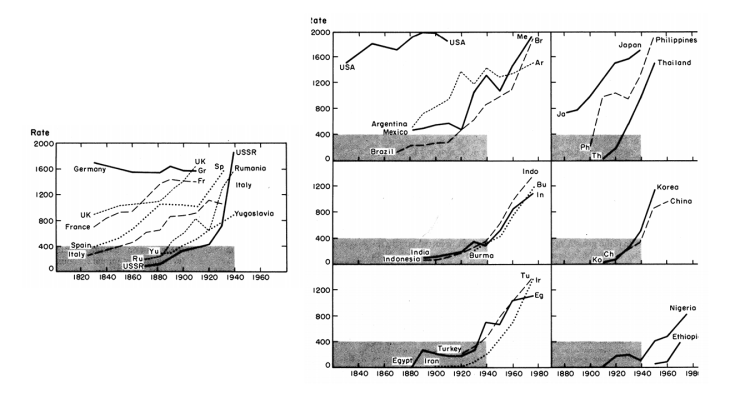
Primary School Enrollment Rate (per 10,000 population) by Country, 1830-1975 – Easterlin (1981)4
Religion, Schooling and Growth
The debate surrounding the link between religion and growth has an interesting history. Max Weber writing in the early 20th Century argued that it was the protestant work ethic that fostered the spirit of capitalism. However, recent empirical tests of this theory have rejected it.
Sascha O. Becker and Ludger Woessmann conducted an empirical test of Weber’s hypothesis in Prussia.5
They conclude that while economic performance was indeed higher in protestant regions, so too was literacy, which explains the gap in economic performance. In particular, “protestant economies prospered because instruction in reading the Bible generated the human capital crucial to economic prosperity.” For more information on literacy, click here.
Returns to Education
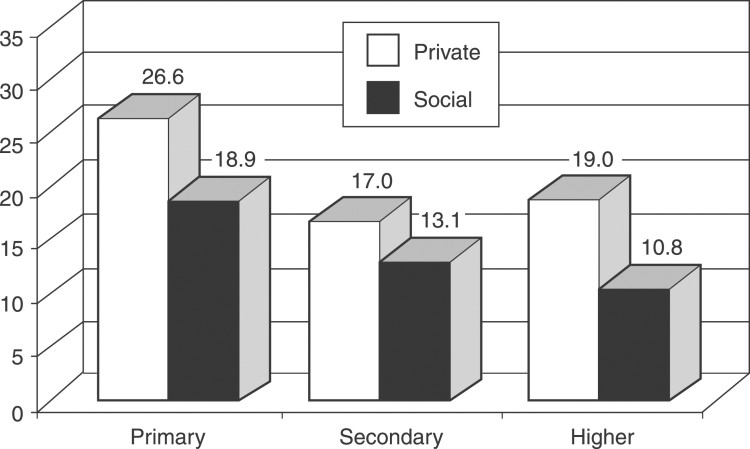
Cross-country estimates of the return to education have found that the highest returns come from primary schooling. The most comprehensive work by George Psacharopoulos finds that the rate of return on primary education to an individual is 26.6%, highlighting the enormous benefits of basic education.6
However, disaggregating the results reveals that for less developed countries this is broadly true, but that in the developed world, the returns to higher education tend to be greater than for primary education.7
This pattern could be explained by the heterogeneous labour market conditions around the world, in particular, the supply of skilled and unskilled labour. For more information on the returns to education, click here.
There exist several ways of measuring enrollment in school:
- Net Enrollment Ratio (NER): is the ratio of enrolled children in the official school age group to the total number of children in the official school age group
- Gross Enrollment Ratio (GER): is the ratio of enrolled children of all ages to the total number of children in the official school age group
In countries where many children enter school later (or repeat grades) the GER can exceed 100%, whereas the NER cannot exceed 100%.
- Data: Comprehensive data on enrollments, out-of-school children, repetition, completion, gender, teachers, education expenditures, learning outcomes, educational attainment, education equality, literacy, population, labor, and EMIS.
- Geographical coverage: Global by country
- Time span: since 1999
- Available at: data.uis.unesco.org
- Data: indicators on educational attainment, enrolment, attendance, teachers, financing and more
- Geographical coverage: Global, over 200 countries
- Time span: 1970 to most recent data year; Projections to 2050
- Available at: It is online here
- Data: Educational attainment disaggregated by age group and gender
- Geographical coverage: 146 countries worldwide
- Time span: since 1950
- Available at: It is online here
- Data: Educational attainment disaggregated by gender and age group as well as future projections
- Geographical coverage: 123 countries worldwide
- Time span: Since 1970 and projections for the coming decades
- Available at: It is online here
- Data: Historical data on per capita GDP, real wages, educational attainment, life expectancy, height, personal security, political institutions, environmental quality, income inequality and gender inequality
- Geographical coverage: Global
- Time span: 1820-2010
- Available at: It is online here. See van Zanden, J., et al. (eds.) (2014) – How Was Life?: Global Well-being since 1820, OECD.
- Data: Key education indicators, measuring school access, participation, completion and progression, learning outcomes, level of resources such as schools and teachers, and other key measures of the education system
- Geographical coverage: Global
- Time span: since 1999
- Available at: It is online here