Notice: This is only a preliminary collection of relevant material
The data and research currently presented here is a preliminary collection or relevant material. We will further develop our work on this topic in the future (to cover it in the same detail as for example our entry on World Population Growth).
If you have expertise in this area and would like to contribute, apply here to join us as a researcher.
Total number of teachers
Schools require many different inputs to produce educated individuals – and teachers are arguably the most fundamental one.
The following chart shows how the recent global expansion of education translated into a growing number of teachers across all levels of education.

Pupil-teacher ratios
In many parts of the world, the recent expansion of education has implied reductions in pupil-teacher ratios. Not everywhere though. In Sub-Saharan Africa, the average number of pupils per teacher in primary education is higher today than two decades ago.
In general, pupil-teacher ratios tend to be lower in richer countries. And cross-country differences can be remarkable. In Norway and Sweden there are on average 9 primary-school students per teacher. In the Central African Republic, there are about 80.


Distribution of teachers by gender & education
About one third of all teachers in the world are primary-school teachers.


As the following map shows, in most countries the majority of teachers in primary education are women.
In almost all countries, however, the share of women teaching in primary education is much higher than the share of women teaching in tertiary education. (You can explore interactive maps showing the gender distribution of teachers in secondary and tertiary education here, and here).

Trained teachers
Directly measuring teacher quality is difficult. Because of this, a common approach is to rely on proxies, such as teacher characteristics (e.g. training, qualifications) and behaviour (e.g. absenteeism).
The following map shows the proportion of primary school teachers who are trained to teach. Although the data is patchy, the map above shows that there are large gaps in some countries. In Ghana, for example, about half of the teachers lack the required pedagogical training.
You can find more data on teacher training, across different education levels, in the following maps:

Qualified teachers
If we look at subject-specific qualifications, rather than general pedagogical training, we find that there are also large gaps in some countries.
As the following chart shows, in some countries the share of teachers with training is high but the share with qualifications is low (e.g. Ethiopia). In other countries the opposite is true, and the share of teachers with training is low but the share with qualifications is high (e.g. Niger). And in some countries, such as Ghana and Sierra Leone, both training and qualifications are low.


The scarcity of teacher preparedness means that in some countries there are, on average, up to a hundred students per qualified teacher.
Whether instructors are trained and qualified to teach depends, to a great extent, on the policies and incentives in place. With this in mind, the Systems Approach for Better Education Results (SABER) ranks countries based on whether they have specific policies aimed at preparing teachers with training and experience. In some countries, teachers face little opportunities for professional development.
The way education systems select, recruit, train and deploy teachers matters.

Absent teachers
In addition to training and qualifications, another way to assess teacher performance is to monitor how teachers work. For example, to monitor absenteeism.
As the following chart shows, teacher absenteeism is an important problem in many countries.
Absenteeism is not only about teachers being absent from school. The next chart shows that even when teachers are present in the schools, often they are still absent from the classrooms.
In practical terms, teacher absenteeism translates into lost teaching time.


The chart compares teacher salaries across a number of countries with available data. As can be seen, there are very large differences in salaries even among countries with similar income levels.
If we look at the share of government spending that goes into paying the salaries of staff in public primary schools, we see that there is also large cross-country heterogeneity. (Here you can explore the same figures for all public education institutions)


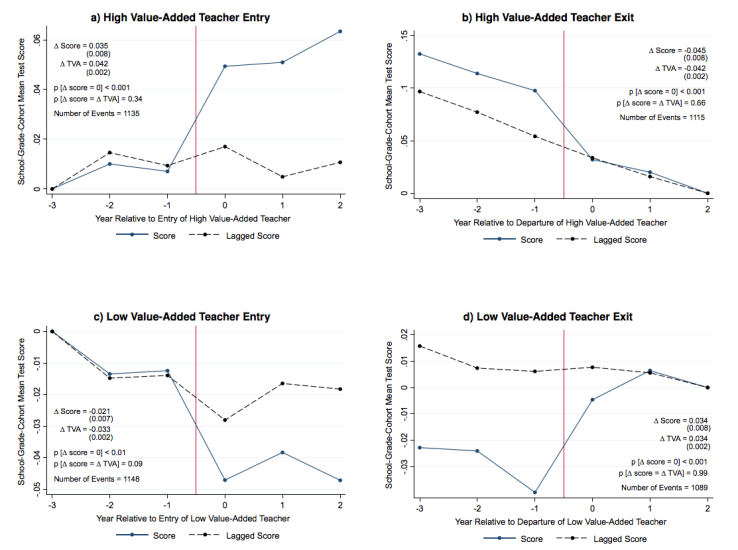
Research by Raj Chetty, John Friedman and Jonah Rockoff supports the idea that the quality of teachers make a significant difference to the performance of students on tests. Chetty et al. look at the impact on test scores of the entry and exit of high or low value added teachers on students performance in examinations. They find that not only does the entry of a high quality teacher improve the results of students, the presence of ‘bad teachers’ negatively impacts the performance of students. In addition to this, they also report that this improvement in test scores corresponds to long-term improvements in the outcomes of students.
Impacts of teacher entry and exit on test scores – Chetty et al. (2014)1