Summary
Working hours for the average worker have decreased dramatically over the last 150 years. This has come from working fewer hours each day, fewer days each week, and fewer weeks each year. While working hours have declined in many countries, particularly today’s richest ones, there are still large differences across and within countries. Studying the amount of time people spend working is crucial not only to understanding economic productivity, but also to understanding economic progress and well-being more generally.
In today’s hustle and bustle world, it’s easy to assume that we are all, by and large, working more than ever. But is that really the case?
As we explain in detail below, the research on the history of working hours shows that this is not the case.
The available data shows that in the 19th century people across the world used to work extremely long hours, but in the last 150 years working hours have decreased substantially, particularly in today’s richest countries.
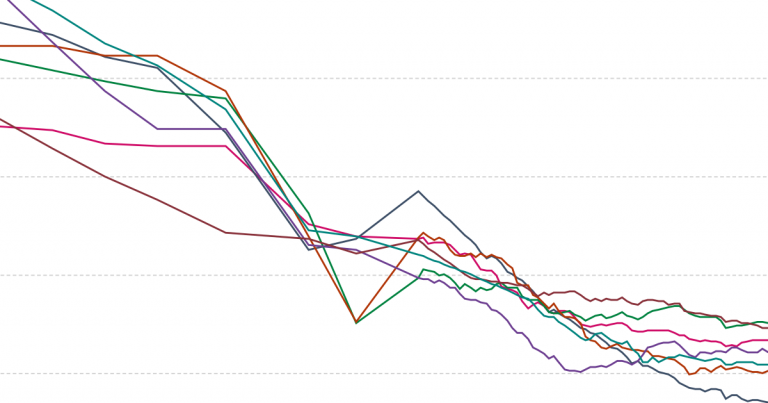
The chart here shows average working hours since 1870 for a selection of countries that industrialized early. You can add or remove countries by clicking Add country on the chart.
We show annual totals, so the trends account for changes in both the length of working days as well as the number of days worked through the year. The data comes from research by the economic historians Michael Huberman and Chris Minns, who have brought together evidence from historical records, National Accounts data, and other sources.1
The chart shows that average working hours declined dramatically for workers in early-industrialized economies over the last 150 years. In 1870, workers in most of these countries worked more than 3,000 hours annually — equivalent to a grueling 60–70 hours each week for 50 weeks per year.
But we see that today those extreme working hours have been roughly cut in half. In Germany, for example, annual working hours decreased by nearly 60% — from 3,284 hours in 1870 to 1,354 hours in 2017 — and in the UK the decrease was around 40%. Before this revolution in working hours people worked as many hours between January and July as we work today in an entire year.2
For many countries in the chart we don’t have long-run series going back to the 19th century. But we do have evidence from other historical records from 1870–1900 that in many of those countries workers also used to work extremely long hours.3
For those countries with long-run data in this chart we can see three distinct periods: From 1870–1913 there was a relatively slow decline; then from 1913–1938 the decline in hours steepened in the midst of the powerful sociopolitical, technological, and economic changes that took shape with World War I, the Great Depression, and the lead-up to World War II; and then after an uptick in hours during and just after World War II, the decline in hours continued for many countries, albeit at a slower pace and with large differences between countries.4

Zooming in to the last 70 years and looking at other countries beyond those who industrialized early, the data reveals a continued decline in working hours for many countries but also large differences between countries.
In the chart here we zoom in to the period since 1950 and we change the selection of countries to highlight some of the diversity in trends.
For some countries, such as Germany, working hours have continued their steep historical decline; while for other countries, such as the US, the decline has leveled off in recent decades.
In some countries we see an inverted U-shaped pattern. In South Korea, for example, hours rose dramatically between 1950 and 1980 before falling again since the mid 1980s. And in other countries we see no recent declines — in China, for example, hours actually rose in the 1990s and early 2000s before leveling off in recent years.

The decline in annual working hours described above has come from fewer working hours each day, as well as fewer working days each week and fewer working weeks in the year.
In a paper analyzing historical data for the US, the economist Dora Costa summarizes the evidence:5
“The length of the work day fell sharply between the 1880s, when the typical worker labored 10 hours a day, 6 days a week, and 1920, when his counterpart worked an 8-hour day, 6 days a week. By 1940 the typical work schedule was 8 hours a day, 5 days a week. Although further reductions in work time largely took the form of increases in vacations, holidays, sick days, personal leave, and earlier retirement, time diary studies suggest that the work day has continued to trend downward less than 8 hours a day.”
As Costa notes, workers had regular days off each week: one day off (usually Sunday) from at least the 1880s until around the 1940s, when two days off became more typical.
In addition to regular days off each week, workers across early-industrialized countries had days off from work for vacations and national holidays. This is shown in the chart here, which again relies on research from Huberman and Minns. The chart shows that days of vacation and holidays increased over the period from 1870–2000. The Netherlands is a stark example — workers there saw an increase from four days off for vacations and holidays in 1870 to almost 38 days off in 2000.
The declines in the length of the work day and the number of working days have been driven by several factors, including increases in productivity and the adoption of regulations that limit working hours. We discuss these and other key drivers behind working hours trends across countries and time in a series of forthcoming posts.6

The evidence presented here comes from decades of work from economic historians and other researchers. Of course, the data is not perfect — as we explain in a forthcoming post, measuring working hours with accuracy is difficult, and surveys and historical records have limitations, so estimates of working hours spanning centuries necessarily come with a margin of error. But for any given country, the changes across time are much larger than the error margins at any point in time: The average worker in a rich country today really does work many fewer hours than the average worker 150 years ago.
As the economists Diane Coyle and Leonard Nakamura explain, the study of working hours is crucial not only to measure macroeconomic productivity, but also to measure economic well-being beyond economic output. A more holistic framework for measuring ‘progress’ needs to consider changes in how people are allowed to allocate their time over multiple activities, among which paid work is only one.7
The available evidence shows that, rather than working more than ever, workers in many countries today work much less than in the past 150 years. There are huge inequalities within and across countries, but substantial progress has been made.
Continue reading Our World in Data: