Time is the ultimate limited resource. Every single one of us has exactly the same “time budget”: 24 hours per day, 365 days per year – 8,760 hours every year of our lives.
How do we actually spend our time? There are many commonalities across the world: we all sleep, work, eat, and enjoy leisure time. But there are also important differences in the freedom people have to spend time on the things they value most. Studying how people across the world spend their time provides an important perspective for understanding living conditions, economic opportunities, and general well-being.
Here we present the data on time use. We explore how it differs across countries and over time and how these differences matter for people’s lives.
Summary
- How people spend their time is similar in many ways across countries: we all sleep, work, eat, and enjoy leisure. But there are also important differences.
- There is a gender gap in leisure time: in all countries surveyed the average leisure time for men is higher than for women.
- Who we spend time with evolves across our lifetimes. As we enter older age we spend an increasing amount of time alone.
- The amount of time parents spend with their kids has been increasing.
- Working hours have decreased dramatically in the last 150 years for workers in many countries.
- But there are still large differences between countries: workers in poorer countries tend to work much more than workers in richer countries.
- The primary way to measure working hours is with surveys, but the data can have limitations that are important to understand.
How do people across the world spend their time and what does this tell us about living conditions?
Sleep, work, eat, leisure – at a high level most of us spend time on similar activities. But just how similar are the daily activities of people across the world? This is something worth considering, not just to serve our curiosity but because differences in the way we spend time give us meaningful perspectives on living conditions, economic opportunities and general well-being.
Here we take a look at the data. We explore some of the key patterns that emerge from cross-country time use surveys, and then dig deeper to understand how these differences matter for people’s well-being.
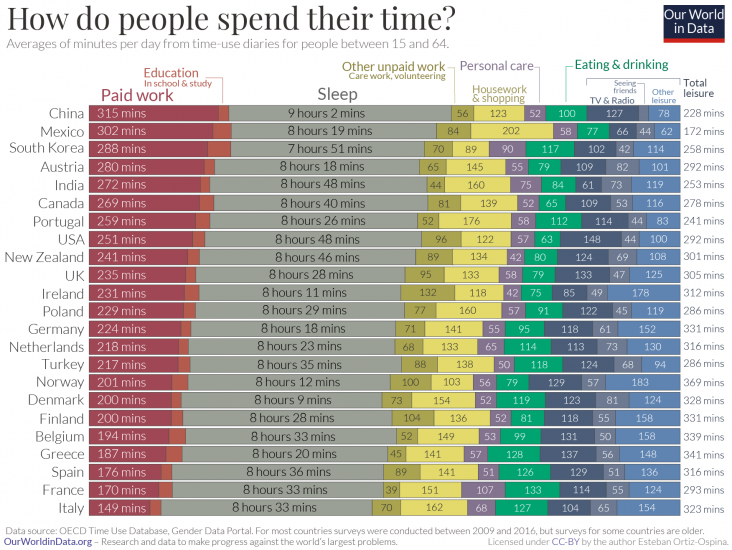
In the chart here we compare average time spent across a number of common activities. The data comes from the OECD and brings together estimates from time diaries where respondents are asked to record the sequence of what they did over a specific day, as well as from general questionnaires where respondents are asked to recall the amount of time spent on different activities on a specific day in the previous week.1
The first thing that jumps out from this chart is that there are indeed many similarities across countries.
This is not surprising – most of us try to split our days into “work, rest and fun”, and so there are some predictable patterns. We spend the most time working and sleeping; and paid work, housework, leisure, eating and sleeping take together 80-90% of the 1440 minutes that we all have available every day.
But if we look closely, we also see some important differences. Consider sleeping, for example. From this sample of countries, South Koreans sleep the least – averaging 7 hours and 51 minutes of sleep every day. In India and the US, at the other end of the spectrum, people sleep an hour more on average.
Work is another important activity where we see large differences. Countries are sorted by paid work hours in the chart – from highest to lowest. In China and Mexico people spend, on an average day, almost twice as much time on paid work as people in Italy and France do. This is a general pattern: People in richer countries can afford to work less. Keep in mind that this chart shows the average for all people in the working age bracket, from 15 to 64 years, whether they are actually employed or not.2
Differences in demographics, education and economic prosperity all contribute to these inequalities in work and time use. But what’s clear in the chart here is that there are also some differences in time use that are not well explained by economic or demographic differences. In the UK, for example, people spend more time working than in France; but in both countries people report spending a similar amount of time on leisure activities.
Cultural differences are likely to play a role here. The French seem to spend much more time eating than the British – and in this respect the data actually goes in line with stereotypes about food culture. People in France, Greece, Italy and Spain report spending more time eating than people in most other European countries. The country where people spend the least time eating and drinking is the USA (63 minutes).
Going beyond national averages reveals important within-country inequalities. The gender gap in leisure time, for example, is a key dimension along which large inequalities exist.
The chart here relies on the same time-use data described above, but shows total leisure time for men and women separately. Time for men is shown on the horizontal axis, while time for women appears on the vertical axis. The dotted diagonal line denotes ‘gender parity’, so the further away a country is from the diagonal line, the larger the difference between men and women.
As we can see, in all countries the average leisure time for men is higher than for women – all bubbles are below the diagonal line – but in some countries the gaps are much larger. In Norway the difference is very small, while in Portugal men report almost 50% more leisure time than women.
A key factor driving these differences in leisure time is the gender gap in unpaid work. As we explain in detail in a companion post, women are responsible for a disproportionate amount of unpaid work, and have less leisure as a result.4

Every single one of us has the same “time budget”: 24 hours per day and 365 days per year. But of course not all of us can choose to spend time on the activities that we enjoy most. Differences in our freedom to allocate time to the things we enjoy is the main reason why time-use data is important for studying living conditions.
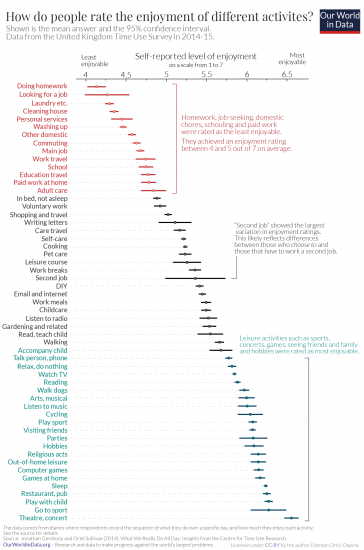
In the UK, researchers from the Centre for Time Use Research linked time-use diaries with the respondents’ assessments of enjoyment, on a scale from 1 to 7, to better understand the connection between time use and well-being. The chart here, which we’ve adapted from the book ‘What We Really Do All Day’, by professors Jonathan Gershuny and Oriel Sullivan, shows the results. The estimates correspond to average reported levels of enjoyment for each activity, with confidence intervals.5
We see that the most enjoyed activities involve rest or leisure activities such as eating out, sleeping, going to sports events, playing computer games or attending cultural performances. The activities receiving the lowest ratings include doing school homework, looking for a job, or doing housework.
The activity where people show the greatest variation in enjoyment is working a “Second Job”. This likely reflects the difference between people who work a second job because they want to, and those who work a second job because they have to.
So what do we learn from this?
First, we learn that the enjoyment of activities is, at least to some degree, predictable and stable. This means we can take activity groups and make meaningful comparisons across groups of people. Economists, for example, often classify any activity with an enjoyment level below work as a “non-leisure activity”, in order to measure trends in leisure across people and time.6
But beyond this, and more importantly, this confirms that time-use is informative about well-being.
The fact that there is a very clear and predictable pattern in the enjoyment of activities suggests that differences in time use do, indeed, give us meaningful perspectives on living conditions and economic opportunities. In countries where people do more paid and unpaid work, and have less time for leisure, their enjoyment – and happiness and life satisfaction – levels are likely to be lower.
How do people rate the enjoyment of different activities?7
Who do we spend time with across our lifetime?
As we go through life we build personal relationships with different people – family, friends, coworkers, partners. These relationships, which are deeply important to all of us, evolve with time. As we grow older we build new relationships while others transform or fade, and towards the end of life many of us spend a lot of time alone.
Taking the big picture over the entire life course: Who do we actually spend our time with?
To understand how social connections evolve throughout our lives we can look at survey data on how much time people spend with others, and who that time is spent with.
The chart here shows the amount of time that people in the US report spending in the company of others, based on their age. The data comes from time-use surveys, where people are asked to list all the activities that they perform over a full day, and the people who were there during each activity. We currently only have data with this granularity for the US – time-use surveys are common across many countries, but what is special about the US is that respondents of the American Time Use Survey are asked to list everyone who was present for each activity.
The numbers in this chart are based on averages for a cross-section of the American society – people are only interviewed once, but we have brought together a decade of surveys, tabulating the average amount of time that survey respondents of different ages report spending with other people.8
Who we spend our time with changes a lot over the course of life
When we’re young – particularly in our teens – we spend a lot of our time with friends, parents, siblings and extended family. As we enter our 20s, time with friends, siblings and parents starts to drop off quickly. Instead, we start spending an increasing amount of time with partners and children. (The chart shows an average across Americans, so for those that have children the time spent with children is even higher, since the average is pulled down by those without children.)
As the chart shows, this continues throughout our 30s, 40s and 50s – over this period of their life, Americans spend much of their time with partners, children and, unsurprisingly, co-workers.
For those 60 and older, we see a significant drop-off in time spent with co-workers. This makes sense, considering many people in the US enter retirement in their mid 60s. We see that this time is partly displaced by more time with partners.
In terms of the diversity of interactions, this chart suggests that the number of people with whom we interact is highest around 40, but then things change substantially after that. And this is perhaps the most conspicuous trend in the chart: above 40, people spend an increasing amount of time alone.

Older people spend a large amount of time alone and it is understandable why – time spent alone increases with age because this is when health typically deteriorates and people lose relatives and friends.
Indeed, many people who are older than 60 live alone as this chart shows clearly: living alone is particularly common for older adults. Today nearly 4 out of every 10 Americans who are older than 89 years old live alone.
Another interesting point here is that the share of people across all age groups who live alone has been increasing over time. This is part of a more general global trend – if you want to read more about the global ‘rise of living alone’, we provide a detailed account of this trend across countries in a companion post.

The data shows that as we become older we tend to spend more and more time alone. What’s more, the data also shows that older people today spend more time alone than older people did in the past.
We might think older people are therefore more lonely – but this is not necessarily the case.
Spending time alone is not the same as feeling lonely. This is a point that is well recognised by researchers, and one which has been confirmed empirically across countries. Surveys that ask people about living arrangements, time use, and feelings of loneliness find that solitude, by itself, is not a good predictor of loneliness. You can read our overview of the evidence in this post.
So, what about loneliness? If we focus on self-reported loneliness, there is little evidence of an upward trend over time in the US; and importantly, it’s not the case that loneliness keeps going up as we become older. In fact a recent study based on surveys that track the same individuals over time found that after age 50 – which is the earliest age of participants in the analysis – loneliness tended to decrease, until about 75, after which it began to increase again.
Taking the evidence together, the message is not that we should be sad about the prospect of aging, but rather that we should recognise the fact that social connections are complex. We often tend to look at the amount of time spent with others as a marker of social well-being; but the quality of time spent with others, and our expectations, matter even more for our feelings of connection and loneliness.
A note about the interpretation of age trends
Are parents spending less time with their kids?
Over the last 50 years many countries have seen large changes in family structures and the institution of marriage. These changes – which include a rise in single-parenting and a large increase in the share of women working outside the home – have made some people worry that children might be getting ‘short-changed’, because parents are not spending as much time with them.
In 1999, for example, a report from the Council of Economic Advisors in the US analyzed trends over the second half of the 20th century and concluded: “The increase in hours mothers spend in paid work, combined with the shift toward single-parent families, resulted in families on average experiencing a decrease of 22 hours a week (14 percent) in parental time available outside of paid work that they could spend with their children.”
The line of thought behind these concerns is that changes to the structure of families and work have meant that children spend less time with parents, because parents – particularly mothers – spend less time at home.
Here we review the evidence and show that this reasoning is flawed. As we explain, in the US and many other rich countries parents spend more time with their kids today than 50 years ago. Equating ‘mother time at home’ with ‘children’s time with parents’ is a huge and unhelpful oversimplification.
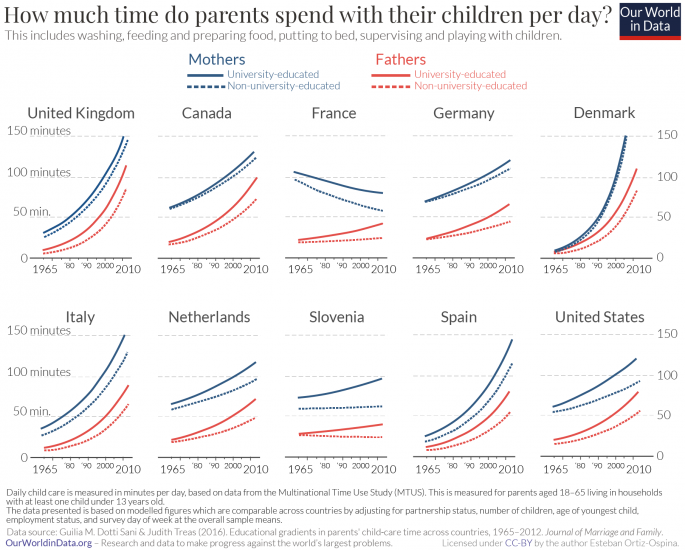
The chart here shows the time that mothers and fathers spend with their children. This is measured using time-use diaries where parents record the amount of time that they spend on various activities, including child care.
These estimates, which are sourced from a paper published in 2016 by sociologists Giulia Dotti Sani and Judith Treas, are disaggregated by education levels and are adjusted to account for demographic differences between countries. We explain below in more detail why these adjustments are important.9
As we can see here, there has been a clear increase in the amount of time parents spend with their children over the last 50 years. This is true for both fathers and mothers, and holds across almost all education groups and countries. The two exceptions are France, where mothers’ time has declined (from a very comparatively high level); and Slovenia where it has remained roughly constant among non-university-educated parents.
In terms of within-country inequalities we also see two clear patterns. First, in all countries mothers spend more time in child care activities than fathers. The differences are large and persistent across education groups. In some countries, such as Canada, France and the US, this gender gap has shrunk; while in other countries such as Denmark and Spain, the gap has widened.
Second, in all countries there is a positive ‘educational gradient’, meaning more educated parents tend to spend more time with their children. In many countries this gradient increased, and nowhere did it decline.
How much time do parents spend with their children per day?10
Digging Deeper: Raw vs Population-adjusted Trends in Time Use

The analysis above looked at time-use diaries from parents. But children may experience time and attention differently from adults. Is there evidence that children also feel they are getting more time with their parents?
In a study published in 2001 in the journal Demography, John Sandberg and Sandra Hofferth analyzed two surveys with data from child time-use diaries in the US, and found that children reported spending about 4.3 more hours per week with mothers, and 3 more hours per week with fathers in 1997 versus 1981.11
The data is sparse because time-use diaries for children are not very common; but the evidence that is available is consistent with what we’ve seen above: Children in the US agree that they’re spending more time with their parents than in the past.
The amount of time that parents spend with their children is determined by many factors, and working hours outside the home are only one of them. Choices, parenting norms, family size, and relationship ideals – for men and women, parents and children – matter a lot.
Several academic studies have dissected the data from the US in an attempt to disentangle the relative importance of different underlying factors. The conclusion from these studies is that the reason why we see an increase in the amount of time that American parents spend with kids is that many families, particularly those who are well-off, have been able to undergo changes in their routines and the allocation of tasks and time within the household, in order to spend more time with their children. Parents have been able to undergo ‘behavioral changes’ that have more than compensated for ‘structural changes’ that could have pushed in the opposite direction.12
Employment, and in particular working hours outside the home, determine a range of possible arrangements, but individual preferences and social conventions determine the actual allocation of time within that range of feasible options.
Preferences and social conventions are dynamic and change with time. There is a large academic literature that emphasizes the importance of parent-child interactions for children’s development, and it seems natural to allow for the possibility that in recent decades parenting norms have undergone considerable change in response to this scientific evidence.13
The available data shows that in many countries parents spend more time with their kids than ever before, and this is partly due to changes in social conventions and economic progress, especially declining working hours.
There are large differences between countries, and also large inequalities across different population groups within each country; but overall the trends tend to go in the same direction.
Of course, there’s a lot that is not being captured by these aggregate statistics. There are important distributional issues, and there is also clearly more to parents’ and children’s welfare than ‘total time spent together’. But despite these limitations, the available research and data still offers a clear lesson: contrary to what some people fear, it’s not the case that children in rich countries are being systematically ‘shortchanged’ by widespread changes in family structures.
Parents are spending more time with their kids than they used to, and this matters because parent-child interactions are important for childhood development.
Are we working more than ever?
In today’s hustle and bustle world, it’s easy to assume that we are all, by and large, working more than ever. But is that really the case?
As we explain in detail below, the research on the history of working hours shows that this is not the case.
The available data shows that in the 19th century people across the world used to work extremely long hours, but in the last 150 years working hours have decreased substantially, particularly in today’s richest countries.
The chart here shows average working hours since 1870 for a selection of countries that industrialized early. You can add or remove countries by clicking Add country on the chart.
We show annual totals, so the trends account for changes in both the length of working days as well as the number of days worked through the year. The data comes from research by the economic historians Michael Huberman and Chris Minns, who have brought together evidence from historical records, National Accounts data, and other sources.14
The chart shows that average working hours declined dramatically for workers in early-industrialized economies over the last 150 years. In 1870, workers in most of these countries worked more than 3,000 hours annually — equivalent to a grueling 60–70 hours each week for 50 weeks per year.
But we see that today those extreme working hours have been roughly cut in half. In Germany, for example, annual working hours decreased by nearly 60% — from 3,284 hours in 1870 to 1,354 hours in 2017 — and in the UK the decrease was around 40%. Before this revolution in working hours people worked as many hours between January and July as we work today in an entire year.15
For many countries in the chart we don’t have long-run series going back to the 19th century. But we do have evidence from other historical records from 1870–1900 that in many of those countries workers also used to work extremely long hours.16
For those countries with long-run data in this chart we can see three distinct periods: From 1870–1913 there was a relatively slow decline; then from 1913–1938 the decline in hours steepened in the midst of the powerful sociopolitical, technological, and economic changes that took shape with World War I, the Great Depression, and the lead-up to World War II; and then after an uptick in hours during and just after World War II, the decline in hours continued for many countries, albeit at a slower pace and with large differences between countries.17

Zooming in to the last 70 years and looking at other countries beyond those who industrialized early, the data reveals a continued decline in working hours for many countries but also large differences between countries.
In the chart here we zoom in to the period since 1950 and we change the selection of countries to highlight some of the diversity in trends.
For some countries, such as Germany, working hours have continued their steep historical decline; while for other countries, such as the US, the decline has leveled off in recent decades.
In some countries we see an inverted U-shaped pattern. In South Korea, for example, hours rose dramatically between 1950 and 1980 before falling again since the mid 1980s. And in other countries we see no recent declines — in China, for example, hours actually rose in the 1990s and early 2000s before leveling off in recent years.

The decline in annual working hours described above has come from fewer working hours each day, as well as fewer working days each week and fewer working weeks in the year.
In a paper analyzing historical data for the US, the economist Dora Costa summarizes the evidence:18
“The length of the work day fell sharply between the 1880s, when the typical worker labored 10 hours a day, 6 days a week, and 1920, when his counterpart worked an 8-hour day, 6 days a week. By 1940 the typical work schedule was 8 hours a day, 5 days a week. Although further reductions in work time largely took the form of increases in vacations, holidays, sick days, personal leave, and earlier retirement, time diary studies suggest that the work day has continued to trend downward less than 8 hours a day.”
As Costa notes, workers had regular days off each week: one day off (usually Sunday) from at least the 1880s until around the 1940s, when two days off became more typical.
In addition to regular days off each week, workers across early-industrialized countries had days off from work for vacations and national holidays. This is shown in the chart here, which again relies on research from Huberman and Minns. The chart shows that days of vacation and holidays increased over the period from 1870–2000. The Netherlands is a stark example — workers there saw an increase from four days off for vacations and holidays in 1870 to almost 38 days off in 2000.
The declines in the length of the work day and the number of working days have been driven by several factors, including increases in productivity and the adoption of regulations that limit working hours. We discuss these and other key drivers behind working hours trends across countries and time in a series of forthcoming posts.19

The evidence presented here comes from decades of work from economic historians and other researchers. Of course, the data is not perfect — as we explain in a forthcoming post, measuring working hours with accuracy is difficult, and surveys and historical records have limitations, so estimates of working hours spanning centuries necessarily come with a margin of error. But for any given country, the changes across time are much larger than the error margins at any point in time: The average worker in a rich country today really does work many fewer hours than the average worker 150 years ago.
As the economists Diane Coyle and Leonard Nakamura explain, the study of working hours is crucial not only to measure macroeconomic productivity, but also to measure economic well-being beyond economic output. A more holistic framework for measuring ‘progress’ needs to consider changes in how people are allowed to allocate their time over multiple activities, among which paid work is only one.20
The available evidence shows that, rather than working more than ever, workers in many countries today work much less than in the past 150 years. There are huge inequalities within and across countries, but substantial progress has been made.
Do workers in richer countries work longer hours?
Economic prosperity in different places across our world today is vastly unequal. People in Switzerland, one of the richest countries in the world, have an average income that is more than 20-times higher than that of people in Cambodia.21 Life in these two countries can look starkly different.22
When considering such differences in prosperity, a natural question is: who works more, people in richer countries like Switzerland or in poorer ones like Cambodia?
Looking at the available data, the answer is clear: workers in poorer countries actually tend to work more, and sometimes much more.
We see that in the chart here, with GDP per capita on the horizontal axis and annual working hours per worker on the vertical axis.
Countries like Cambodia (which is the country in the very top-left corner) or Myanmar have some of the lowest GDP per capita but highest working hours. In Cambodia the average worker puts in 2,456 hours each year, nearly 900 more hours than in Switzerland (1,590 hours) at the bottom-right of the chart. The extra 900 hours for Cambodian workers means longer work days and many fewer days off.

There is a link between national income and average working hours, not only across countries at a given point in time — as shown in the chart above — but also for individual countries over time.
Since the Industrial Revolution people in many countries have become richer, and working hours have decreased dramatically over these last 150 years.
In the chart here we show this association between incomes and working hours over time, country by country. It is the same chart as above, except now countries’ single data points have become lines, connecting observations over time from 1950 until today.
The four highlighted countries exemplify how working hours have decreased at the same time that average incomes have increased. Germany, for example, moved far to the right as its GDP per capita increased more than 10-fold (from $4,644 to $47,556), and far to the bottom as working hours decreased by nearly half (from 2,427 hours to 1,354 hours each year).23
This makes sense: as people’s incomes rise they can afford more of the things they enjoy, including more leisure and less time spent working.
You can explore this association for other countries by clicking “Select countries” on the chart.

The key driver of rising national incomes and decreasing working hours is productivity growth.
Productivity refers to the rate at which inputs are turned into outputs. To understand working hours the key metric is labor productivity: the economic return for one hour of work.
At the most concrete level, labor productivity captures things like the number of breads that a baker bakes in an hour, or the number of cars factory workers assemble in an hour. At the most comprehensive level, it relates the total output of the economy (GDP) to the total labor input (total annual hours worked), giving us the aggregate measure of labor productivity, GDP per hour of work.
Higher labor productivity is associated with fewer working hours, as shown in the chart here with labor productivity on the horizontal axis and annual working hours on the vertical axis. The chart currently shows data for the latest available year, but you can explore this relationship over time since 1950 by using the blue time slider at the bottom of the chart.
We see that the same richer countries with lower working hours we noted before — like Germany and Switzerland — have very high labor productivity, both at nearly 70$/h. If workers can produce more with each hour of work, it becomes possible for them to work less.
Though this doesn’t necessarily mean they actually do work less — workers in the US and Singapore, for instance, work many more hours than their counterparts in countries with similar productivity.24
In contrast, the countries toward the top-left of this chart have far lower labor productivity — Cambodia, for example, is at only 2$/h — and thus workers there need to work many more hours to compensate.

Technological innovation — defined broadly here to include physical machines as well as ideas, knowledge, and processes — makes it possible for each worker to become much more productive. And increases in productivity in turn help drive both increases in incomes and decreases in working hours.25
A prime example of how tech innovation drives productivity growth is agriculture. As we show in detail in our entry on Crop Yields, innovations like better machinery, crop varieties, fertilizers, and land management have enabled farmers to be much more productive. In the US, for example, farm production per labor hour increased nearly 16-fold from 1948–2011.26 This increased productivity enables us to feed a rapidly growing population, even while the fraction of people working in agriculture is smaller than ever.27
The chart here shows the growth in labor productivity, not just for agriculture but for the entire economy. The technological, economic, and social structures in richer countries have enabled workers there to produce more while working less.
Besides tech innovation, there is evidence that working fewer hours can itself keep productivity higher, making the link between working hours and productivity self-reinforcing. For example, economist John Pencavel (2015) studied munitions workers in war-time Britain and found that their productivity stayed high up to a certain threshold of hours, but declined markedly above that threshold.28 We’ve probably all experienced the drop in productivity that comes at the end of a very long day of work.
The data show that it is workers in poorer countries who tend to work more, and sometimes a lot more, than those in richer countries.
This has large implications for the way we think about the economic progress made in the last two centuries and the nature of inequality between countries today.
It means that residents of today’s poorer countries like Cambodia and Myanmar — and also of today’s richer countries in the past when they were poor — are not just consumption poor, often unable to afford necessities like food and medicine. It means they are also leisure poor: because productivity is low and they must work so much just to scrape by, they can’t afford to spend much time improving their condition, becoming educated, or simply enjoying leisure time.
That people in poorer countries work so much more than in richer countries shows that differences in prosperity are not due to differences in work ethic — they are largely due to differences in circumstance and opportunity. As we ask in another post, “what would have been the chances for Steve Jobs if he was born in the Central African Republic?” No matter how hard he worked or how smart he was, it is difficult to imagine that Steve Jobs would’ve been able to realize his potential with such a steep mountain of inequality to climb.
We also see what the world misses out on when exceptionally talented people, including all the brilliant but underprivileged people in today’s poorest countries, don’t have the opportunity to realize their potential.29
Finding ways to raise productivity is therefore not just key to increasing production, but also to the reduction in working hours that is necessary for a society to flourish.
How are working hours measured and what can we learn from the data?
Work is a central part of our lives. It is something we do almost every day, for much of the day, for decades on end. Because it is so central, looking closely at how much time we spend working can tell us a lot about our lives and the societies we live in.
The data on working hours shows, for example, that rather than working more than ever — as is so commonly believed — people in many countries today work much less than in the past 150 years.
Working less means being able to spend time becoming more educated, or simply enjoying more leisure time. This is substantial progress, but there is still huge inequality across countries, and progress still to make.
To understand these changes in societies and people’s lives over time, and the substantial differences we see in the world today, it is crucial to measure and study how much time people spend working.
How are working hours actually measured? Where does the data come from, and how can researchers reconstruct long-run trends?
Here we provide an overview of the main data sources, compare the data, and explain the relevant differences and measurement limitations.
Surveys
Surveys are the primary way to collect data on working hours. They are typically conducted by national statistical agencies and come in three main types: labor force surveys, establishment surveys, and time use surveys. These surveys all provide an important perspective on working hours, but there are some key differences.
Labor force surveys collect data on employment status and time spent working by asking individual workers themselves. Of the survey types, these provide the most comprehensive perspective, covering hours actually worked in all economic sectors as part of both formal and informal employment, full-time and part-time, as well as self-employment and unpaid family work.30 But labor force surveys only cover residents of a country above a certain age (usually 15), which depending on the country might exclude a non-trivial number of workers.31
Establishment surveys collect data on employment and working hours as reported by employers.32 But because hours are reported by employers, these surveys often only cover paid or contractual hours and exclude self-employment, informal work, and some smaller firms.33 On the other hand, establishment surveys provide more detail on the industry of work than other surveys, and are more consistent with how GDP is measured, making them useful for studying labor productivity.
Time use surveys collect data on how individuals spend their time — down to the minute — across a number of activities in a typical day, including paid work.34 This level of granularity provides a useful complement to the other surveys, but as a trade-off time use surveys sample fewer people and are conducted less frequently and by fewer countries.
National accounts
To get the most comprehensive perspective on working hours possible, many countries aggregate data from these surveys with data from other sources — such as censuses, tax records, and social security registers — in an economic measurement framework called national accounts.
National accounts, and the surveys they rely on, are standardized to a degree across countries, which can facilitate international comparisons.35
But these comparisons often have limitations because many countries still implement the methods in different ways. For instance, countries might bring together different data in their national accounts, or aggregate it differently. And many countries don’t have the capacity to conduct comprehensive surveys of their labor force and produce national accounts-based statistics, giving a more limited view of work there.36
Comprehensive, cross-country data on working hours just isn’t available for the years before the mid 20th century. But researchers like Huberman and Minns (2007)37 have been able to fill some of the gap by reconstructing long-run trends for a selection of countries. How do they do it?
Through often painstaking effort, researchers have been able to find and piece together the relevant historical records that do exist. In the work of Huberman and Minns, one of the key sources for historical data on many countries is a report from the US Department of Labor published in 1900.38 The report compiled the records of many thousands of workers across numerous sectors from establishment surveys in 88 countries and territories. To reconstruct the trends in later years, Huberman and Minns pulled together data from the International Labor Organization, the work of peer researchers, and other sources.39
This was an impressive feat of reconstruction, but historical records like this do have limitations. For instance, as exhaustive as they were, the establishment-level records used by Huberman and Minns still excluded agricultural work, part-time work, and many smaller firms.
The work by Huberman and Minns is an important example of how researchers often combine and adjust underlying sources to produce one-off cross-country estimates. Another important study is the one of Bick, Brüggemann, and Fuchs-Schündeln (2019),40 who further standardized labor force surveys to enhance comparability for a selection of countries.
Besides these one-off estimates, several international organizations and research centers aggregate the working hours estimates published by national statistical agencies into cross-country datasets. The two most important datasets come from the OECD and the Penn World Table (PWT). These both draw on national accounts estimates when available, but they can differ in the other sources they use and their method of aggregation.41
In the chart you can compare annual working hours data from these four datasets. The data is shown one country at a time — with France currently selected. You can look at other countries by clicking ‘Change country’ on the chart, but note that not all sources publish data for every country.
As expected, there are differences between the sources. In 2000, for instance, Bick et al. estimates 1,642 hours of work for French workers, OECD estimates 1,558 hours, PWT estimates 1,550 hours, and Huberman and Minns estimates 1,443 hours. These differences are due to the use of different underlying sources and methods. Bick et al. use only labor force surveys; the others all rely primarily on national accounts data, but which nonetheless still have differences.
It’s also clear that these differences between sources are quite small when compared to the huge changes over the longer run. The difference between sources in 2000 is at most 200 hours, while the historical data from Huberman and Minns shows that from 1870 to 2000 annual working hours in France decreased by 1,725 hours (from 3,168 to 1,443 hours).

The analysis here shows that working hours data can have limitations — due to differences in the sources or the way the method is implemented — but that what these matter for our interpretation of the data depends on the context.
In a context where precise comparisons of similar countries is important, smaller differences between sources can really matter. This is why to compare recent working hours levels in the US and Europe, Bick et al. used only labor force surveys, which they standardized even further to maximize cross-country comparability. But as a trade-off, it was only possible to look at a small selection of richer countries.
In a context where we want to focus on a larger scale — such as the long-run historical trends we see in the chart — the limitations of the sources are not large enough to undermine our conclusions.
Large international datasets like PWT do not have the highest levels of cross-country comparability, but they allow us to look at many more countries across the world and uncover broad and important trends, such as the large differences in working hours between the richest and poorest countries.42
PWT and OECD are also useful in contexts where we want an exhaustive picture of the trends in individual countries, since they are often based on national accounts that bring together data from many sources to give a comprehensive perspective on working hours.
The data on working hours isn’t perfect, and it’s important to understand the limitations, but it can still tell us a lot about our lives and the world.
- Data: Time spent on various activities per day, by sex
- Geographical coverage: OECD countries plus China, India, and South Africa
- Time span: from 1998 onwards
- Available at: Time Use Database; Gender Data Portal
- Data: Time spent on various activities per day; self-reported levels of enjoyment
- Geographical coverage: 30 countries across the world
- Time span: from 1964 onwards
- Available at: https://www.timeuse.org/
- Gershuny, J., and Sullivan, O. (2019). What We Really Do All Day: Insights from the Centre for Time Use Research. Penguin UK.
- Data: Time spent with others per day
- Geographical coverage: United States
- Time span: from 2003 onwards
- Available at: https://www.bls.gov/tus/datafiles-0319.htm
- Data: Percentage of Americans living alone, by age
- Geographical coverage: United States
- Time span: from 1900 onwards
- Available at: https://ipums.org/projects/ipums-usa/d010.v8.0
- Data: Time parents spent with children per day
- Geographical coverage: United States and select countries in Europe
- Time span: 1965–2012
- Available at: Dotti Sani, G. M., and Treas, J. (2016). Educational gradients in parents’ child‐care time across countries, 1965–2012. Journal of Marriage and Family.
- Data: Time parents spent on primary childcare activities per day
- Geographical coverage: United States
- Time span: 1965–1998
- Available at: Sayer, L., Bianchi, S., and Robinson, J. (2004). Are Parents Investing Less in Children? Trends in Mothers’ and Fathers’ Time with Children. American Journal of Sociology.
- Data: Annual hours of full-time production workers (male and female) in non-agricultural activities; days off from work for vacations and holidays
- Geographical coverage: United States, Australia, Canada, and select countries in Europe
- Time span: 1870–2000
- Available at: Huberman, M. and Minns, C. (2007). The times they are not changin’: Days and hours of work in Old and New Worlds, 1870–2000. Explorations in Economic History.
- Data: Average annual hours worked by persons engaged; number of persons engaged; real and PPP-adjusted GDP in US millions of dollars
- Geographical coverage: Countries across the world
- Time span: from 1950 onwards
- Available at: https://www.rug.nl/ggdc/productivity/pwt/
- Feenstra, R. C., Inklaar, R., and Timmer, M.P. (2015). The Next Generation of the Penn World Table. American Economic Review.
- Data: Time use survey data
- Geographical coverage: Europe
- Time span: from 1998 onwards
- Available at: https://ec.europa.eu/eurostat/data/database?node_code=tus_00npaywork#
- Data: Self-reported enjoyment of various activities; time spent on various activities, by sex and age; days of work lost to sickness
- Geographical coverage: United States
- Time span: 1900–2005
- Available at: Ramey, V. A., and Francis, N. (2009). A century of work and leisure. American Economic Journal: Macroeconomics.
- Data: Working hours, by sex; number of working days; wages
- Geographical coverage: United States
- Time span: 1890–1991
- Available at: Costa, D. L. (2000). The Wage and the Length of the Work Day: From the 1890s to 1991. Journal of Labor Economics.