Electricity is one of three components that make up total energy production. The other two are transport and heating.
As we look at in more detail in this article, the breakdown of sources – coal, oil, gas, nuclear and renewables – is therefore different in the electricity versus the energy mix. Generally, low-carbon sources (nuclear and renewables) account for a larger share in our electricity mix than our total energy mix.
This means it’s important to distinguish between the two. In another page we provide the full breakdown of the Energy Mix. But in this article we focus on the Electricity Mix.
Where do we get our electricity from? Which countries have the cleanest electricity grids? In this article we look at the breakdown across the world.
Solar and wind generation are growing quickly across the world. This is, of course, good news as we try to shift our energy systems away from fossil fuels.
Such progress often makes the headlines. Here is one example from this year:
→ More UK energy is coming from clean sources than fossil fuels for the first time ever, National Grid announces (Independent, 2020)
At first glance, we might think that we are edging close to a fossil-free energy system.
Unfortunately, many of these headlines are misleading.1 The Independent made the mistake of using the terms electricity and energy interchangeably, when they are actually not the same thing.
Electricity (or ‘power’) is just one component of total energy consumption. The other two components being transport and heating.
When we see headlines about our progress on decarbonization, the quoted figures often refer to electricity. Many countries are making progress on clean electricity, but progress on energy as a whole is much slower.
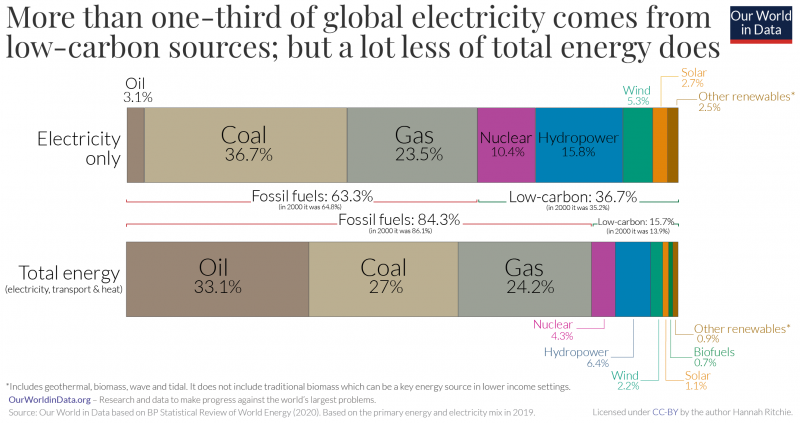
Let’s compare the breakdown of the global energy and electricity mix – these are shown in the chart.
We see a large difference between the share that comes from low-carbon sources. Nuclear and renewables account for more than one-third (36.7%) of global electricity. But they account for less than half that figure (15.7%) of the global energy mix. This is because the other elements of the energy demand – transport and heating – rely much more heavily on fossil fuels.
But there is another aspect to consider. The fact that transport and heating are harder to decarbonize, clean electricity will become ever-more important. Many solutions rely on us electrifying other parts of the energy system – such as shifting to electric vehicles. The International Energy Agency, for example, projects that by 2030, global electricity demand for electric vehicles will increase five- to eleven-fold from levels in 2019. If we are to reap the climate benefits of electric vehicles, this electricity needs to be as low-carbon as possible.
But when we see headlines on progress in decarbonizing the electricity sector we need to remember that it is just one part of the energy story. If we don’t, we risk falling into a false sense of progress and let leaders, governments and companies boast targets that are not nearly ambitious enough.
What sources make up our electricity mix? How much comes from coal, oil, gas, and how much from nuclear, hydropower, solar or wind?
In the interactive charts shown here we see the breakdown of the electricity mix by source.
The stacked area chart shows electricity production in absolute terms. It allows you see how these sources sum up. The line chart shows each source’s share of the total, and gives a better perspective on how each is changing over time.
Globally we see that coal, followed by gas, is the largest source of electricity production. Of the low-carbon sources, hydropower and nuclear make the largest contribution; although wind and solar are growing quickly.
If we look at the electricity mix of particular countries [you can do this using the “Change country” button on the bottom-left of the chart] we can see dramatic changes in over time. Take the UK as an example: there we see a dramatic decline in the role of coal in its electricity mix. In the late 1980s, coal account for more than 60% of electricity production. By 2019 this had fallen to 2%.
How you can interact with these charts
- On these charts you see the button Change Country in the bottom left corner – with this option you can switch the chart to any other country in the world.
- By ticking the ‘Relative’ box in the bottom left corner of the stacked area chart you can switch to see each source’s share of the total.

Related chart:


In the charts here we see the breakdown of the electricity mix by country. First with the higher-level breakdown by fossil fuels, nuclear and renewables. Then with the specific breakdown by source, including coal, gas, oil, nuclear, hydro, solar, wind and other renewables (which include bioenergy, wave and tidal).
This is given in terms of per capita consumption. Using the toggle on the interactive charts you can also see the percentage breakdown for each source using the ‘Relative’ tickbox.


Around 16% of global energy (15.7% to be precise) comes from low-carbon sources – that is, the sum of nuclear energy and renewables.
But energy and electricity are not the same – despite the fact that many people use these terms interchangeably. Electricity (sometimes referred to as ‘power’) is only a subset of total energy production, which also includes heating and transport.
How much of our electricity comes from low-carbon sources?
In the chart we see the percentage of global electricity production that comes from nuclear or renewable energy, such as solar, wind, hydropower, wind and tidal and some biomass.
Globally, 36.7% of our electricity was low-carbon in 2019. More than one-third. The remaining two-thirds come from fossil fuels – mostly coal and gas.
This is more than double the share in the total energy mix, where nuclear and renewables only account for 15.7%. We looked at the comparison of the global energy and electricity mix here. When people quote a high number for the share of low-carbon energy in the electricity mix we need to be aware of the fact that electricity is only part of the energy equation. The share in the total energy mix is much smaller.
Disappointingly, the percentage of electricity that comes from low-carbon sources today is almost unchanged from the mid-1980s. In fact, throughout the early-2000s this share actually regressed. In the following section we will see that progress was slow because nuclear output declined at a time when renewables have been growing.

What is the breakdown of our electricity supply in terms of fossil fuels, renewable energy and nuclear power?
In 2019, almost two-thirds (63.3%) of global electricity came from fossil fuels. Of the 36.7% from low-carbon sources, renewables accounted for 26.3% and nuclear energy for 10.4%.
As we noted earlier, the relative contribution of fossil fuels and low-carbon electricity has been pretty stagnant for decades. In fact, in the early 2000s, fossil fuels even gained ground. Over this period, nuclear’s share declined whilst renewables grew. We see this in the chart. The progress made in renewables has been offset by a decline in nuclear energy; nuclear declined by almost as much as renewables gained.


Globally we get just over one-third of our electricity from low-carbon sources. But some countries get much more – some nearly all of it – from fossil-free sources.
In the interactive map shown we see this share across the world. Some countries get over 90% of their electricity from nuclear or renewables – Sweden, Norway, France, Paraguay, Iceland, and Nepal, among others.
You can explore the electricity mix – broken down by individual source – for countries in our work here. Nearly all of these countries have one thing in common: they get a lot of electricity from hydropower and/or nuclear energy. Solar, wind and other renewable technologies are growing quickly and will hopefully account for a large share of electricity production in the future – but the countries who have a low-carbon electricity mix today have relied heavily on hydroelectric and nuclear power in recent years.
We must take these country-level examples and learn from them. In the years to come, accelerating the transition to clean electricity will become ever-more important as we electrify other parts of the energy system too (shifting to electric vehicles, for example). We will need to rely on low-carbon electricity, and lots of it.


Carbon intensity of electricity measures the amount of CO2 that is produced per unit of electricity. It is measured as the grams of CO2 produced per kilowatt-hour (kWh).
Countries which get a large share of their electricity from low-carbon sources (renewables and nuclear) will have a lower carbon intensity.
This interactive map shows the carbon intensity of electricity across Europe. Ember – our key electricity data source – currently only provides carbon intensity data for the EU-27 countries, plus the United Kingdom.
- Fossil fuels: what share of electricity comes from fossil fuels?
- Coal: what share of electricity comes from coal?
- Gas: what share of electricity comes from gas?
- Nuclear: what share of electricity comes from nuclear?
- Renewables: what share of electricity comes from renewables?
- Hydropower: what share of electricity comes from hydropower?
- Solar: what share of electricity comes from solar?
- Wind: what share of electricity comes from wind?
Fossil fuels: what share of electricity comes from fossil fuels?

Fossil fuels are the sum of coal, oil and gas. Combined, they are the largest source of global emissions of carbon dioxide (CO2). We therefore need to transition away from them.
This interactive map shows the share of electricity that comes from fossil fuels (coal, oil and gas summed together) across the world. Oil accounts for only a small share of electricity production – most come from coal and gas. The share from coal and gas individually can be found in the sections below.
Three tips on how to interact with this map
- By clicking on any country on the map you see the change over time in this country.
- By moving the time slider (below the map) you can see how the global situation has changed over time.
- You can focus on a particular world region using the dropdown menu to the top-right of the map.
Coal: what share of electricity comes from coal?

Coal is currently the largest source of electricity globally. For many countries remains the dominant source. But, we also see that others have seen a massive shift away from coal in recent years – the UK is one such example.
This interactive map shows the share of electricity that comes from coal across the world.
Gas: what share of electricity comes from gas?

Gas is now the second largest source of electricity production globally.
Its contribution is growing quickly in many countries as they substitute it for coal in the electricity mix. From a climate perspective, this transition is positive since gas typically emits less CO2 per unit of energy. But, we still ultimately want to shift away from gas towards low-carbon sources such as renewables and nuclear.
This interactive map shows the share of electricity that comes from gas across the world.
Nuclear: what share of electricity comes from nuclear?

Related content:
Nuclear has played a key role in low-carbon electricity production for decades. In some countries it is one of – if not, the single – largest source of electricity.
For example, France gets more than 70% of its electricity from nuclear power.
This interactive map shows the share of electricity that comes from gas across the world.
By clicking on a given country you can see how this share has changed over time. In some countries we see a dramatic decline in nuclear’s role as plants have been taken offline. Japan is an obvious example of this.
Renewables: what share of electricity comes from renewables?

Related content:
‘Renewables’ combines multiple electricity sources, including hydropower, solar, wind, geothermal, biomass and wave and tidal.
This interactive map shows the share of electricity that comes from renewables (the sum of all renewable energy technologies) across the world.
The share of electricity we get from individual renewable technologies – solar, or wind, for example – are given in the sections below.
Hydropower: what share of electricity comes from hydropower?

Hydropower makes a large contribution to low-carbon electricity across the world. Globally it accounts for around 17% of production.
This interactive map shows the share of electricity that comes from hydropower across the world.
Solar: what share of electricity comes from solar?

This interactive map shows the share of electricity that comes from solar power across the world.
Three tips on how to interact with this map
- By clicking on any country on the map you see the change over time in this country.
- By moving the time slider (below the map) you can see how the global situation has changed over time.
- You can focus on a particular world region using the dropdown menu to the top-right of the map.
Wind: what share of electricity comes from wind?

Wind accounts for just 5% to 6% of global electricity production. But wind generation has been growing rapidly in many countries across the world in recent years.
This interactive map shows the share of electricity that comes from wind across the world.