As the world attempts to transition its energy systems away from fossil fuels towards low-carbon sources of energy, we have a range of energy options: renewable energy technologies such as hydropower, wind and solar, but also nuclear power. Nuclear energy and renewable technologies typically emit very little CO2 per unit of energy production, and are also much better than fossil fuels in limiting levels of local air pollution.
But whilst some countries are investing heavily in increasing their nuclear energy supply, others are taking their plants offline. The role that nuclear energy plays in the energy system is therefore very specific to the given country.
How much of our energy comes from nuclear power? How is its role changing over time? In this article we look at levels and changes in nuclear energy generation across the world, and its safety record in comparison to other sources of energy.

Nuclear energy – alongside hydropower – is one of our oldest low-carbon energy technologies.
Nuclear power generation has been around since the 1960s, but saw massive growth globally in the 1970s, 80s and 90s. In the interactive chart shown we see how global nuclear generation has changed over the past half-century.
Following fast growth during the 1970s to 1990s, global generation has slowed significantly. In fact, we see a sharp dip in nuclear output following the Fukushima tsunami in Japan in 2011 [we look at the impacts of this disaster later in this article], as countries took plants offline due to safety concerns.
But we also see that in recent years, production has once again increased.


The global trend in nuclear energy generation masks the large differences in what role it plays at the country level.
Some countries get no energy at all from nuclear – or are aiming to eliminate it completely – whilst others get the majority of their power from it.
This interactive chart shows the amount of nuclear energy generated by country. We see that France, the USA, China, Russia and Canada all produce relatively large amounts of nuclear power.
Two tips on how you can interact with this chart
- View the data for any country as a line chart: click on any country to see its change over time, or by using the ‘CHART’ tab at the bottom.
- Add any other country to the line chart: click on the Add country button to compare with any other country.
What share of primary energy comes from nuclear?

We previously looked nuclear output in terms of energy units – how much each country produces in terawatt-hours. But to understand how large of a role nuclear plays in the energy system we need to put this in perspective of total energy consumption.
This interactive chart shows the share of primary energy that comes from nuclear sources.
Note that this data is based on primary energy calculated by the ‘substitution method’ which attempts to correct for the inefficiencies in fossil fuel production. It does this by converting non-fossil fuel sources to their ‘input equivalents’: the amount of primary energy that would be required to produce the same amount of energy if it came from fossil fuels. We look at this adjustment in more detail here.
In 2019, just over 4% of global primary energy came from nuclear power.
Note that this is based on nuclear energy’s share in the energy mix. Energy consumption represents the sum of electricity, transport and heating. We look at the electricity mix below.
What share of electricity comes from nuclear?

In the sections above we looked at the role of nuclear in the total energy mix. This includes not only electricity, but also transport and heating. Electricity forms only one component of energy consumption.
Since transport and heating tend to be harder to decarbonize – they are more reliant on oil and gas – nuclear and renewables tend to have a higher share in the electricity mix versus the total energy mix.
This interactive chart shows the share of electricity that comes from nuclear sources.
Globally, around 10% of our electricity comes from nuclear. But some countries rely on it heavily: it provides more than 70% of electricity in France, and more than 40% in Sweden.
- What are the safest sources of energy?
- Nuclear energy and renewables are far, far safer than fossil fuels
- Putting death rates from different energy sources in perspective
- Contrary to popular belief, nuclear power has saved lives by displacing fossil fuels
- Modern renewables and nuclear energy are not only safer but also cleaner than fossil fuels
- How many people has nuclear energy saved?
- What was the death toll from Chernobyl and Fukushima?
- Deaths from Chernobyl
- Deaths from Fukushima
- Why was the death toll from Chernobyl so much higher than Fukushima?
- Nuclear energy is one of the safest energy sources
What are the safest sources of energy?
Two centuries ago we discovered how to use the energy from fossil fuels to make our work more productive. It was the innovation that started the Industrial Revolution. Since then, the increasing availability of cheap energy has been integral to the progress we’ve seen over the past few centuries. It has allowed work to become more productive, and people in industrialized countries are much richer than their ancestors, work much less, and enjoy much better living conditions than ever before. Energy access is therefore one of the fundamental driving forces of development. The United Nations rightly says that “energy is central to nearly every major challenge and opportunity the world faces today.”
But while energy from fossil fuels brought many benefits it unfortunately also has major negative consequences. There are three main categories of negative consequences.
The first is air pollution: at least five million people die prematurely every year as a result of air pollution.1
Fossil fuels and the burning of biomass – wood, dung, and charcoal – are responsible for most of those deaths. Eliminating fossil fuels could cut premature deaths from air pollution by around two-thirds. That’s three to four million deaths per year.2
The second is accidents. This includes accidents that happen in the mining and extraction of the fuels (coal, uranium, rare metals, oil and gas) and it includes accidents that occur in the transport of raw materials and infrastructure, the construction of the power plant, or their deployment.
The third is greenhouse gas emissions: fossil fuels are the main source of greenhouse gases, the primary driver of climate change. In 2018, 87% of global CO2 emissions came from fossil fuels and industry.3
All energy sources have negative effects. But they differ enormously in size: as we will see, in all three aspects, fossil fuels are the dirtiest and most dangerous, while nuclear and modern renewable energy sources are vastly safer and cleaner.
From the perspective of both human health and climate change, it matters less whether we transition to nuclear power or renewable energy, and more that we stop relying on fossil fuels.
Nuclear energy and renewables are far, far safer than fossil fuels
Today the global energy system is still dominated by fossil fuels, traditional biomass, hydropower and nuclear energy.4 However, modern renewables, such as solar and wind, are growing and we expect them to play an increasing role in our energy systems in the coming decades. As our energy systems transition we have decisions to make about what sources to choose. Safety concerns should be a key factor we consider.
How do fossil fuels, nuclear energy and renewables stack up in terms of safety?
Research that answers this question comes from several sources. Anil Markandya and Paul Wilkinson (2007) published an analysis in the medical journal The Lancet, which compared the death rates from fossil fuels, nuclear, hydropower and biomass.5 In this study they considered deaths from accidents – such as the Chernobyl nuclear disaster, occupational accidents in mining or power plant operations – as well as premature deaths from air pollution.6 When they published the paper, modern renewable energy sources were still a very small source of energy production and weren’t included in the analysis. Data on the safety of renewable sources was published in a later study by Benjamin Sovacool and colleagues (2016).7,8 These figures of death rates from renewables are currently the best estimates we have to do this comparison, although they are undoubtedly not perfect [see footnote for more discussion].9 We’ve combined the results of these studies so we can compare death rates from all energy sources.
Later in this article we discuss in more detail how death rates from nuclear energy were derived. But to summarise: the death rate for nuclear includes an estimated 4000 deaths from the 1986 Chernobyl disaster in Ukraine (based on estimates from the WHO); 574 deaths from Fukushima (one worker death, and 573 indirect deaths from the stress of evacuation); and estimated occupational deaths (largely from mining and milling), as provided by Markandya and Wilkinson (2007).
In the chart we see the death rates of each – given as the number of deaths per terawatt-hour of energy.10 One terawatt-hour is about the same as the annual electricity consumption of 187,000 citizens in Europe.11
We see massive differences in the death rates of nuclear and modern renewables compared to fossil fuels.
Nuclear energy, for example, results in 99.8% fewer deaths than brown coal; 99.7% fewer than coal; 99.6% fewer than oil; and 97.5% fewer than gas. Wind, solar and hydropower are more safe yet.

Putting death rates from different energy sources in perspective
Looking at deaths per terawatt-hour can seem a bit abstract. So let’s try to put it in perspective.
Let’s consider how many deaths each source would cause for an average town of 187,090 people in Europe, which – as I’ve said before – consume one terawatt-hour of electricity per year. Let’s call this town ‘Euroville’.
If Euroville was completely powered by coal we’d expect 25 people to die prematurely every year as a result. Most of these people would die from air pollution. This is how a coal-powered Euroville would compare with towns powered by other energy sources:
- Coal: 25 people would die prematurely every year;
- Oil: 18 people would die prematurely every year;
- Gas: 3 people would die prematurely every year;
- Nuclear: In an average year nobody would die. A death rate of 0.07 deaths per terawatt-hour means it would take 14 years before a single person would die. As we will explore later, this might even be an overestimate.
- Wind: In an average year nobody would die – it will take 29 years before someone died;
- Hydropower: In an average year nobody would die – it will take 42 years before someone died;
- Solar: In an average year nobody would die – only every 53 years would someone die.
Contrary to popular belief, nuclear power has saved lives by displacing fossil fuels
Fossil fuels kill many more people than nuclear energy. We’ve seen this from the comparison above. This is surprising to many people, because many have prominent memories of the two major nuclear disasters in history: Chernobyl and Fukushima.
Unfortunately, public opinion on nuclear energy tends to be very negative.
In a separate article we take a look at the death toll of Chernobyl and Fukushima in detail. But we should at this stage summarise how the death rates for nuclear energy were calculated.
When we try to combine the two analyses referenced earlier, one issue we encounter is that neither study includes both of the major nuclear accidents in its death rate figure: Markandya and Wilkinson (2007) was published before the Fukushima disaster in 2011; and Sovacool et al. (2016) only look at death rates since 1990, and therefore do not include the 1986 Chernobyl accident. We have therefore reconstructed the death rate for nuclear to include both of these terrible accidents.12
For Chernobyl, there are several death estimates. We rely on the estimate published by the World Health Organization (WHO) – the most-widely cited figure – although this is considered to be too high by several researchers, including a later report by the United Nations Scientific Committee on the Effects of Atomic Radiation (UNSCEAR).13 We discuss this contention below. The WHO estimates that 4000 people have or will die from the Chernobyl disaster. This includes the death of 31 people as a direct result of the disaster and those expected to die at a later date from cancers due to radiation exposure.
The disaster in Fukushima killed 574 people. In 2018, the Japanese government reported that one worker has since died from lung cancer as a result of exposure from the event. No one died directly from the Fukushima disaster. Instead, most people died as a result of evacuation procedures. According to Japanese authorities 573 people died due to the impact of the evacuation and stress.14
To the death toll of history’s two nuclear disasters we have added the death rate that Markandya and Wilkinson (2007) estimated for occupational deaths, most from milling and mining. Their published rate is 0.022 deaths per TWh.
The sum of these three data points gives us a death rate of 0.07 deaths per TWh. We might consider this an upper estimate. Our estimated death toll from Chernobyl is based on the 2005/06 assessment from the WHO which applies a very conservative methodology called the linear no-threshold model. If you’re interested in the details of this we discuss it in more detail here. A later report by the United Nations Scientific Committee on the Effects of Atomic Radiation (UNSCEAR) suggests that this overstates the risk of radiation-related deaths.15
Even with this upper figure, nuclear is still much much lower than the death rate from fossil fuels – 350 times lower than coal. Despite this, politicians have turned their backs on it in many countries.
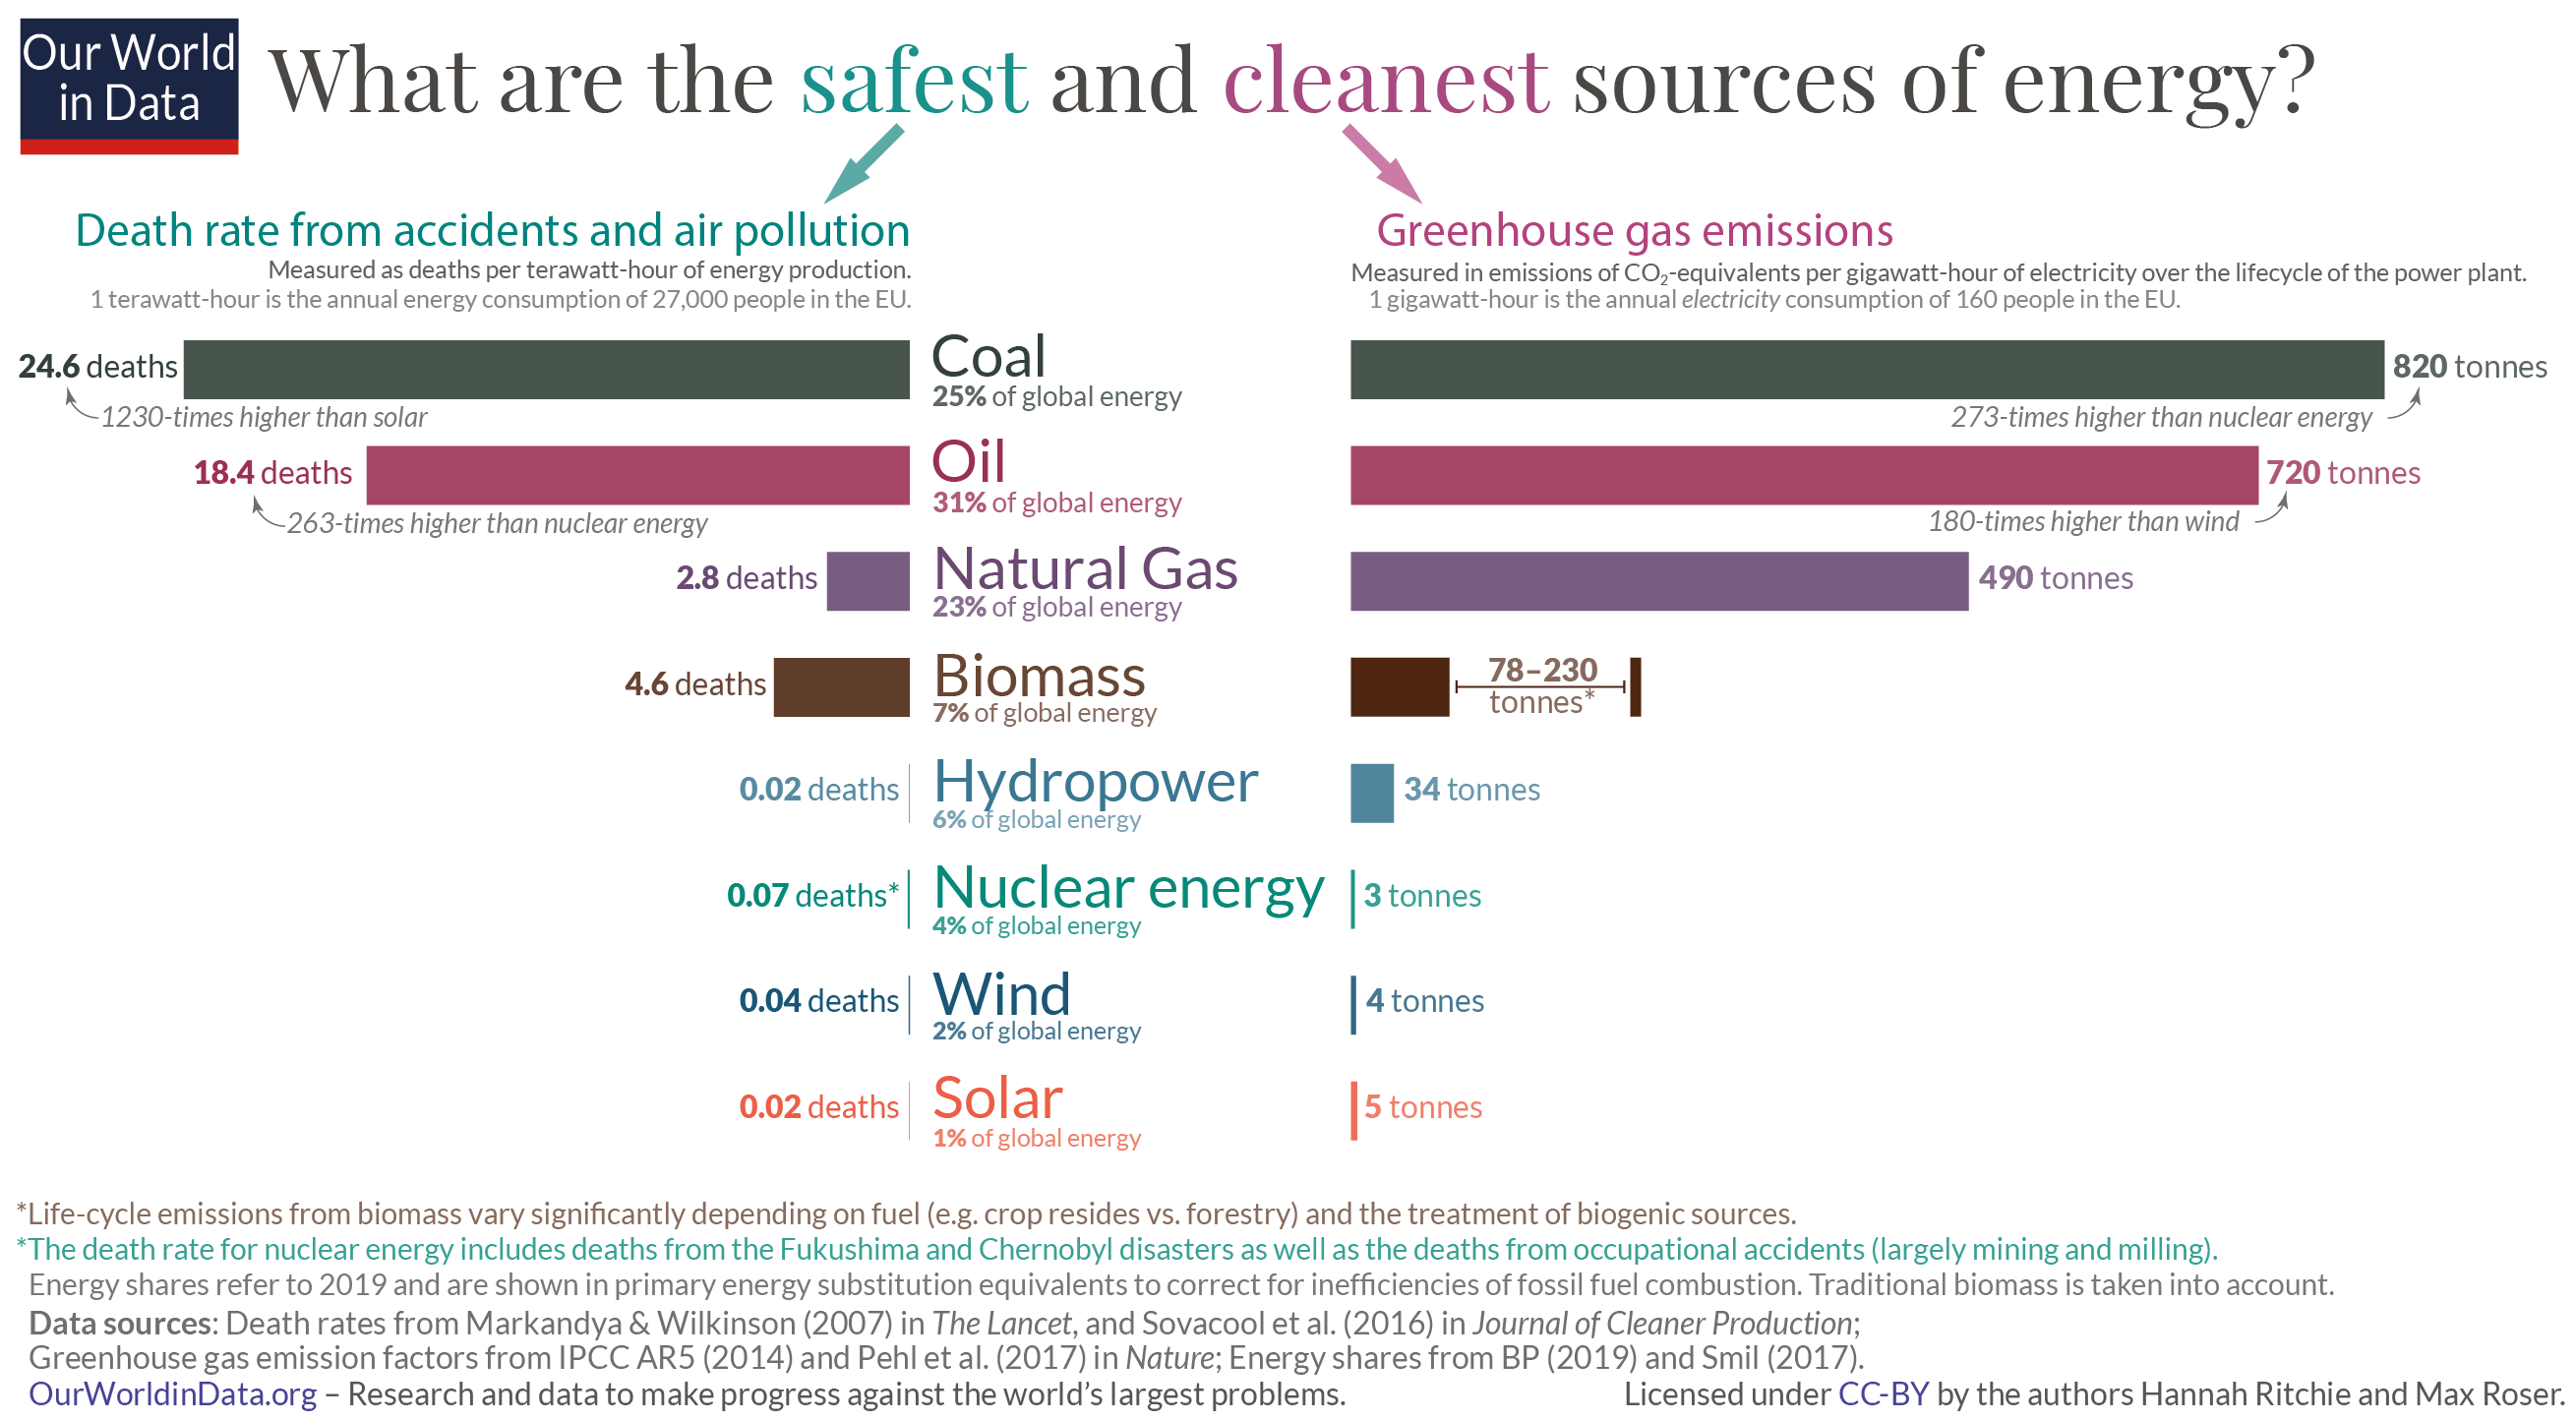
Modern renewables and nuclear energy are not only safer but also cleaner than fossil fuels
So far we’ve only considered the short-term health impacts of these energy sources. But we need to also take into account their longer-term impact on climate change.
There is actually very good news: the safest sources for us today are the same sources that have the smallest impact on the climate. Sometimes the solutions to the large global issues we face come with trade-offs, but not here. Whether you are concerned about people dying now or the future of the planet, you want the same sources of energy.
The visualization here shows this. On the left I have plotted the death rates per unit energy data we looked at previously and on the right you see their greenhouse gas emissions per energy unit. This measure of greenhouse gas emissions considers the total carbon footprint over the full lifecycle; figures for renewable technologies, for example, take into consideration the footprint of the raw materials, transport and their construction. I have adopted these figures as reported in the IPCC’s 5th Assessment Report, and more recent life-cycle figures by Pehl et al. (2017), published in Nature.16,17,18
The world is not facing a trade-off – the safer energy sources are also the least polluting. We see this from the symmetry of the chart. Coal causes most harm on both metrics: it has severe health costs in the form of air pollution and accidents, and emits large quantities of greenhouse gas emissions. Oil, then gas, are better than coal, but are still much worse than nuclear and renewables on both counts.
Nuclear, wind, hydropower and solar energy fall to the bottom of the chart on both metrics. They are all much safer in terms of accidents and air pollution and they are low-carbon options.
Unfortunately they still account for a very small share of global energy consumption – less than 10% of primary energy. Each source’s share of global primary energy production in 2019 (including traditional biomass in the total) is shown in the centre. Fossil fuels have so far dominated our energy systems for a couple of reasons: they kickstarted the Industrial Revolution and since then much of our energy infrastructure has been built around them. This early investment in fossil fuels means they have for a long time been relatively cheap – cheaper than many modern renewables in their infancy. But today, if we factor in the total costs of fossil fuels – not only the energy costs but also the social cost to our health and the environment – they are much more expensive than the alternatives. If we were to impose a carbon tax – which would account for the total costs that we all suffer – this would be the case.
Fortunately, clean and safe renewable technologies are becoming economically-competitive in their own right. The market price of both solar and wind has been falling rapidly meaning there is a real chance for change.
There is fierce debate about which low-carbon energy technologies we should pursue. But on the basis of three key questions – human health, safety and carbon footprint – nuclear and modern renewables do clearly best. A number of studies have found the same: there are large co-benefits for human health and safety in transitioning away from fossil fuels, regardless of whether you replace them with nuclear or renewables.19
The air pollution that fossil fuels cause is killing millions of people every year, and endanger many more from the future risks of climate change. We must shift away from them. And we can, we have better alternatives.
How many people has nuclear energy saved?
When people discuss the safety of nuclear energy they often focus on the number of deaths it has caused. But as we looked at previously, nuclear is one of the safest and cleanest energy sources – per unit of energy it results in hundreds of fewer deaths than coal, oil or gas, and is comparable to modern renewables such as solar or wind.
By this reasoning, we should perhaps turn this question on its head and ask: “How many lives has nuclear energy saved?”, or “How many lives could have been saved if countries had not abandoned it?”
In the wake of the 2011 Fukushima nuclear disaster, Germany announced plans to phase out nuclear power generation: over the period from 2011 to 2017 it shut down 10 of its 17 nuclear facilities, and plans to close the remaining reactors in 2022.20
Because nuclear is safer than its main alternatives this policy decision cost lives.
Replacing nuclear energy with fossil fuels kills people. This is likely to be the case in the recent example of Germany. Most of Germany’s energy deficit from scrapping nuclear was filled by increased coal production – which is, as we just saw, the most polluting source with the largest health impacts. Analysis by Stephen Jarvis, Olivier Deschenes, and Akshaya Jha (2020) estimates that Germany’s nuclear phase-out has come at the cost of more than 1,100 additional deaths each year as a result of air pollution.21 Germany’s plan to make its energy systems safer has done exactly the opposite.
In a study published in the journal Environmental Science and Technology, Pushker Kharecha and James Hansen (2013) aimed to answer the question ‘how many lives has nuclear power saved?’.22 They analysed how many more people would have died over the period from 1971 to 2009 if nuclear energy had been replaced by fossil fuels. The death toll would have depended on the mix of fossil fuels used to replace nuclear – more would have died if more coal was used than oil or gas – but they estimate that nuclear power has globally saved about two million lives.23
What was the death toll from Chernobyl and Fukushima?
When it comes to the safety of nuclear energy, discussion often quickly turns towards the nuclear accidents at Chernobyl in Ukraine (1986) and Fukushima in Japan (2011). These two events were by far the largest nuclear incidents in history; the only disasters to receive a level 7 (the maximum classification) on the International Nuclear Event Scale.
How many deaths did each of these events cause?
When it comes to nuclear accidents there are really two fatal impacts to consider: the first being the number of direct deaths which occurred either at the time of incident, or in the days which followed (i.e. the acute impacts); the second being the long-term (chronic) impacts of radiation exposure, which has known links to the incidence of several forms of cancer.
Deaths from Chernobyl
31 people died as a direct result of the Chernobyl accident; two died from blast effects and a further 29 firemen died as a result of acute radiation exposure (where acute refers to infrequent exposure over a short period of time) in the days which followed.24
The number of people who were impacted over long-term radiation exposure is more difficult to discern and remains highly contested. Part of this difficulty lies in the methodology used to estimate long-term deaths from low-level radiation exposure. In the published estimates shown, studies have utilised a methodology termed the ‘linear no-threshold model’ (LNT); this model is typically applied in assessments of radiation risk and in setting regulatory limits for environmental protection. However, the LNT method remains strongly contested, and is assumed to provide a conservative estimate of potential mortality [we have provided a short discussion on the LNT model and its implications in the technical notes at the end of this post]. As such, we may expect that the numbers quoted below to be interpreted as the upper limit of a given source’s estimate.
The chart here reflects a range of published estimates on the number of deaths resultant from the Chernobyl disaster. In its 2005/06 assessment ‘Chernobyl’s Legacy: Health, Environmental and Socio-Economic Impacts’ the World Health Organisation (WHO) estimated that the total number of long-term deaths will be around 4,000.25
However, this figure is related only to the proximate populations of Ukraine, Russia and Belarus which were exposed to high radiation levels; if extended to estimates of those exposed to low-level radiation across the region, this number rises to 9000.26
Other studies have suggested higher figures. A study in the International Journal of Cancer by Cardis et al. (2006) estimates a total of 16,000 deaths across Europe.27
Radiation scientists Fairlie and Sumner provide some of highest estimates, predicting between 30,000-60,000 deaths.28
The challenge of cancer risk attribution- especially at low doses of exposure in further geographic regions- makes this process of estimation particularly difficult. In its 2008 report, the United Nations Scientific Committee on the Effects of Atomic Radiation (UNSCEAR) refrained from quoting a figure for the absolute number of deaths within populations exposed to low radiation doses from Chernobyl because of uncertainty in the limit no-threshold model and “unacceptable uncertainties in the predictions”.29

Deaths from Fukushima
In the case of Fukushima, although 40 to 50 people experienced physical injury or radiation burns at the nuclear facility, the number of direct deaths from the incident are quoted to be zero. In 2018, the Japanese government reported that one worker has since died from lung cancer as a result of exposure from the event.
However, mortality from radiation exposure was not the only threat to human health: the official death toll was 573 people – who died as a result of evacuation procedures and stress-induced factors. This figure ranges between 1,000-1,600 deaths from evacuation (the evacuation of populations affected by the earthquake and tsunami at the time can make sole attribution to the nuclear disaster challenging). Stress-induced deaths affected mostly older people; more than 90 percent of mortality occurred in individuals over the age of 66.
In the chart we have shown the estimated number of total deaths by attributed cause.
How many are projected to suffer in the long-term from low-level radiation exposure? In its initial Health Risk Assessment of the nuclear disaster – published in 2013 – the World Health Organization (WHO) note exposure levels too low to affect human health for the national population, with exception to a few communities in closest proximity.30 The follow-up WHO Report published five years on – in 2015 – suggests very low risk of increased cancer deaths in Japan.31 In a review of the response and long-term health impacts of Fukushima, published by Michael Reich and Aya Goto (2015) in journal The Lancet, the authors note that: “no one has died from radiation exposure, and the UN Scientific Committee on the Effects of Atomic Radiation report in 2013 stated that substantial changes in future cancer statistics attributed to radiation exposure are not expected to be observed”.32,33
In more recent evaluations of rates of perinatal mortality (that is, stillbirths or deaths within the first week of life) in areas closest to the Fukushima site, there were no statistical indications of increased incidence.34 In fact, rates of perinatal mortality showed an overall decline with time—the general trend we see through improved healthcare and healthier lifestyles.
The death toll of the Fukushima nuclear accident dominated headlines for weeks after the event and overshadowed the much larger tragedy that happened at the same time and place: the Tsunami killed 15,893 people, more than 25 times the number from the nuclear accident.

Why was the death toll from Chernobyl so much higher than Fukushima?
Chernobyl and Fukushima are the only two disasters to receive a level 7 (the maximum classification) on the International Nuclear Event Scale. But why are more expected to die from Chernobyl than Fukushima?
There are a couple of factors which are likely to have played a key role here. The first of these concerns the technical functionality and safety measures of the respective nuclear facilities. Chernobyl occurred 25 years prior to Fukushima; it was the first instance of a nuclear accident at this scale. From a technical perspective, the nuclear reactors at Chernobyl were poorly designed to deal with such a scenario. Its fatal RBMK reactor had no containment structure, allowing radioactive material to spill into the atmosphere (in contrast, Fukushima’s reactors had steel-and-concrete containment structures, although it’s likely that at least one of these were also breached). Crucially, the cooling systems of both plants worked very differently; at Chernobyl, the loss of cooling water as steam actually served to accelerate reactivity levels in the reactor core, creating a positive feedback loop towards fatal explosion (the opposite is true of Fukushima, where the reactivity reduces as temperatures rise, effectively operating as a self-shutdown measure).
These technical differences undoubtedly played a role in the relative levels of exposure from both events. However, the governmental response to both events is also likely to have played a crucial role in the number of people who were exposed to high levels of radiation in the days which followed. In the case of Fukushima, the Japanese government responded quickly to the crisis with evacuation efforts extending rapidly from a three kilometre (km), to 10km, to 20km radius whilst the incident at the site continued to unfold. In comparison, the response in the former Soviet Union was one of denial and secrecy.
It’s reported that in the days which followed the Chernobyl disasters, residents in surrounding areas were uninformed of the radioactive material in the air around them. In fact, it took at least three days for the Soviet Union to admit an accident had taken place, and did so after radioactive sensors at a Swedish plant were triggered from dispersing radionuclides. It’s estimated that the delayed reaction from the Soviet government and poor precautionary steps taken (people continued to drink locally-produced, contaminated milk, for example) led to thousands of thyroid cancer cases in exposed children.
Whilst prevention, and ultimately containment (which are predominantly technical issues), are crucial to the safety of nuclear energy production, these two events also highlight the importance of political governance and response in the aftermath of such disasters.
Nuclear energy is one of the safest energy sources
The potential risks of nuclear energy are real: in both Chernobyl and Fukushima, deaths occurred as a result of direct nuclear impacts, radiation exposure and psychological stress. Nonetheless, of the two largest nuclear disasters, the death toll was of the order of thousands, and hundreds in the latest. Arguably still too many, but far fewer than the millions who die every year from impacts of other conventional energy sources.
As covered in a separate blog post on the relative safety of energy sources, the comparatively low death toll from nuclear energy (resulting in 442 times fewer deaths relative to brown coal per unit of energy, even with radioactive exposure deaths included) is largely at-odds with public perceptions, where public support for nuclear energy is often low as a result of high safety concerns. The key distinction here is that nuclear risk is generally focused within low-probability, high-impact single events in contrast to air pollution impacts which provide a persistent background health risk.