Notice: This is only a preliminary collection of relevant material
The data and research currently presented here is a preliminary collection or relevant material. We will further develop our work on this topic in the future (to cover it in the same detail as for example our entry on World Population Growth).
If you have expertise in this area and would like to contribute, apply here to join us as a researcher.
In this entry we focus on how IQ has changed over time. The most common way of assessing intelligence is IQ testing.
All our charts on Intelligence
The ‘Flynn Effect’ describes the phenomenon that over time average IQ scores have been increasing. The change in IQ scores has been approximately three IQ points per decade. One major implications of this trend is that an average individual alive today would have an IQ of 130 by the standards of 1910, placing them higher than 98% of the population at that time. Equivalently, an individual alive in 1910 would have an IQ of 70 by today’s standards.
By world region
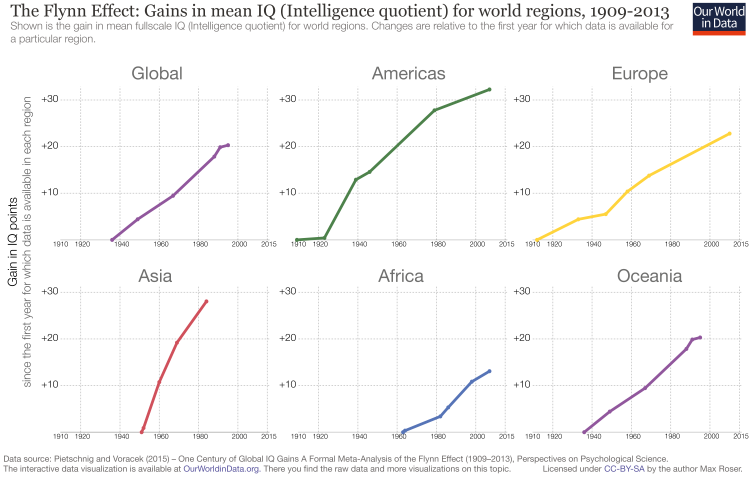
This visualization shows the gains in IQ that different world regions have made since the first year for which data is available for a particular region.
For each region this visualization shows the change since the first year for which there is data for that particular region. This means it is not possible to make comparisons between different regions and only possible to compare IQ scores over time.
By country
In a comprehensive study of the Flynn Effect, Jakob Pietschnig and Martin Voracek looked at 271 independent samples comprising 3,987,892 participants covering a time span of 105 years (1909–2013).1
They find strong evidence to support the claim that IQ has been increasing substantially over time.2 The paper discusses several explanations for the observed increases, namely education, exposure to technology and nutrition. For the definitions of the different IQ measures presented in the chart click here.
The charts show the estimated gain in average IQ for a selection of countries and world regions.
It is important to note that this is not a reflection of how intelligent a country/region is but instead how quickly advances were being made. As the visualization above it is only helpful for understanding changes over time. For more information on the drivers and composition of IQ gains, see our section here
The different measures of IQ displayed in the figure correspond to different types of intelligence.
Domain-specific IQ gain trajectories, 1909-2013 – Pietschnig and Voracek3

Composition of IQ Gains
What has been driving the gains in intelligence?
There are many competing and complementary explanations: from nutrition and health improvements, greater levels of education, to the increasingly abstract nature of human existence.
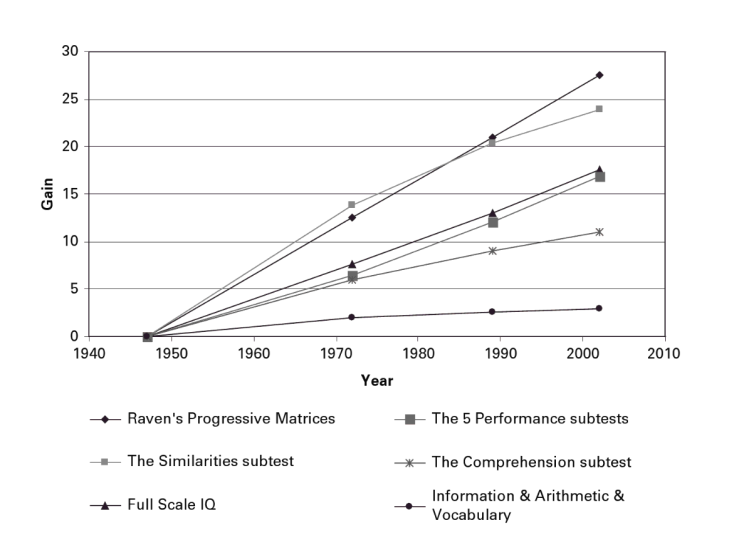
In James Flynn’s book What Is Intelligence?: Beyond the Flynn Effect, he decomposes the gains in IQ found for American children in the Wechsler Intelligence Scale for Children (WISC) and finds that much of the gains have come from the subtests that focus on abstract thinking (similarities test and Raven’s progressive matrices). Only a small portion of the gains is due to improvements in knowledge of basic information, arithmetic and vocabulary. This observation would support the idea that increases in IQ have been driven by the changing way in which we live.
WISC IQ gains for America, 1947-2002 – Flynn (2007)4
Domain-specific IQ gains
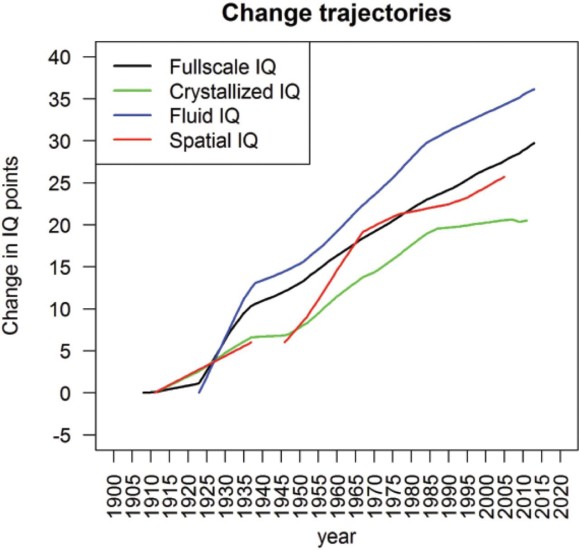
Researchers distinguish between intelligence across a range of domains:
- Fullscale IQ: overall intelligence
- Crystallized IQ: the ability of an individual to deploy skills, knowledge and experience to answer questions
- Fluid IQ: logic and problem solving skills in novel situations independent of acquired knowledge
- Spatial IQ: spatial judgement and the ability to visualise information to solve problems
The chart shows domain-specific IQ gain trajectories over the last century.
Domain-specific IQ gain trajectories, 1909-2013 – Pietschnig and Voracek5
Alexander Luria, a Russian neuropsychologist, conducted a series of interviews with headmen of villages in rural 1920s Russia as part of a study of reasoning. His research was published in a book titled Cognitive Development: Its Cultural and Social Foundations in 1976. The following extract from James Flynn’s What is intelligence? is just one example of the types of responses Luria received from the villagers.
Today we have no difficulty freeing logic from concrete referents and reasoning about purely hypothetical situations. People were not always thus. Christopher Hallpike (1979) and Nick Mackintosh (2006) have drawn my attention to the seminal book on the social foundations of cognitive development by Luria (1976). His interviews with peasants in remote areas of the Soviet Union offer some wonderful examples. The dialogues paraphrased run as follows:
White bears and Novaya Zemlya (pp. 108-109):
Q: All bears are white where there is always snow; in Zovaya Zemlya there is always snow; what color are the bears there?
A: I have seen only black bears and I do not talk of what I have not seen.
Q: But what do my words imply?
A: If a person has not been there he can not say anything on the basis of words. If a man was 60 or 80 and had seen a white bear there and told me about it, he could be believed.
Population aging and The Flynn Effect
The effect of an aging population, especially in advanced economies, has an attenuating effect on average cognitive abilities over time.
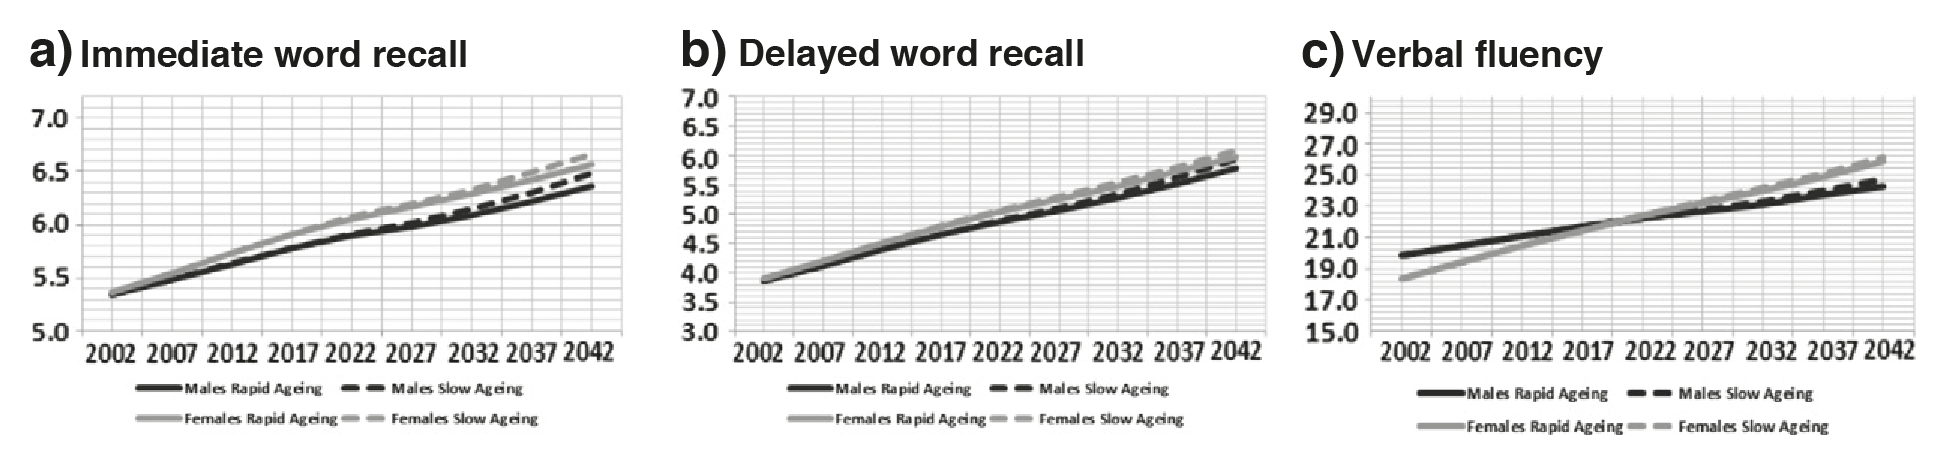
Skirbekk et al. writing in Intelligence create projections of future cognitive abilities and find that if the Flynn effect reaches a saturation point, then average cognitive ability is expected to decline in the future. However, if the current Flynn effect persists, average intelligence will continue to rise in spite of an aging population. Consider the following simulations.
Cognitive score in scenario with no cohort effect and constant age variation, 2002-2042 – Skirbekk et al. (2013)6
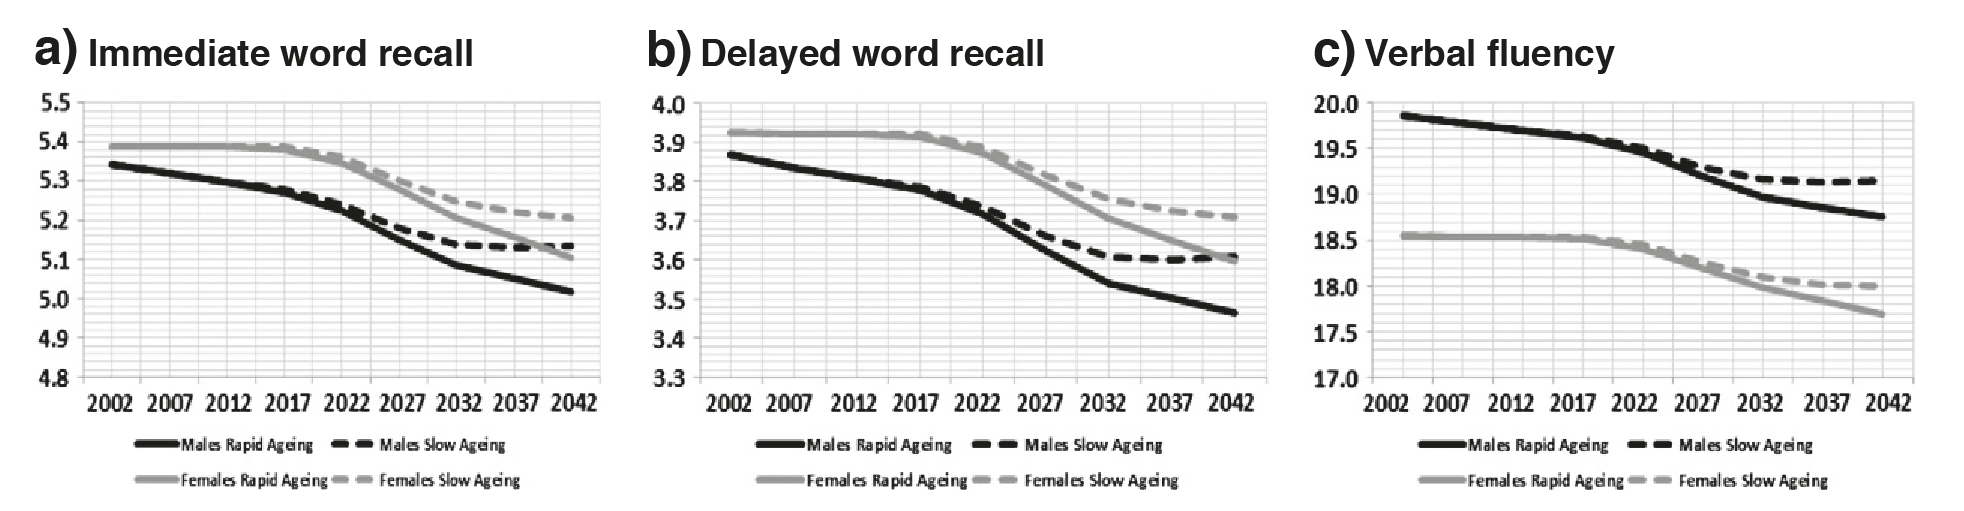
Projections of cognitive ability, age profile of cognition by cohort in scenario with continued improvement along cohort lines and constant lifespan trajectories – Skirbekk et al. (2013)7
Disease Burden and IQ
Disease during pregnancy or early childhood can impair the cognitive development of children permanently. The driving force behind this theory is that if a child becomes seriously ill, the body transfers resources (energy) into fighting off the infection, reducing the amount left for brain development.
Nutrition and prosperity
An examination of the differences in IQ between two cohorts, one group born in 1921 and the other 15 years apart in 1936, finds substantial differences in IQ over their lifetimes. The study conducted by Staff et al. uses panel (longitudinal) data on the same groups of individuals.8
All students born in either 1921 or 1936 and attending school in Scotland on June 1, 1932 or June 4, 1947 were made to sit intelligence examinations. The authors report that scores on the Raven’s Progressive Matrices (RPM) test increased annually by over one-half point. At age 77 (where there is an overlap in data) there is an estimated difference of 16.5 IQ points between the two cohorts, which is roughly three times larger than expected.
Dr Roger Staff explains that “those born in 1936 were children during the war and experienced food rationing. Although rationing meant that the food was not particularly appetising it was nutritious and probably superior to the older group. In addition, post-war political changes such as the introduction of the welfare state and a greater emphasis on education probably ensured better health and greater opportunities. Finally, in their thirties and forties the 1936 group experienced the oil boom which brought them and the city prosperity. Taken together, good nutrition, education and occupational opportunities have resulted in this life long improvement in their intelligence. Aberdeen has been good for their IQ!” More information on this research can be found here.