All our charts on Internet
The Internet’s history has just begun
The Internet’s history goes back some decades by now – email has been around since the 1960s, file sharing since at least the 1970s, and TCP/IP was standardized in 1982. But it was the creation of the world wide web in 1989 that revolutionized our history of communication. The inventor of the world wide web was the English scientist Tim Berners-Lee who created a system to share information through a network of computers. At the time he was working for the European physics laboratory CERN in the Swiss Alps.
Here I want to look at the global expansion of the Internet since then.
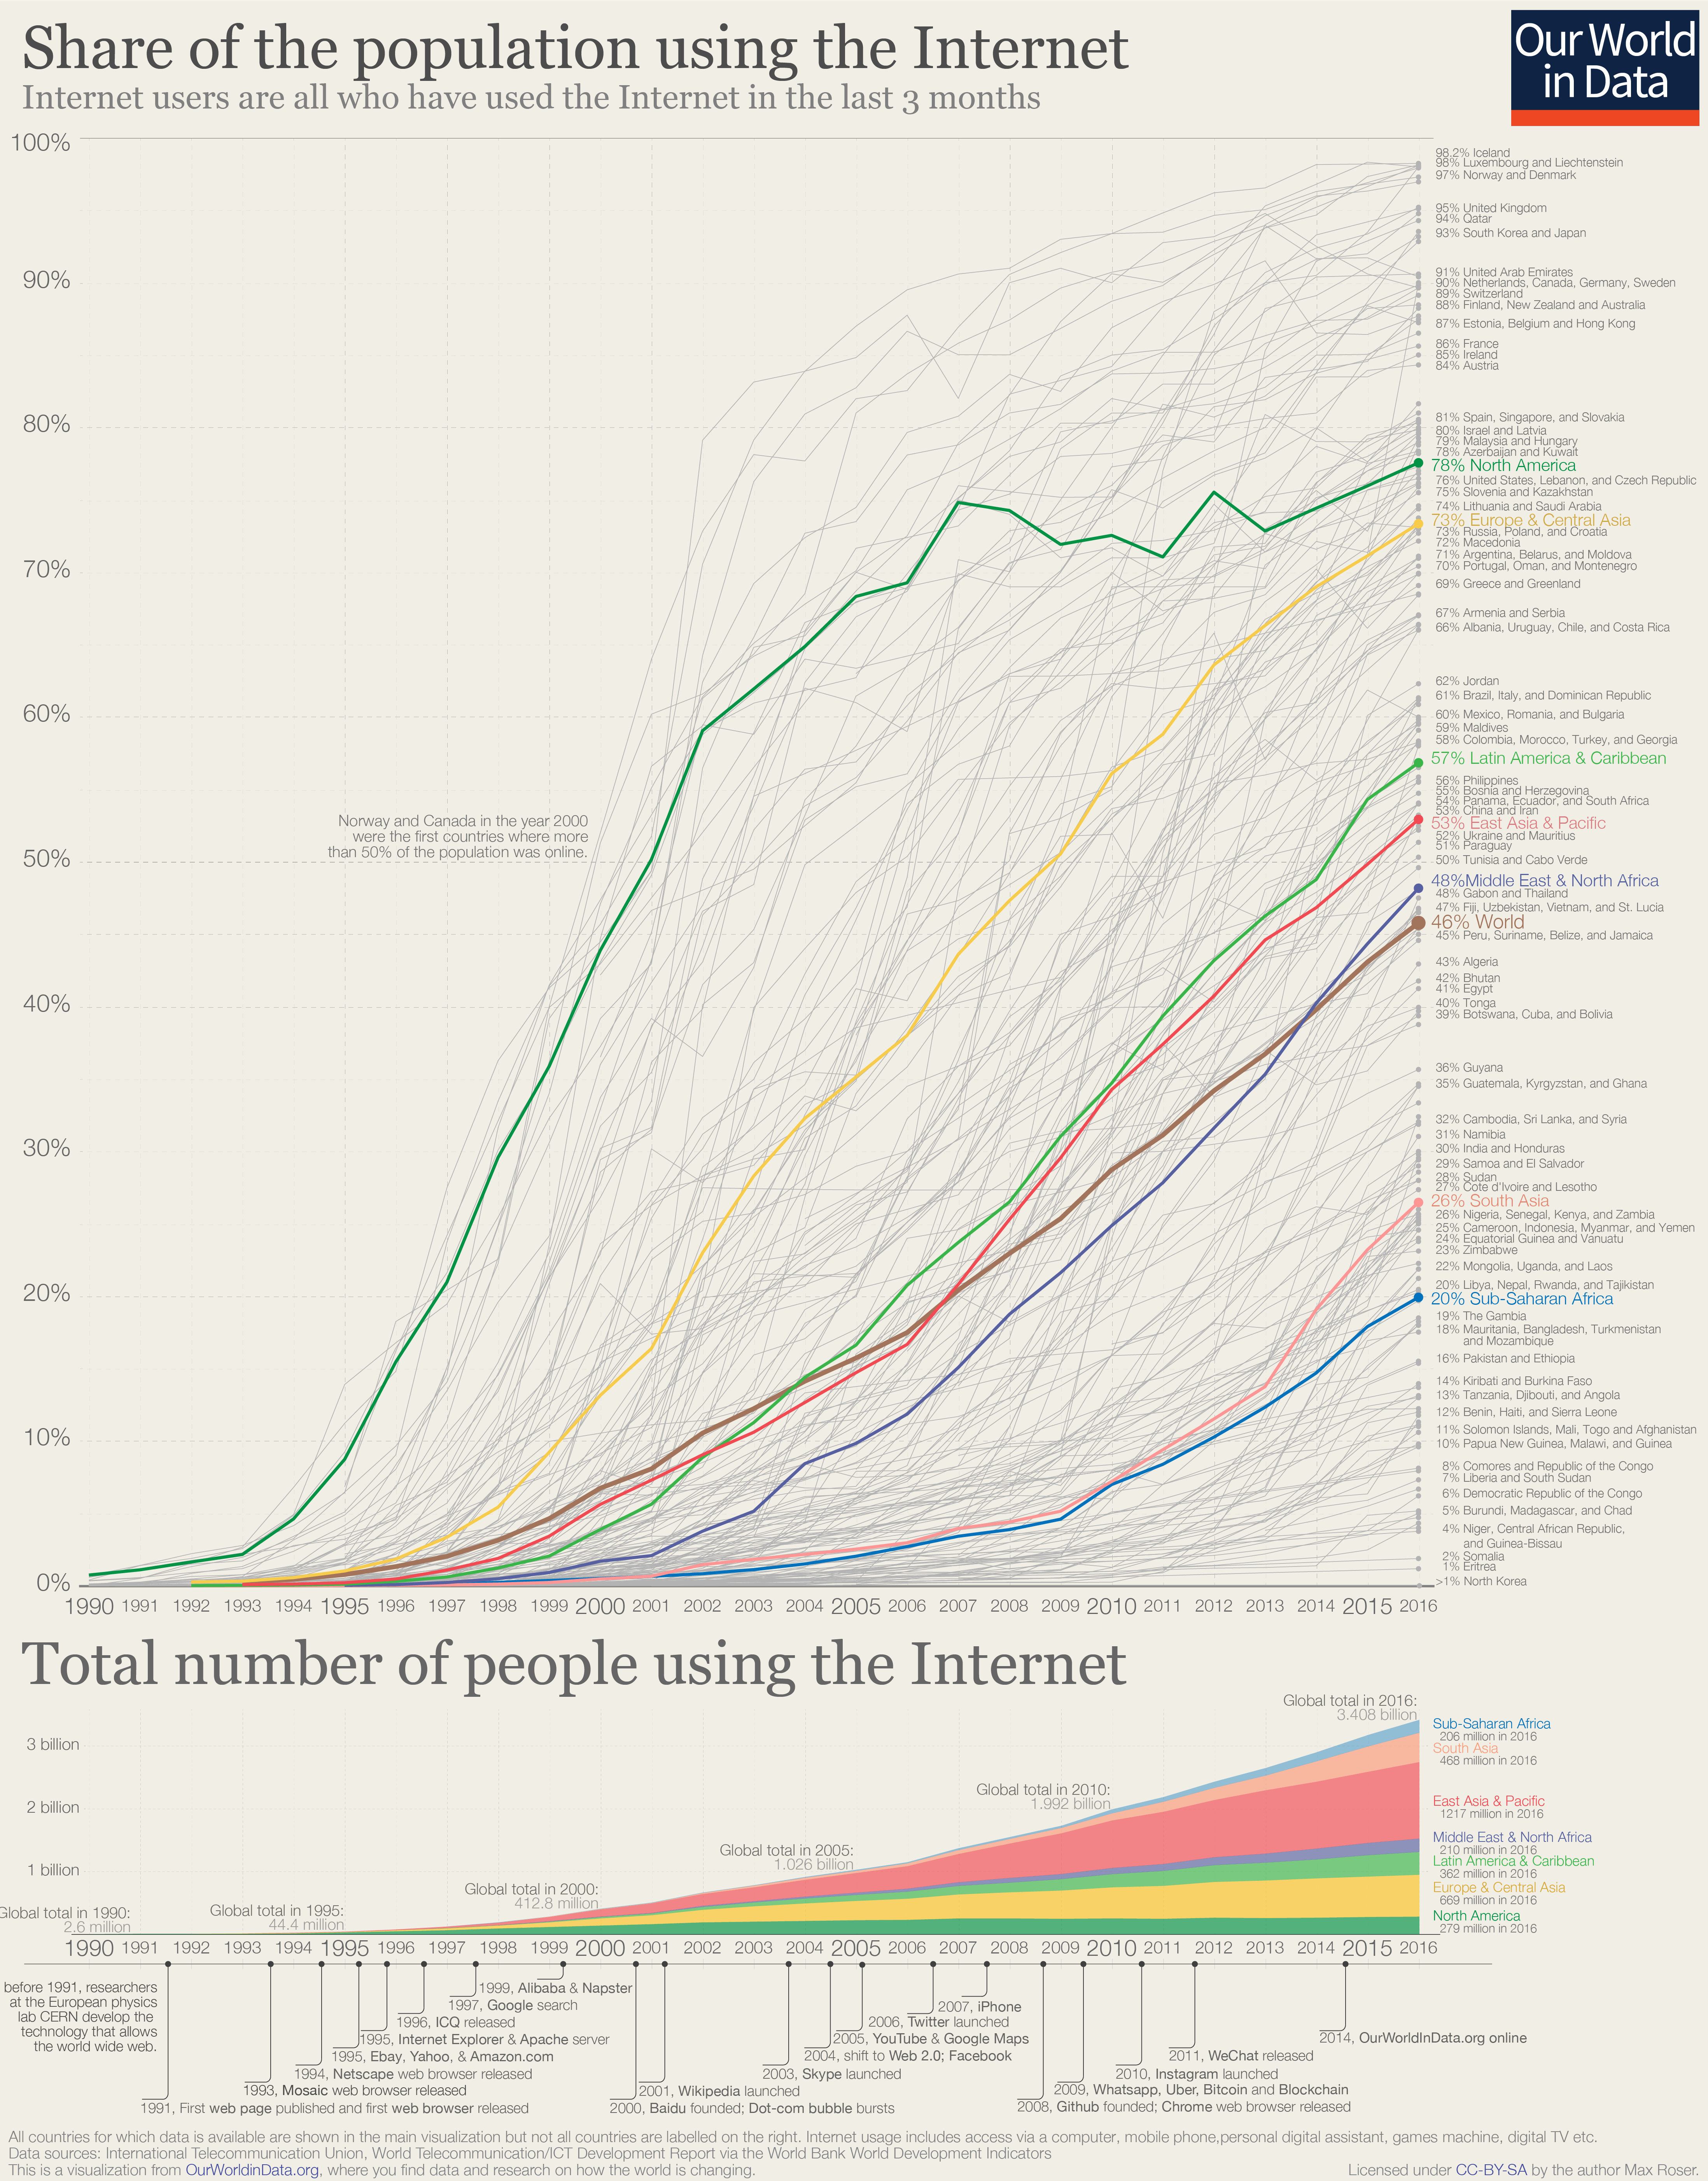
This chart shows the share and number of people that are using the Internet, which in these statistics refers to all those who have used the Internet in the last 3 months.1
The chart starts in 1990, still one year before Berners-Lee released the first web browser and before the very first website was online (the site of CERN, which is still online). At that time very few computers around the world were connected to a network; estimates for 1990 suggest that only half of a percent of the world population were online.
As the chart shows, this started to change in the 1990s, at least in some parts of the world: By the year 2000 almost half of the population in the US was accessing information through the internet. But across most of the world the internet had not yet had much influence – 93% in the East Asia and Pacific region and 99% in South Asia and in Sub-Saharan Africa were still offline in 2000. At the time of the Dot-com-crash less than 7% of the world was online.
15 years later, in 2016, three-quarters (76%) of people in the US were online and during these years countries from many parts of the world caught up: in Malaysia 79% used the internet; in Spain and Singapore 81%; in France 86%; in South Korea and Japan 93%; in Denmark and Norway 97%; and Iceland tops the ranking with 98% of the population online.2
At the other end of the spectrum, there are still countries where almost nothing has changed since 1990. In the very poorest countries – including Eritrea, Somalia, Guinea-Bissau, the Central African Republic, Niger, and Madagascar – fewer than 5% are online. And at the very bottom is North Korea, where the country’s oppressive regime restricts the access to the walled-off North Korean intranet Kwangmyong and access to the global internet is only granted to a very small elite.
But the overarching trend globally – and, as the chart shows, in all world regions – is clear: more and more people are online every year. The speed with which the world is changing is incredibly fast. On any day in the last 5 years there were on average 640,000 people online for the first time.3
This was 27,000 every hour.
For those who are online most days it is easy to forget how young the internet still is. The timeline below the chart reminds you how recent websites and technologies became available that are integrated to the everyday lives of millions: In the 1990s there was no Wikipedia, Twitter launched in 2006, and Our World in Data is only 4 years old (and look how many people have joined since then4).
And while many of us cannot imagine their lives without the services that the internet provides, the key message for me from this overview of the global history of the internet is that we are still in the very early stages of the internet. It was only in 2017 that half of the world population was online; and in 2018 it is therefore still the case that close to half of the world population is not using the internet.5
The internet has already changed the world, but the big changes that the Internet will bring still lie ahead and its history has just begun.
The share of the population and the total number of people using the Internet6
The map shows the share of the population that is accessing the internet for all countries of the world. Internet users are individuals who have used the Internet (from any location) in the last 3 months. The Internet can be used via a computer, mobile phone, personal digital assistant, games machine, digital TV etc.
In richer countries more than two thirds of the population are typically online. And although usage rates are much lower in the developing world, they are increasing.

The internet has been one of our most transformative and fast-growing technologies. Globally the number of internet users increased from only 413 million in 2000 to over 3.4 billion in 2016. The one billion barrier was crossed in 2005. Every day over the past five years, an average of 640,000 people went online for the first time.7
But how many people from each country are online? In the maps we see the total number of users by country, and the percentage of a country’s population who are users.
China and India take the top two slots despite having only 50 and 26 percent online, respectively. The top six countries by users (and the only countries with over 100 million) in 2016/17 were8:
- China = 765 million
- India = 391 million
- United States = 245 million
- Brazil = 126 million
- Japan = 116 million
- Russia = 109 million
A chart of the top 10 countries is here. Clicking on any country in map shows how its users have changed over time.
The internet has been growing at an incredible rate; many countries – including India, Bangladesh, Cote d’Ivoire, Ghana and Malawi – have doubled the number of users in the last 3 years alone.
Around half of the world is not yet online – as Max wrote, the internet’s history has only just begun, but with 27,000 new users every hour, many will experience it for the first time soon.


This chart shows the number of fixed broadband subscriptions per 100 people.
This refers to fixed subscriptions to high-speed access to the public Internet (a TCP/IP connection), at downstream speeds equal to, or greater than, 256 kbit/s.
Means of connection include cable modem, DSL, fiber-to-the-home, other fixed (wired)-broadband subscriptions, satellite broadband and terrestrial fixed wireless broadband. Excluded are subscriptions via mobile-cellular networks.

A truly disruptive technological development has been the rise of mobile phones. The interactive visualization shows the latest global data.
By changing to the chart view you can see that globally we only saw a very slow rise until the late 1990s and then a dramatically faster increase in mobile device subscriptions since the beginning of the 21st century.

Facebook, the largest social media platform in the world, has 2.4 billion users. Other social media platforms including Youtube and Whatsapp also have more than one billion users each.
These numbers are huge – there are 7.7 billion people in the world, with 3.5 billion of us online. This means social media platforms are used by one-in-three people in the world, and more than two-thirds of all internet users.
Social media has changed the world. The rapid and vast adoption of these technologies is changing how we find partners, how we access information from the news, and how we organize to demand political change.
Who uses social media? When did the rise of social media start and what are the largest sites today? Here we answer these and other key questions to understand social media use around the world.
We begin with an outline of key trends and conclude with a perspective on the rate of adoption of social media relative to other modern communication technologies.
The first social media site to reach a million monthly active users was MySpace – it achieved this milestone around 2004. This is arguably the beginning of social media as we know it.9
In the interactive chart we plot monthly active users, by platform, since 2004. You can use the slider to focus on particular years, and you can click the ‘+ Add’ option to change series and track the evolution of other social media platforms.
This chart shows that there are some large social media sites that have been around for ten or more years, such as Facebook, YouTube and Reddit; but other large sites are much newer.
TikTok, for example, launched in September 2016 and by mid-2018 it had already reached half a billion users. To put this in perspective: TikTok gained on average about 20 million new users per month over this period.
The data also shows rapid changes in the opposite direction. Once-dominant platforms have disappeared. In 2008, Hi5, MySpace and Friendster were close competitors to Facebook, yet by 2012 they had virtually no share of the market. The case of MySpace is remarkable considering that in 2006 it temporarily surpassed Google as the most visited website in the US.
Most of the social media platforms that survived the last decade have shifted significantly in what they offer users. Twitter, for example, didn’t allow users to upload videos or images in the beginning. Since 2011 this is possible and today more than 50% of the content viewed on Twitter includes images and videos.

With 2.3 billion users, Facebook is the most popular social media platform today. YouTube, Instagram and WeChat follow, with more than a billion users. Tumblr and TikTok come next, with over half a billion users.
The bar chart here shows a ranking of the top social media platforms, year by year. You can drag the slider in this chart to see the ranking for other years.

The aggregate numbers mask a great deal of heterogeneity across platforms – some social media sites are much more popular than others among specific population groups.
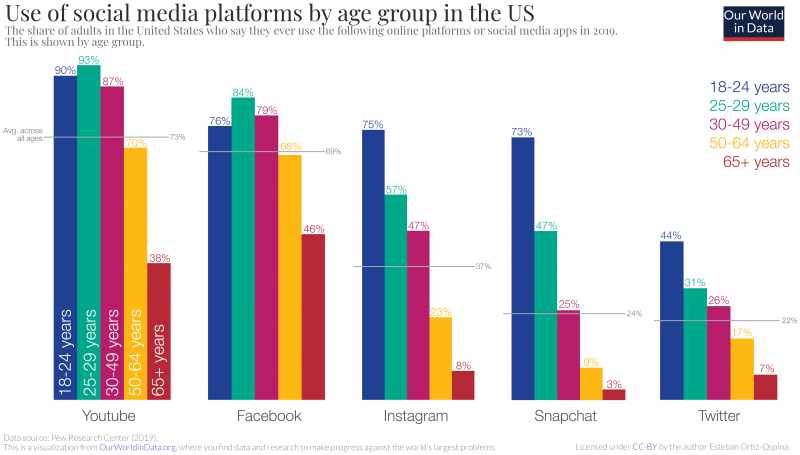
In general, young people are more likely to use social media than older people. But some platforms are much more popular among younger people. This is shown in this chart, where we plot the breakdown of social media use by age groups in the US.
For Snapchat and Instagram the ‘age gradient’ is extremely steep – the popularity of these platforms drops much faster with age. The majority of people under 25 use Snapchat (73%), while only 3% of people over 65 use it.
Since these platforms are relatively new, it’s hard to know how much of this age gradient is the result of a “cohort effect”. In other words: it’s unclear whether today’s young people will continue using Snapchat as they become older. If they do, the age gradient would narrow.
Let’s now look at gender differences.
This chart shows the percentage of men and women who use different platforms in the US. The diagonal line marks parity; so sites above the diagonal line are those more popular among men and sites below are those more popular among women. (Bubble sizes are proportional to the total number of users of each platform.)
For some platforms the gender differences are very large. The share of women who use Pinterest is more than twice as high as the share of men using this platform. For Reddit it is the other way around, the share of men is almost twice as high.

From a back-of-the-envelope calculation we know that, if Facebook has 2.3 billion users, then at least 30% of the world uses social media.10 This is of course just an average – for some world regions, and specifically for some population groups, usage rates are much higher.
Young people tend to use social media more frequently. In fact, in rich countries, where access to the internet is nearly universal, the vast majority of young adults use it.
The chart here shows the proportion of people aged 16 to 24 who use social networks across a selection of countries. As we can see, the average for the OECD is close to 90%.
If today’s young adults continue using social media throughout their life, then it’s likely that social media will continue growing rapidly as internet adoption expands throughout lower-income countries.

The increase in social media use over the last decade has, of course, come together with a large increase in the amount of time that people spend online.
In the US, adults spend more than 6 hours per day on digital media (apps and websites accessed through mobile phones, tablets, computers and other connected devices such as game consoles). As the chart here shows, this growth has been driven almost entirely by additional time spent on smartphones and tablets.11

According to a survey from the Pew Research Center, adults aged 18 to 29 in the US are more likely to get news indirectly via social media than directly from print newspapers or news sites; and they also report being online ‘almost constantly’.12
There is evidence that in other rich countries people also spend many hours per day online. This chart shows the number of hours young people spend on the internet across a selection of rich countries. As we can see, the average for the OECD is more than 4 hours per day, and in some countries the average is above 6 hours per day.

The percentage of US adults who use social media increased from 5% in 2005 to 79% in 2019. Even on a global stage the speed of diffusion is striking: Facebook surged from covering around 1.5% of the world population in 2008, to around 30% in 2018.13
How does this compare to the diffusion of other communication technologies that make part of our everyday life today?
The following chart provides some perspective.
Social media’s growth in the US is comparable – in speed and to some extent also in reach – to that of most modern communication-enabling technologies, including computers, smartphones and the internet.
The rise of social media is an extraordinary example of how quickly and drastically social behaviours can change: Something that is today part of the everyday life of one-third of the world population, was unthinkable less than a generation ago.
Fast changes like those brought about by social media always spark fears about possible negative effects. Specifically in the context of social media, a key question is whether these new communication technologies are having a negative impact on our mental health – this is an important question and we cover the evidence at Our World in Data here.

- Data: Total Population (in number of people), Internet Users (per 100 people), Fixed (wired) broadband subscriptions (per 100 people), Mobile cellular subscriptions
- Geographical Coverage: Worldwide
- Time Span: Dependent on the metric set but mostly from 1980 or 1990 onwards
- Available at: data.worldbank.org