You can download our complete Our World in Data CO2 and Greenhouse Gas Emissions database.
In our work on CO2 and Greenhouse Gases, we know that global emissions of carbon dioxide, methane, nitrous oxide and other gases have increased rapidly over the past century, and particularly over the last 50 years.
We would expect that these emissions have changed the concentration of these gases in the atmosphere. But how large has this effect been? How rapidly are these gases accumulating in the atmosphere?
In the charts below we look at long-run reconstructions of greenhouse gases to see how their concentrations have changed over time.
How have global CO2 concentrations changed over time?


The large growth in global CO2 emissions has had a significant impact on the concentrations of CO2 in Earth’s atmosphere. If we look at atmospheric concentrations over the past 2000 years, we see that levels were fairly stable at 270 to 285 parts per million (ppm) until the 18th century. Since the Industrial Revolution, global CO2 concentrations have been increasing rapidly.
If we look even longer-term – greater than 800,000 years into the past – we see that today’s concentrations are the highest they’ve been for at least 800,000 years.1 The cycles of peaks and troughs in CO2 concentrations track the cycles of ice ages (low CO2) and warmer interglacials (higher CO2). CO2 concentrations did not exceed 300ppm throughout these cycles – today it is well over 400ppm.
Atmospheric concentrations continue to rise, as shown here. Atmospheric concentrations have now broken the 400ppm threshold—considered its highest level in the last three million years. To begin to stabilise—or even reduce—atmospheric CO2 concentrations, our emissions need to not only stabilise but also decrease significantly.
Even if the world achieved a stabilization in CO2 emissions, this would not translate into the same for atmospheric concentrations. This is because CO2 accumulates in the atmosphere based on what we call a ‘residence time’. Residence time is the time required for emitted CO2 to be removed from the atmosphere through natural processes in Earth’s carbon cycle. The length of this time can vary—some CO2 is removed in less than 5 years through fast cycling processes, meanwhile other processes, such as absorption through land vegetation, soils and cycling into the deep ocean can take hundreds to thousands of years. If we stopped emitting CO2 today, it would take several hundred years before the majority of human emissions were removed from the atmosphere.2
Sinks and sources: what determines how much CO2 accumulates in the atmosphere?
Balance of carbon sources and sinks3
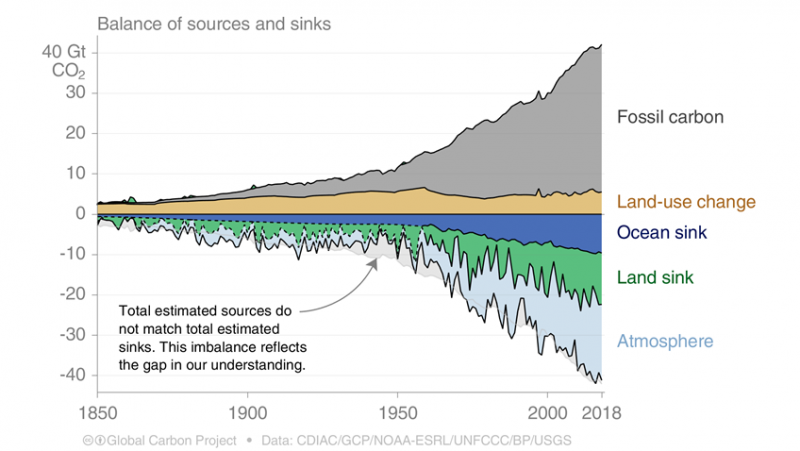
At first thought, we might assume that the carbon dioxide we emit from the burning of fossil fuels is exactly the amount that accumulates in the Earth’s atmosphere.
However, the carbon cycle – and factors that determine how much of this CO2 stays in the atmosphere – is a bit more complex than that. In it’s annual review of carbon emissions, the Global Carbon Project produces its Global Carbon Budget: this is an estimation of the balance of the various carbon sources and sinks.4
The figure shown charts the main sources and sinks of CO2. We have two key sources of CO2 – carbon released from the burning of fossil fuels, and the release of carbon from changes in land use (deforestation, for example). These are therefore shown as ‘positive’ CO2.
But we also have two main carbon ‘sinks’: both the ocean, and land sequester and store carbon. So, some of the CO2 we emit from fossil fuels and land-use change is absorbed and stored in the ocean, and land and soils. Only the remaining fraction – which is about half of global emissions – remains in the atmosphere.
It’s important to note – as we see from the figure shown – that these sinks are dynamic. The amount of CO2 absorbed by the ocean or land sink can vary significantly from year-to-year. And there is no guarantee that the amount of carbon they sequester will grow indefinitely: is our oceans become more ‘saturated’ in CO2 and it starts to absorb less, a larger share of our emissions each year will accumulate in the atmosphere.

This interactive chart shows the change in methane (CH4) concentrations in the atmosphere over the past few centuries.
Atmospheric methane is measured in parts per billion – ppb. We see that concentrations increased significantly throughout the 20th century, and particularly in the second half.
In fact, from 1900 to the year 2000, atmospheric methane doubled – from around 900 to 1800 ppb.

This interactive chart shows the change in nitrous oxide (N2O) concentrations in the atmosphere over the past few centuries.
Nitrous oxide concentrations are measured in parts per billion – ppb. Much like methane, we see that concentrations increased significantly throughout the 20th century, and particularly sharply in the second half.
This coincides with the rise of the use of nitrogenous fertilizers (agriculture is the largest source of N2O) and large increases in global food production.
To construct long-term series of CO2 concentrations in the atmosphere, we need methods to measure this in both the near-term and distant past. How do we measure or estimate these concentrations?
In more recent years, global concentrations of CO2 can be measured directly in the atmosphere using instrumentation sensor technology. The longest and most well-known records from direct CO2 measurement comes from the Mauna Loa Observatory (MLO) in Hawaii. The MLO has been measuring atmospheric composition since the 1950s, providing the clearest record of CO2 concentrations across the 20th and 21st century.
To reconstruct long-term CO2 concentrations, we have to rely on a number of geological and chemical analogues which record changes in atmospheric composition through time. The process of ice-coring allows for the longest extension of historical CO2 records, extending back 800,000 years. The most famous ice core used for historical reconstructions is the Vostok Ice Core in Antarctica. This core extends back 420,000 years and covers four glacial-interglacial periods.
Ice cores provide a preserved record of atmospheric compositions—with each layer representing a date further back in time. These can extend as deep at 3km. Ice cores preserve tiny bubbles of air which provide a snapshot of the atmospheric composition of a given period. Using chemical dating techniques (such as isotopic dating) researchers relate time periods to depths through an ice core. Looking at the Vostok Ice Core, researchers can say that the section of core 500m deep was formed approximately 30,000 years ago. CO2 concentration sensors can then be used to measure the concentration in air bubbles at 500m depth—this was approximately 190 parts per million. Combining these two methods, researchers estimate that 30,000 years ago, the CO2 concentration was 190ppm. Repeating this process across a range of depths, the change through time in these concentrations can be reconstructed.