You can download our complete Our World in Data CO2 and Greenhouse Gas Emissions database.
In discussions on climate change, we tend to focus on carbon dioxide (CO2) – the most dominant greenhouse gas produced by the burning of fossil fuels, industrial production, and land use change. We cover CO2 – global emissions, annual, cumulative, per capita, and consumption-based emissions – in great detail in our CO2 emissions page.
But CO2 is not the only greenhouse gas that is driving global climate change. There are a number of others – methane, nitrous oxide, and trace gases such as the group of ‘F-gases’ – which have contributed a significant amount of warming to date.
Here we look at total greenhouse gas (GHG) emissions across the world, plus breakdowns of other major gases including methane and nitrous oxide.
Annual greenhouse gas emissions: how much do we emit each year?


What are the world’s total greenhouse gas emissions every year? How much do we collectively emit?
This chart shows the change in global greenhouse gas emissions over time. Greenhouse gases are measured in ‘carbon dioxide-equivalents’ (CO2e).
Today, we collectively emit around 50 billion tonnes of CO2e each year. This is more than 40% higher than emissions in 1990, which were around 35 billion tonnes.
What are carbon dioxide equivalents (CO2e)?
Greenhouse gases have very different warming effects: one tonne of methane does not have the same impact on warming as one tonne of CO2. Carbon dioxide equivalents (CO2e) attempt to convert the warming impact of the range of greenhouse gases into a single metric.
This is done by multiplying each gas by its 100-year ‘global warming potential’ value: the amount of warming one tonne of the gas would create relative to one tonne of CO2 over a 100-year timescale. For example, if methane has a GWP100 value of 28, we would multiply methane emissions in tonnes by 28 to get its CO2e figure.
Total greenhouse gases are then measured as the sum for all of these gases.
We explain carbon dioxide equivalents, and how greenhouse gases are measured in more detail here.

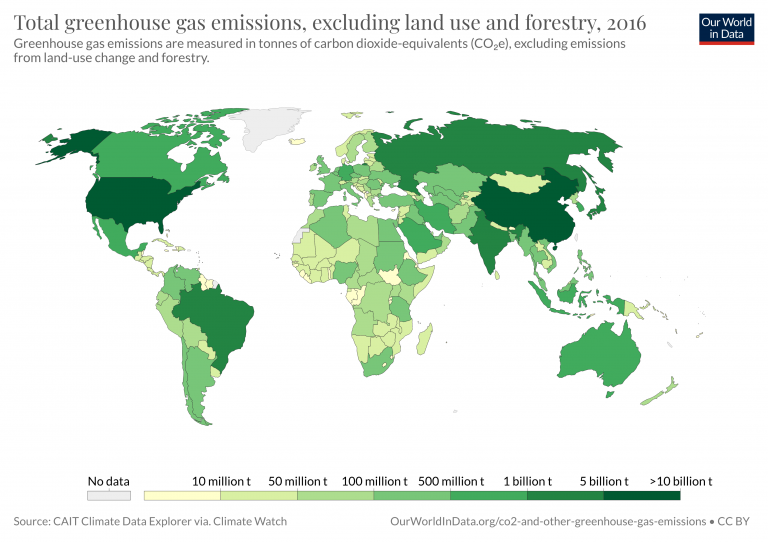

How do greenhouse gas emissions vary across the world?
This interactive chart shows annual greenhouse gas emissions – the amount a given country produces each year – across the world. Again, this is measured in tonnes of carbon dioxide equivalents.
As is the case with CO2 emissions, China is the world’s largest emitter of greenhouse gases today. It emits around twice as much as the United States, which is the second largest emitter. This is followed by India, Indonesia and Russia.
However, this is not the case when we adjust for population and look at per capita emissions.
Three tips on how to interact with this map
- By clicking on any country on the map you see the change over time in this country.
- By moving the time slider (below the map) you can see how the global situation has changed over time.
- You can focus on a particular world region using the dropdown menu to the top-right of the map.
Per capita greenhouse gas emissions: how much does the average person emit?


Total annual emissions allow us to see the world’s largest emitters in absolute terms. But they tend to tell a story of population – China and India, for example, are in the top three emitters, but are also the two most populous countries in the world.
How do emissions compare when we correct for population?
This interactive map shows per capita greenhouse gas emissions. This is measured in tonnes per person per year.
Here we see that many of the world’s smaller countries are the largest per capita emitters. These countries, such as Guyana, Brunei, Botswana, the United Arab Emirates and Kuwait tend to be large oil and/or gas producers.
Of the major emitters we see large differences in per capita emissions: in the US, the average person emits more than 18 tonnes; in China its less than half, at 8 tonnes; and in India, emissions are much smaller at around 2.5 tonnes.
By gas: how much does each contribute to total greenhouse gas emissions?
As we discussed in the previous sections, total greenhouse gas emissions are the sum of emissions of various gases: carbon dioxide, methane, nitrous oxide, and smaller trace gases such as hydrofluorocarbons (HFCs) and sulfur hexafluoride (SF6).
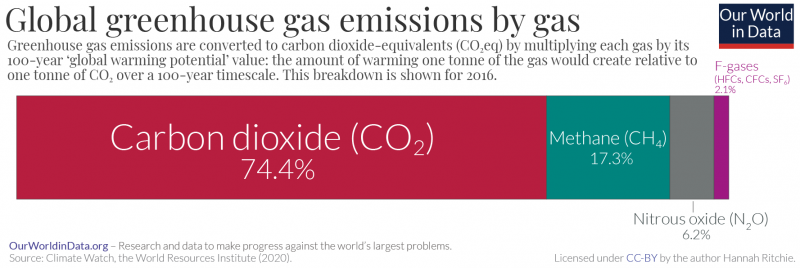
How much does each gas contribute to global greenhouse gas emissions?
In the chart we see the breakdown of global emissions in 2016, measured on the basis of carbon dioxide-equivalents (CO2e).
Carbon dioxide was the largest contributor , accounting for around three-quarters (74.4%) of total emissions. Methane contributed 17.3%; nitrous oxide, 6.2%; and other emissions (HFCs, CFCs, SF6), 2.1%.
Where does methane come from?
Agriculture, fossil fuel production, and the management of waste are the primary sources of methane emissions:
- Livestock (ruminant animals – cattle, goats, and sheep) produce methane through a process called ‘enteric fermentation’.
- Rice cultivation produces methane – waterlogged paddy fields provide an ideal environment for microbes to produce methane in a process called ‘methanogenesis’.
- Biomass burning: methane is produced from the incomplete combustion of large-scale burning of woodlands, savanna and agricultural waste.
- Waste: the decomposition of organic waste in landfills produces methane.
- Fossil fuel production: methane can be released during oil and gas extraction – a category often termed ‘fugitive emissions’.
What is the warming potential of methane compared to CO2?
Methane is a much stronger greenhouse gas than CO2 in terms of its ‘warming potential’. Over a 100-year timescale, and without considering climate feedbacks, one tonne of methane would generate 28 times the amount of warming as one tonne of CO2.1,2,3
This means that, despite contributing only 3% of greenhouse gas emissions in terms of mass (tonnes of carbon), methane has been responsible for around 23% of radiative forcing since 1750.4
How long does methane stay in the atmosphere?
Methane is a very ‘short-lived’ greenhouse gas. This means that after it accumulates in the atmosphere, it is removed relatively quickly – on the timescale of decades in contrast to CO2 which can persist in the atmosphere for centuries or even thousands of years. The average ‘lifetime’ of methane in the atmosphere is around 12 years.5
This means that reductions in methane emissions quickly result in reductions in the methane concentrations in the atmosphere. This would reduce its warming effects. So, tackling methane emissions could be an effective and rapid way to mitigate some of the impacts of climate change – on the timeframe of decades.6
Annual methane emissions: how much do we emit each year?


This interactive chart shows methane (CH₄) emissions across the world.
Methane emissions are measured in tonnes of carbon dioxide equivalent (CO2e), so are weighted for its 100-year global warming potential value.
Per capita methane emissions: how much does the average person emit?

Total annual emissions allow us to see the world’s largest emitters in absolute terms. But they can tell a story of population rather than lifestyle or individual impact.
How do emissions compare when we correct for population?
This interactive map shows per capita methane emissions. This is measured in tonnes of carbon dioxide equivalents per person per year.
Where does nitrous oxide come from?
Most of our nitrous oxide emissions come from agriculture: N2O is produced when we apply nitrogen fertilizers to soils.
Nitrous oxide is produced by microbes in nearly all soils. But the application of nitrogen fertilizers makes much more nitrogen readily available for microbes to convert to N2O – this is because not all of the applied nutrients are taken up by crops.
Nitrous oxide is not only produced when synthetic nitrogen fertilizer is applied; the same processes occur when we use organic fertilizers such as animal manure.
What is the warming potential of nitrous oxide compared to CO2?
Nitrous oxide is a much stronger greenhouse gas than CO2 in terms of its ‘warming potential’. Over a 100-year timescale, and without considering climate feedbacks, one tonne of nitrous oxide would generate 265 times the amount of warming as one tonne of CO2.7,8
How long does nitrous oxide stay in the atmosphere?
The average ‘lifetime’ of nitrous oxide in the atmosphere is around 121 years.9
This is typically shorter than CO2 (which can persist for centuries or even thousands of years), but longer than methane (which has an average lifetime of 12 years).
Annual nitrous oxide emissions: how much do we emit each year?

This interactive chart shows nitrous oxide (N2O) emissions across the world.
Nitrous oxide emissions are measured in tonnes of carbon dioxide equivalent (CO2e), so are weighted for its 100-year global warming potential value.
Per capita nitrous oxide emissions: how much does the average person emit?


How do emissions compare when we correct for population?
This interactive map shows per capita nitrous oxide emissions. This is measured in tonnes of carbon dioxide equivalents per person per year.
To reduce our emissions of greenhouse gases we need to know where they are coming from. Which activities contribute most to emissions – is it transport, agriculture, electricity or land use? What are our opportunities to reduce emissions from different sectors?
In our page on Emissions by Sector we look at the breakdown of emissions for each country, and for each of the major greenhouse gases to identify which are the largest contributors.

How do we quantify greenhouse gas emissions?
The standard metric used to quantify GHG emissions is ‘carbon dioxide-equivalents’. This is the metric adopted by the United Nations Framework Convention on Climate Change (UNFCCC); is used in official GHG reporting and target-setting by countries and institutions; and is the most widely adopted metric used within the scientific literature. As some researchers have highlighted, the lack of life-cycle assessment data disaggregated by gas can result in the loss of important information which could help us develop more optimal strategies for climate mitigation.10
What are carbon dioxide-equivalents? Carbon dioxide (CO2) is the most important greenhouse gas, but not the only one – gases such as methane and nitrous oxide are also a driver of global warming. Carbon dioxide-equivalents (CO2eq) try to sum all of the warming impacts of the different greenhouse gases together in order to give a single measure of total greenhouse gas emissions. Two things make this more complicated: the gases have different ‘strengths’ of warming; and gases persist for different amounts of time in the atmosphere.
To convert non-CO2 gases into their carbon dioxide-equivalents we multiply their mass (e.g. kilograms of methane emitted) by their ‘global warming potential’ (GWP). GWP measures the warming impacts of a gas compared to CO2; it basically measures the ‘strength’ of the greenhouse gas averaged over a chosen time horizon. The standard way to do this is to evaluate the GWP over a 100-year timescale (GWP100). GWP100 is the accounting metric adopted by the Intergovernmental Panel on Climate Change (IPCC) in inventory guidelines, although their Fifth Assessment report (AR5) did not explicitly recommend its use. Chapter 8 of this report described both GWP and Global Temperature-change Potential (GTP) as examples of different metrics which were useful dependent on the question being asked.
The GWP100 value for methane from AR5 is 28 (or 34 if climate feedback processes are included).11 This means that emitting one kilogram of methane creates 28 times the amount of warming as one kilogram of CO2 averaged over the next 100 years. But what this doesn’t account for is the fact that methane is a short-lived greenhouse gas. It has a very strong warming impact when it’s first emitted, but this warming impact diminishes over the following decades. Whereas, if you emitted the same amount of CO2, it could persist for centuries.
Using this GWP100 metric can therefore misrepresent the impact of short-lived gases such as methane in both directions.12 It underestimates short-term warming: the warming impact of methane when it’s first emitted and the following years is much higher than the ‘28’ value assigned by GWP100. Some people therefore argue we should use a value which represents the global warming potential over 20 years (GWP20) since it gives a better indication of short-term warming. The IPCC report a GWP20 value of 84 for methane (86 if feedbacks are included). Others argue that GWP100 overestimates long-term impacts of methane; the methane emitted today will not be around a century from now. These differences are reflected by the large changes in GTP over different time horizons. The GTP100 value for methane is 4, whereas GTP20 is 67.
This makes it difficult to reconcile these warming impacts into a single metric. And our choice of metric can have an impact on how we prioritise GHG reduction strategies: do we first target strong but short-lived gases such as methane? This may slow warming in the short-term – a reasonable argument if we are concerned about approaching temperature-induced tipping points. Or do we focus instead on the persistent CO2 emissions which will be the primary driver of long-term temperature impacts?
Some researchers have developed new methods which aim to provide a closer representation of the actual temperature response to different gases. Myles Allen, Michelle Cain and colleagues at the University of Oxford’s Martin School lead a research programme on climate pollutants, which look directly at this challenge.
They have proposed a new way to represent short-lived greenhouse gas emissions – GWP* – which aims to be more representative of warming response.13,14 Dr Michelle Cain, one of the lead researchers in this area, discusses the challenges of GHG metrics and the role of a new GWP* metric, in an article in the Carbon Brief here.
GWP* is used to calculate CO2-warming-equivalent emissions, which reflects that (a) increasing methane emissions would immediately increase global temperature, (b) rapidly decreasing methane emissions would immediately reduce global temperature, and (c) a gradual decline in methane emissions would stabilise the global temperature attributed to methane. Scenarios (b) and (c) are very different to CO2, as rapidly or gradually decreasing CO2 emissions leads to further global temperature increases (only the rate of temperature increase slows).
This is explored further in a Oxford Martin School briefing note, found here, and the recent publication by researchers John Lynch, Michelle Cain, Raymond Pierrehumbert and Myles Allen (2020).15
How do we account for the warming of different gases?

As we discussed in previous sections, greenhouse gases vary in their relative contributions to global warming; i.e. one tonne of methane does not have the same impact on warming as one tonne of carbon dioxide.
We define these differences using the metric, ‘Global Warming Potential’ (GWP). GWP can be defined on a range of time-periods, however the most commonly used (and that adopted by the IPCC) is the 100-year timescale (GWP100).16
In the chart we see the GWP100 value of key greenhouse gases relative to carbon dioxide. The GWP100 metric measures the relative warming impact one molecule or unit mass of a greenhouse gas relative to carbon dioxide over a 100-year timescale. For example, one tonne of methane would have 28 times the warming impact of tonne of carbon dioxide over a 100-year period. GWP100 values are used to combine greenhouse gases into a single metric of emissions called carbon dioxide equivalents (CO2e). CO2e is derived by multiplying the mass of emissions of a specific greenhouse gas by its equivalent GWP100 factor. The sum of all gases in their CO2e form provide a measure of total greenhouse gas emissions.
Why do we not have long-term estimates on total greenhouse gas emissions?
You might notice that our estimates of total greenhouse gas emissions are not available on the long-term timescales we have for CO2 emissions. In our work on CO2 we have global, regional and country estimates extending back centuries – all the way back to 1750. For total greenhouse gases we only have this data back to 1990.
Why do we only have GHG estimates for a few decades?
CO2 emissions from fossil fuels and industry are – in comparison to other greenhouse gases – easier to estimate. Most of our CO2 emissions come from the burning of coal, oil and gas for energy. At the country, regional and global level we have good data or can provide reasonable approximations of the quantity of energy produced, and the sources of this energy. We can approximate how much coal, oil and gas is burned every year. We know how much CO2 is emitted when we produce a unit from a fuel source (for example, a kilowatt-hour from coal). These are called ’emission factors’ – which we compare here. By multiplying the quantity of energy produced from coal, oil and gas by their respective ’emissions factors’, we can estimate how much CO2 is emitted. In our work on CO2 emissions we discuss in more detail how long-term emissions are calculated.
But estimating emissions of other greenhouse gases is more difficult. You will notice that data on methane and nitrous oxide emissions only date back to 1990. The Global Carbon Project publishes a ‘Carbon Budget’ on CO2 emissions, and natural sources and sinks of CO2 for all countries every year.17 This budget extends back more than half a century. But it has only very recently published its first Methane Budget (published in 2020), and at time of publication its first N2O budget is not yet available.18
A large share of methane and nitrous oxide emissions come from agriculture, land use and waste. Getting accurate data for all countries, and extending back centuries on the emissions from livestock, soils and different land types is much more difficult. Even if we know how much food is produced from agriculture, and we have standard emissions factors of how much greenhouse gases are emitted per unit of food (for example, per kilogram of rice), this can vary a lot depending on the location, soil type and specific farming practices. We explored this in detail in our article on the differences in the emissions of different food types: depending on the production system, beef in one location can emit more than 10 times as much as beef produced elsewhere. So, unlike CO2 from energy, emissions factors for agriculture and land use can be highly variable.
This makes it difficult to estimate long-term emissions for methane and nitrous oxide (and other greenhouse gases which exist in lower concentrations). As a result, estimates of total greenhouse gas emissions are only available on shorter timescales, and often not at the same resolution as CO2 data.