You can download our complete Our World in Data CO2 and Greenhouse Gas Emissions database.
Global greenhouse gas emissions continue to rise, at a time when they need to be rapidly falling.
To effectively reduce emissions we need to know where they are coming from – which sectors contribute the most? How can we use this understanding to develop effective solutions and mitigation strategies?
Below we look at the breakdown of emissions – total greenhouse gases, plus carbon dioxide, methane and nitrous oxide individually – by sector.
To prevent severe climate change we need to rapidly reduce global greenhouse gas emissions. The world emits around 50 billion tonnes of greenhouse gases each year [measured in carbon dioxide equivalents (CO2eq)].1
To figure out how we can most effectively reduce emissions and what emissions can and can’t be eliminated with current technologies, we need to first understand where our emissions come from.
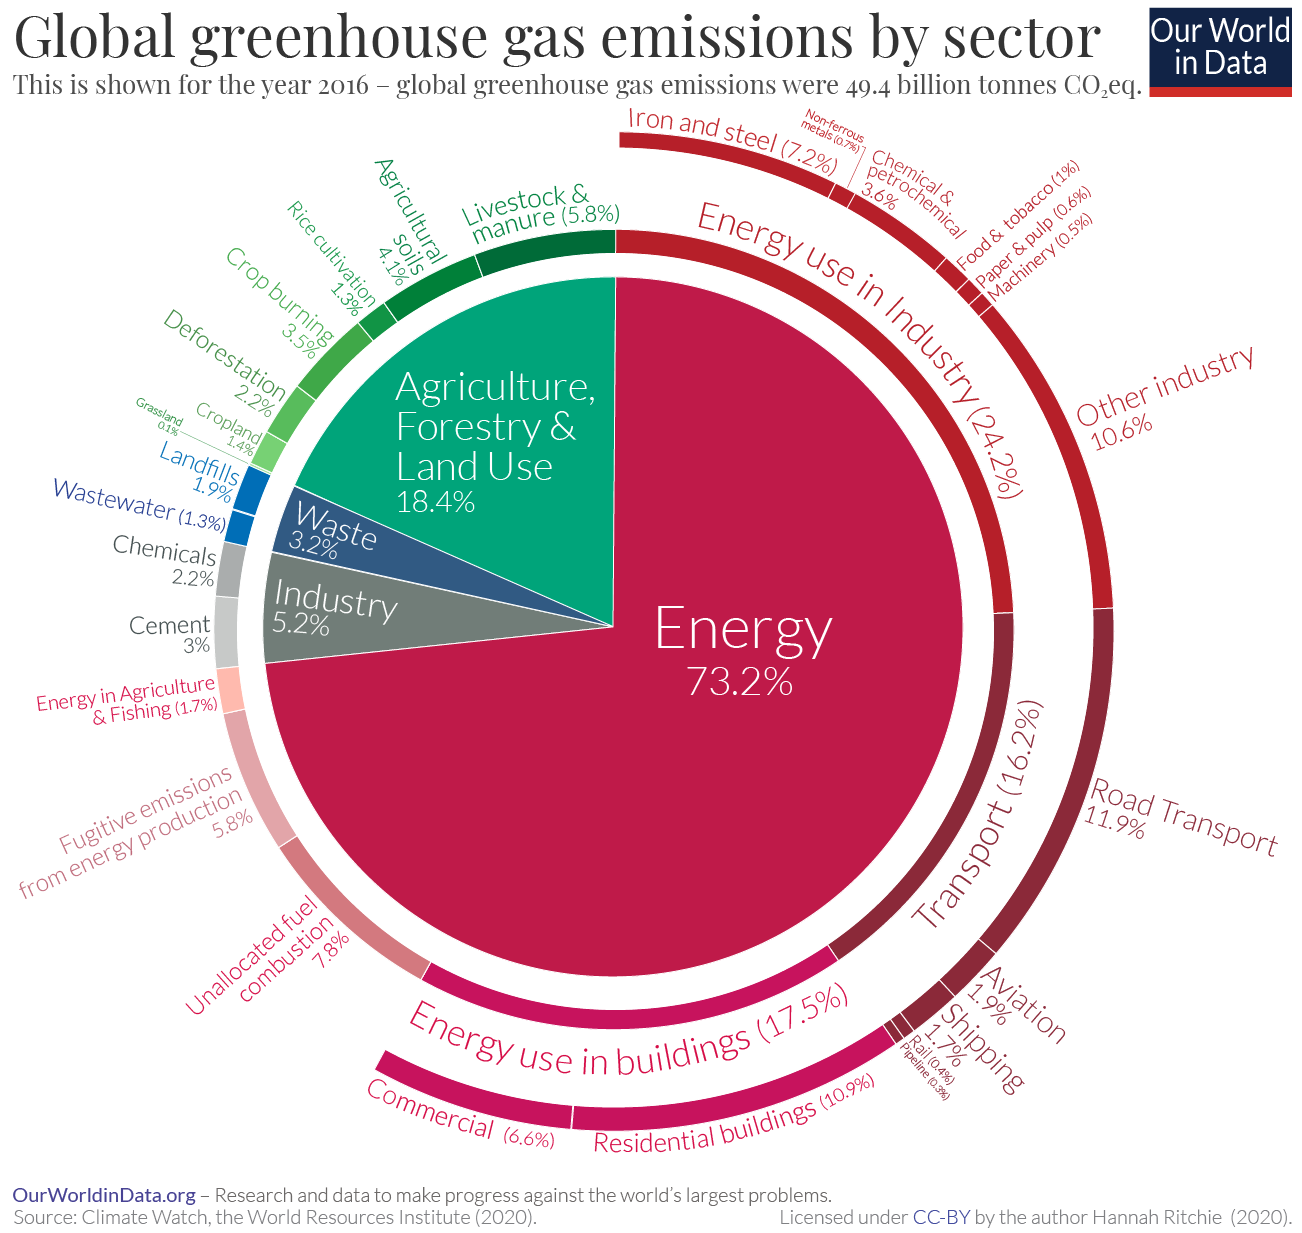
In this post I present only one chart, but it is an important one – it shows the breakdown of global greenhouse gas emissions in 2016.2 This is the latest breakdown of global emissions by sector, published by Climate Watch and the World Resources Institute.3,4
The overall picture you see from this diagram is that almost three-quarters of emissions come from energy use; almost one-fifth from agriculture and land use [this increases to one-quarter when we consider the food system as a whole – including processing, packaging, transport and retail]; and the remaining 8% from industry and waste.
To know what’s included in each sector category, I provide a short description of each. These descriptions are based on explanations provided in the IPCC’s Fifth Assessment Report AR5) and a methodology paper published by the World Resources Institute.5,6
It is clear from this breakdown that a range of sectors and processes contribute to global emissions. This means there is no single or simple solution to tackle climate change. Focusing on electricity, or transport, or food, or deforestation alone is insufficient.
Even within the energy sector – which accounts for almost three-quarters of emissions – there is no simple fix. Even if we could fully decarbonize our electricity supply, we would also need to electrify all of our heating and road transport. And we’d still have emissions from shipping and aviation – which we do not yet have low-carbon technologies for – to deal with.
To reach net-zero emissions we need innovations across many sectors. Single solutions will not get us there.
Let’s walk through each of the sectors and sub-sectors in the pie chart, one-by-one.
Energy (electricity, heat and transport): 73.2%
Energy use in industry: 24.2%
Iron and Steel (7.2%): energy-related emissions from the manufacturing of iron and steel.
Chemical & petrochemical (3.6%): energy-related emissions from the manufacturing of fertilizers, pharmaceuticals, refrigerants, oil and gas extraction, etc.
Food and tobacco (1%): energy-related emissions from the manufacturing of tobacco products and food processing (the conversion of raw agricultural products into their final products, such as the conversion of wheat into bread).
Non-ferrous metals: 0.7%: Non-ferrous metals are metals which contain very little iron: this includes aluminium, copper, lead, nickel, tin, titanium and zinc, and alloys such as brass. The manufacturing of these metals requires energy which results in emissions.
Paper & pulp (0.6%): energy-related emissions from the conversion of wood into paper and pulp.
Machinery (0.5%): energy-related emissions from the production of machinery.
Other industry (10.6%): energy-related emissions from manufacturing in other industries including mining and quarrying, construction, textiles, wood products, and transport equipment (such as car manufacturing).
Transport: 16.2%
This includes a small amount of electricity (indirect emissions) as well as all direct emissions from burning fossil fuels to power transport activities. These figures do not include emissions from the manufacturing of motor vehicles or other transport equipment – this is included in the previous point ‘Energy use in Industry’.
Road transport (11.9%): emissions from the burning of petrol and diesel from all forms of road transport which includes cars, trucks, lorries, motorcycles and buses. Sixty percent of road transport emissions come from passenger travel (cars, motorcycles and buses); and the remaining forty percent from road freight (lorries and trucks). This means that, if we could electrify the whole road transport sector, and transition to a fully decarbonized electricity mix, we could feasibly reduce global emissions by 11.9%.
Aviation (1.9%): emissions from passenger travel and freight, and domestic and international aviation. 81% of aviation emissions come from passenger travel; and 19% from freight.7 From passenger aviation, 60% of emissions come from international travel, and 40% from domestic.
Shipping (1.7%): emissions from the burning of petrol or diesel on boats. This includes both passenger and freight maritime trips.
Rail (0.4%): emissions from passenger and freight rail travel.
Pipeline (0.3%): fuels and commodities (e.g. oil, gas, water or steam) often need to be transported (either within or between countries) via pipelines. This requires energy inputs, which results in emissions. Poorly constructed pipelines can also leak, leading to direct emissions of methane to the atmosphere – however, this aspect is captured in the category ‘Fugitive emissions from energy production’.
Energy use in buildings: 17.5%
Residential buildings (10.9%): energy-related emissions from the generation of electricity for lighting, appliances, cooking etc. and heating at home.
Commercial buildings (6.6%): energy-related emissions from the generation of electricity for lighting, appliances, etc. and heating in commercial buildings such as offices, restaurants, and shops.
Unallocated fuel combustion (7.8%)
Energy-related emissions from the production of energy from other fuels including electricity and heat from biomass; on-site heat sources; combined heat and power (CHP); nuclear industry; and pumped hydroelectric storage.
Fugitive emissions from energy production: 5.8%
Fugitive emissions from oil and gas (3.9%): fugitive emissions are the often-accidental leakage of methane to the atmosphere during oil and gas extraction and transportation, from damaged or poorly maintained pipes. This also includes flaring – the intentional burning of gas at oil facilities. Oil wells can release gases, including methane, during extraction – producers often don’t have an existing network of pipelines to transport it, or it wouldn’t make economic sense to provide the infrastructure needed to effectively capture and transport it. But under environmental regulations they need to deal with it somehow: intentionally burning it is often a cheap way to do so.
Fugitive emissions from coal (1.9%): fugitive emissions are the accidental leakage of methane during coal mining.
Energy use in agriculture and fishing (1.7%)
Energy-related emissions from the use of machinery in agriculture and fishing, such as fuel for farm machinery and fishing vessels.
Direct Industrial Processes: 5.2%
Cement (3%): carbon dioxide is produced as a byproduct of a chemical conversion process used in the production of clinker, a component of cement. In this reaction, limestone (CaCO3) is converted to lime (CaO), and produces CO2 as a byproduct. Cement production also produces emissions from energy inputs – these related emissions are included in ‘Energy Use in Industry’.
Chemicals & petrochemicals (2.2%): greenhouse gases can be produced as a byproduct from chemical processes – for example, CO2 can be emitted during the production of ammonia, which is used for purifying water supplies, cleaning products, and as a refrigerant, and used in the production of many materials, including plastic, fertilizers, pesticides, and textiles. Chemical and petrochemical manufacturing also produces emissions from energy inputs – these related emissions are included in ‘Energy Use in Industry’.
Waste: 3.2%
Wastewater (1.3%): organic matter and residues from animals, plants, humans and their waste products can collect in wastewater systems. When this organic matter decomposes it produces methane and nitrous oxide.
Landfills (1.9%): landfills are often low-oxygen environments. In these environments, organic matter is converted to methane when it decomposes.
Agriculture, Forestry and Land Use: 18.4%
Agriculture, Forestry and Land Use directly accounts for 18.4% of greenhouse gas emissions. The food system as a whole – including refrigeration, food processing, packaging, and transport – accounts for around one-quarter of greenhouse gas emissions. We look at this in detail here.
Grassland (0.1%): when grassland becomes degraded, these soils can lose carbon, converting to carbon dioxide in the process. Conversely, when grassland is restored (for example, from cropland), carbon can be sequestered. Emissions here therefore refer to the net balance of these carbon losses and gains from grassland biomass and soils.
Cropland (1.4%): depending on the management practices used on croplands, carbon can be lost or sequestered into soils and biomass. This affects the balance of carbon dioxide emissions: CO2 can be emitted when croplands are degraded; or sequestered when they are restored. The net change in carbon stocks is captured in emissions of carbon dioxide. This does not include grazing lands for livestock.
Deforestation (2.2%): net emissions of carbon dioxide from changes in forestry cover. This means reforestation is counted as ‘negative emissions’ and deforestation as ‘positive emissions’. Net forestry change is therefore the difference between forestry loss and gain. Emissions are based on lost carbon stores from forests and changes in carbon stores in forest soils.
Crop burning (3.5%): the burning of agricultural residues – leftover vegetation from crops such as rice, wheat, sugar cane, and other crops – releases carbon dioxide, nitrous oxide and methane. Farmers often burn crop residues after harvest to prepare land for the resowing of crops.
Rice cultivation (1.3%): flooded paddy fields produce methane through a process called ‘anaerobic digestion’. Organic matter in the soil is converted to methane due to the low-oxygen environment of water-logged rice fields. 1.3% seems substantial, but it’s important to put this into context: rice accounts for around one-fifth of the world’s supply of calories, and is a staple crop for billions of people globally.8
Agricultural soils (4.1%): Nitrous oxide – a strong greenhouse gas – is produced when synthetic nitrogen fertilizers are applied to soils. This includes emissions from agricultural soils for all agricultural products – including food for direct human consumption, animal feed, biofuels and other non-food crops (such as tobacco and cotton).
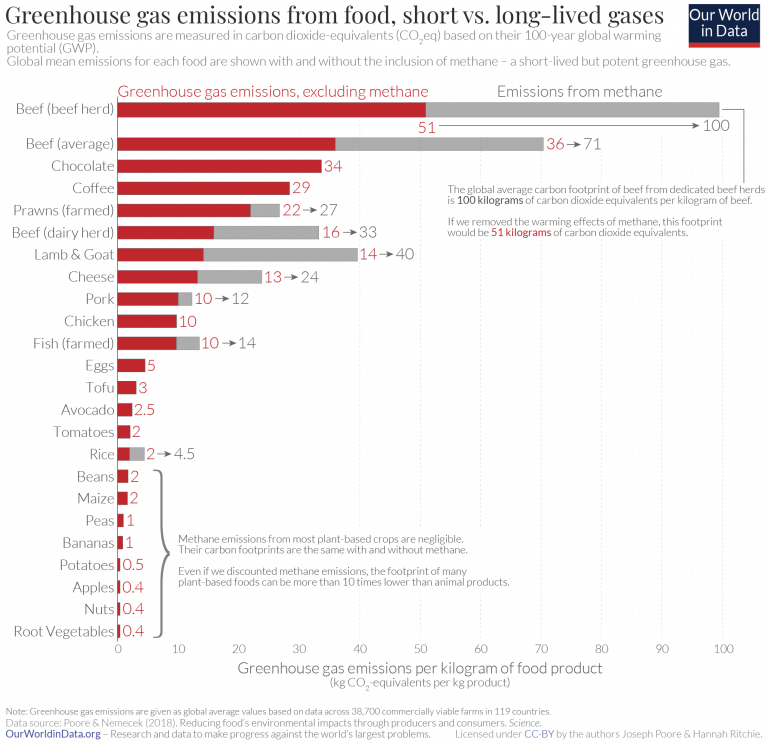
Livestock & manure (5.8%): animals (mainly ruminants, such as cattle and sheep) produce greenhouse gases through a process called ‘enteric fermentation’ – when microbes in their digestive systems break down food, they produce methane as a by-product. This means beef and lamb tend to have a high carbon footprint, and eating less is an effective way to reduce the emissions of your diet.
Nitrous oxide and methane can be produced from the decomposition of animal manures under low oxygen conditions. This often occurs when large numbers of animals are managed in a confined area (such as dairy farms, beef feedlots, and swine and poultry farms), where manure is typically stored in large piles or disposed of in lagoons and other types of manure management systems ‘Livestock’ emissions here include direct emissions from livestock only – they do not consider impacts of land use change for pasture or animal feed.
[Clicking on this visualization will open it in higher-resolution]
Annual greenhouse gas emissions by sector

Where do our greenhouse gas emissions come from?
This chart shows the breakdown of total greenhouse gases (the sum of all greenhouse gases, measured in tonnes of carbon dioxide equivalents) by sector.
Here we see that electricity and heat production are the largest contributor to global emissions. This is followed by transport, manufacturing and construction (largely cement and similar materials), and agriculture.
But this is not the same everywhere. If we look at the United States, for example, transport is a much larger contributor than the global average. In Brazil, the majority of emissions come from agriculture and land use change.
How you can interact with this chart
On these charts you see the button Change Country in the bottom left corner – with this option you can switch the chart to any other country in the world.
Per capita greenhouse gas emissions: where do our emissions come from?

Related article:
Looking at the breakdown of greenhouse gases by sector on aggregate is essential for countries to understand where emissions reductions could have the largest impact. But it can often be unintuitive for individuals to see where there emissions are coming from.
In this chart we show how the average person’s emissions would be distributed across the different sectors – in effect, this shows the average ‘footprint’, measured in tonnes of carbon dioxide equivalents per year.
How you can interact with this chart
- On these charts you see the button Change Country in the bottom left corner – with this option you can switch the chart to any other country in the world.
- If you drag the blue time-slider you will see the bar chart transform into a line chart, and show the change over time.
Annual CO2 emissions by sector

The above charts looked total greenhouse gas emissions – this included other gases such as methane, nitrous oxide, and smaller trace gases.
How does this breakdown look if we focus only on carbon dioxide (CO2) emissions? Where does our CO2 come from?
This chart shows the distribution of CO2 emissions across sectors.
The global breakdown for CO2 is similar to that of total greenhouse gases – electricity and heat production dominates, followed by transport, and manufacturing and construction. One key difference is that direct agricultural emissions (if we exclude land use change and forestry) are not shown; most direct emissions from agriculture result from methane (production from livestock) and nitrous oxide (released from the application of fertilizers).
Like total greenhouse gas emissions, this breakdown varies between countries.
Per capita CO2: where do our emissions come from?

In this chart we show the per capita breakdown of CO2 emissions by sector. This is measured in tonnes per person per year.
This allows us to better understand our domestic carbon footprint. However, it does not correct for the goods and services we buy from other countries.
Annual CH4 emissions by sector

The breakdown of CO2 emissions mirrors total greenhouse gas emissions closely.
The distribution of methane emissions across sectors is notably different. This chart shows methane emissions by sector, measured in tonnes of carbon dioxide equivalents.
We see that, globally, agriculture is the largest contributor to methane emissions. Most of this methane comes from livestock (they produce methane through their digestive processes, in a process known as ‘enteric fermentation’). Rice production is also a large contributor to methane emissions.
Aside from agriculture, fugitive emissions produce a significant amount of methane. ‘Fugitive emissions’ represent the unintentional leaks of gas from processes such as fracking, and more traditional oil and gas extraction and transportation. This can happen when gas is transported through poorly maintained pipes, for example.
Waste is third largest contributor. Methane is produced in landfills when organic materials decompose.
Per capita CH4: where do our emissions come from?

Related article:
In this chart we show the per capita breakdown of methane (CH4) emissions by sector. This is measured in tonnes per person per year.
How you can interact with this chart
- On these charts you see the button Change Country in the bottom left corner – with this option you can switch the chart to any other country in the world.
- If you drag the blue time-slider you will see the bar chart transform into a line chart, and show the change over time.
Annual N2O emissions by sector

Nearly all of our nitrous oxide (N2O) emissions come from agriculture, as this chart shows.
Nitrous oxide is produced by microbes in nearly all soils. But the application of nitrogen fertilizers makes much more nitrogen readily available for microbes to convert to N2O – this is because not all of the applied nutrients are taken up by crops.
As the application of nitrogen fertilizers has rapidly increased over the past 50 years in particular, N2O emissions have also increased. But nitrous oxide is not only produced when synthetic nitrogen fertilizer is applied; the same processes occur when we use organic fertilizers such as animal manure.
Per capita N2O: where do our emissions come from?

In this chart we show the per capita breakdown of nitrous oxide (N2O) emissions by sector. This is measured in tonnes per person per year.
As expected, nearly all of our nitrous oxide emissions come from agriculture.
When it comes to tackling climate change, the focus tends to be on ‘clean energy’ solutions – the deployment of renewable or nuclear energy; improvements in energy efficiency; or transition to low-carbon transport. Indeed, energy, whether in the form of electricity, heat, transport or industrial processes, account for the majority – 76% – of greenhouse gas (GHG) emissions.9
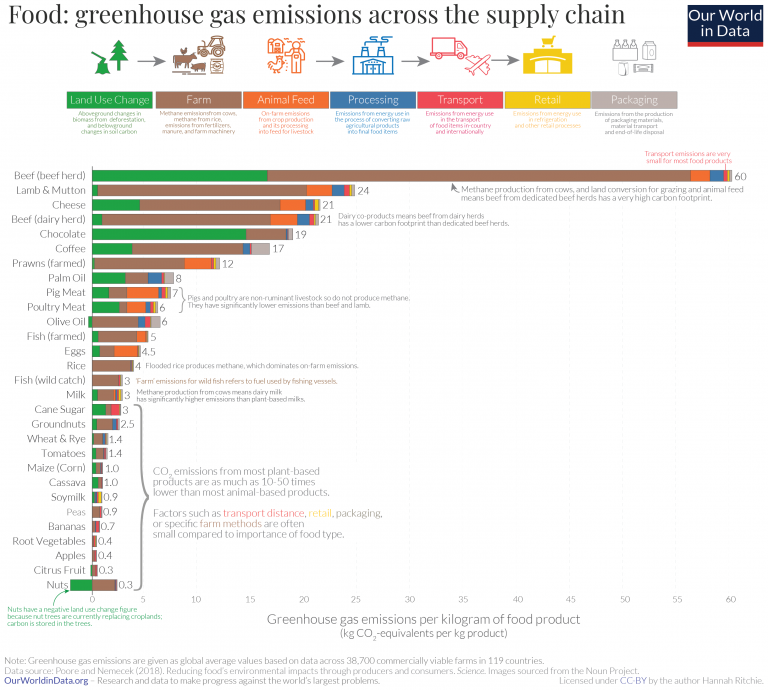
But the global food system, which encompasses production, and post-farm process such as processing, and distribution is also a key contributor to emissions. And it’s a problem for which we don’t yet have viable technological solutions.
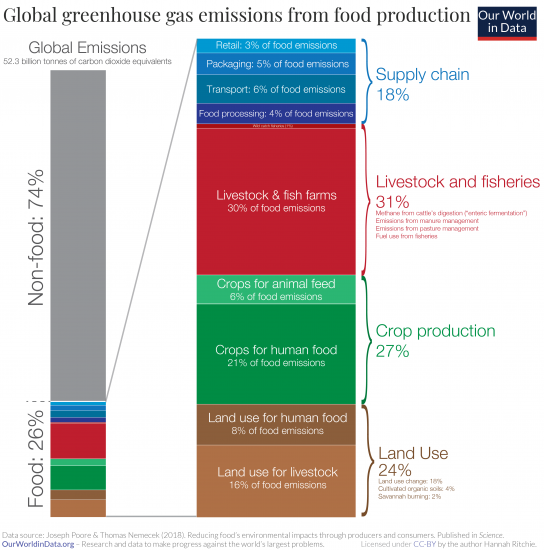
The visualization shown here – based on data from the meta-analysis by Joseph Poore and Thomas Nemecek (2018), published in Science – summarizes food’s share of total emissions and breaks it down by source.10
Food is responsible for approximately 26% of global GHG emissions.
There are four key elements to consider when trying to quantify food GHG emissions. These are shown by category in the visualization:
Livestock & fisheries account for 31% of food emissions.
Livestock – animals raised for meat, dairy, eggs and seafood production – contribute to emissions in several ways. Ruminant livestock – mainly cattle – for example, produce methane through their digestive processes (in a process known as ‘enteric fermentation’). Manure management, pasture management, and fuel consumption from fishing vessels also fall into this category. This 31% of emissions relates to on-farm ‘production’ emissions only: it does not include land use change or supply chain emissions from the production of crops for animal feed: these figures are included separately in the other categories.
Crop production accounts for 27% of food emissions.
21% of food’s emissions comes from crop production for direct human consumption, and 6% comes from the production of animal feed. They are the direct emissions which result from agricultural production – this includes elements such as the release of nitrous oxide from the application of fertilizers and manure; methane emissions from rice production; and carbon dioxide from agricultural machinery.
Land use accounts for 24% of food emissions.
Twice as many emissions result from land use for livestock (16%) as for crops for human consumption (8%).11Agricultural expansion results in the conversion of forests, grasslands and other carbon ‘sinks’ into cropland or pasture resulting in carbon dioxide emissions. ‘Land use’ here is the sum of land use change, savannah burning and organic soil cultivation (plowing and overturning of soils).
Supply chains account for 18% of food emissions.
Food processing (converting produce from the farm into final products), transport, packaging and retail all require energy and resource inputs. Many assume that eating local is key to a low-carbon diet, however, transport emissions are often a very small percentage of food’s total emissions – only 6% globally. Whilst supply chain emissions may seem high, at 18%, it’s essential for reducing emissions by preventing food waste. Food waste emissions are large: one-quarter of emissions (3.3 billion tonnes of CO2eq) from food production ends up as wastage either from supply chain losses or consumers. Durable packaging, refrigeration and food processing can all help to prevent food waste. For example, wastage of processed fruit and vegetables is ~14% lower than fresh, and 8% lower for seafood.12
Reducing emissions from food production will be one of our greatest challenges in the coming decades. Unlike many aspects of energy production where viable opportunities for upscaling low-carbon energy – renewable or nuclear energy – are available, the ways in which we can decarbonize agriculture are less clear. We need inputs such as fertilizers to meet growing food demands, and we can’t stop cattle from producing methane. We will need a menu of solutions: changes to diets; food waste reduction; improvements in agricultural efficiency; and technologies that make low-carbon food alternatives scalable and affordable.
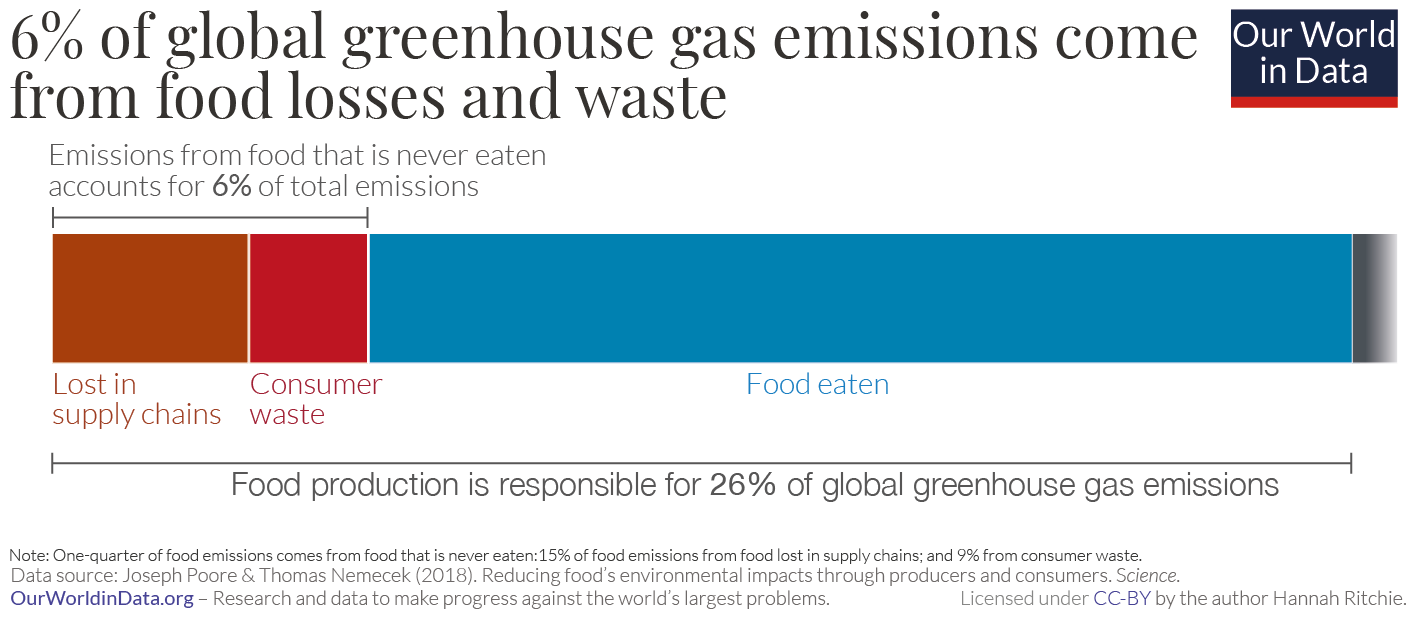
Food production accounts for around one-quarter – 26% – of global greenhouse gas emissions.13 This is a lot, but it’s slightly easier to digest when we remind ourselves that food is a basic human need.
What’s harder to make sense of is the amount of greenhouse gas emissions which are caused in the production of food that is never eaten.
Around one-quarter of the calories the world produces are thrown away; they’re spoiled or spilled in supply chains; or are wasted by retailers, restaurants and consumers.14 To produce this food we need land, water, energy, and fertilizer inputs. It all comes at an environmental cost.
Joseph Poore and Thomas Nemecek (2018), in their large meta-analysis of global food systems, published in Science, estimated how much of our greenhouse gas emissions come from wasted food.15
In the visualization here I show the emissions from wasted food in the context of global greenhouse gas emissions.
The study by Poore and Nemecek (2018) found that almost one-quarter – 24% – of food’s emissions come from food that is lost in supply chains or wasted by consumers. Almost two-thirds of this (15% of food emissions) comes from losses in the supply chain which result from poor storage and handling techniques; lack of refrigeration; and spoilage in transport and processing. The other 9% comes from food thrown away by retailers and consumers.
This means that food wastage is responsible for around 6% of total global greenhouse gas emissions.16 In fact, it’s likely to be slightly higher since the analysis from Poore and Nemecek (2018) does not include food losses on the farm during production and harvesting.
To put this in context: it’s around three times the global emissions from aviation.17 Or, if we were to put it in the context of national emissions, it would be the world’s third largest emitter.18 Only China (21%) and the United States (13%) emitted more.19