In this entry we present data and research on economic inequalities between men and women. Whenever the data allows it, we also discuss how these inequalities have been changing over time.
As we show, although economic gender inequalities remain common and large, they are today smaller than they used to be some decades ago.
Summary
- All over the world men tend to earn more than women.
- Women are often underrepresented in senior positions within firms.
- Women are often overrepresented in low-paying jobs.
- In many countries men are more likely to own land and control productive assets than women.
- Women often have limited influence over important household decisions, including how their own personal earned income is spent.
- In most countries the gender pay gap has decreased in the last couple of decades.
- Gender-equal inheritance systems, which were rare until recently, are now common across the world.
- Composite indices that cover multiple dimensions show that on the whole gender inequalities have been shrinking substantially over the last century.
All our charts on Economic inequality by gender
Related Our World in Data entries:
- Women’s Employment – rising female labor force participation has been one of the most remarkable economic developments of the last century. In this entry we present the key facts and drivers behind this important change.
The ‘gender pay gap’ comes up often in political debates, policy reports, and everyday news. But what is it? What does it tell us? Is it different from country to country? How does it change over time?
Here we try to answer these questions, providing an empirical overview of the gender pay gap across countries and over time.
The gender pay gap (or the gender wage gap) is a metric that tells us the difference in pay (or wages, or income) between women and men. It’s a measure of inequality and captures a concept that is broader than the concept of equal pay for equal work.
Differences in pay between men and women capture differences along many possible dimensions, including worker education, experience and occupation. When the gender pay gap is calculated by comparing all male workers to all female workers – irrespective of differences along these additional dimensions – the result is the ‘raw’ or ‘unadjusted’ pay gap. On the contrary, when the gap is calculated after accounting for underlying differences in education, experience, etc., then the result is the ‘adjusted’ pay gap.
Discrimination in hiring practices can exist in the absence of pay gaps – for example, if women know they will be treated unfairly and hence choose not to participate in the labor market. Similarly, it is possible to observe large pay gaps in the absences of discrimination in hiring practices – for example, if women get fair treatment but apply for lower-paid jobs.
The implication is that observing differences in pay between men and women is neither necessary nor sufficient to prove discrimination in the workplace. Both discrimination and inequality are important. But they are not one and the same. (You can read about discrimination and ‘equal pay for equal work’ in our post here).
Cross-country data on the gender pay gap is patchy, but the most complete source in terms of coverage is the United Nation’s International Labour Organization (ILO). The visualization here presents this data. You can add observations by clicking on the option ‘ Add country ’ at the bottom of the chart.
The estimates shown here correspond to differences between average hourly earnings of men and women (expressed as a percentage of average hourly earnings of men), and cover all workers irrespective of whether they work full time or part time.1
As we can see: (i) in most countries the gap is positive – women earn less than men; and (ii) there are large differences in the size of this gap across countries.
(NB. By this measure the gender wage gap can be positive or negative. If it is negative, it means that, on an hourly basis, men earn on average less than women. This happens in some countries, such as Malaysia.)

How is the gender pay gap changing over time? To answer this question, let’s consider this chart showing available estimates from the OECD. These estimates include OECD member states, as well as some other non-member countries, and they are the longest available series of cross-country data on the gender pay gap that we are aware of.
Here we see that the gap is large in most OECD countries, but it has been going down in the last couple of decades. In some cases the reduction is remarkable. In the UK, for example, the gap went down from almost 50% in 1970 to about 17% in 2016.
These estimates are not directly comparable to those from the ILO, because the pay gap is measured slightly differently here: The OECD estimates refer to percent differences in median earnings (i.e. the gap here captures differences between men and women in the middle of the earnings distribution); and they cover only full-time employees and self-employed workers (i.e. the gap here excludes disparities that arise from differences in hourly wages for part-time and full-time workers).
However, the ILO data shows similar trends for the period 2000-2015.
The conclusion is that in most countries with available data, the gender pay gap has decreased in the last couple of decades.

The United States Census Bureau defines the pay gap as the ratio between median wages – that is, they measure the gap by calculating the wages of men and women at the middle of the earnings distribution, and dividing them.
By this measure, the gender wage gap is expressed as a percent (median earnings of women as share of median earnings of men) and it is always positive. Here, values below 100% mean that women earn less than men, while values above 100% mean than women earn more. Values closer to 100% reflect a lower gap.
The next chart shows available estimates of this metric for full-time workers in the US, by age group.
First, we see that the series trends upwards, meaning the gap has been shrinking in the last couple of decades. Secondly, we see that there are important differences by age.
The second point is crucial to understand the gender pay gap: the gap is a statistic that changes during the life of a worker. In most rich countries, it’s small when formal education ends and employment begins, and it increases with age. As we discuss in our analysis of the determinants, the gender pay gap tends to increase when women marry and when/if they have children.

The scatter plot here shows available ILO estimates on the gender pay gap (vertical axis) vs GDP per capita (on a logarithmic scale along the horizontal axis). As we can see there is a weak positive correlation between GDP per capita and the gender pay gap. However, the chart shows that the relationship is not really linear. Actually, middle-income countries tend to have the smallest pay gap.
The fact that middle-income countries have low gender wage gaps is, to a large extent, the result of selection of women into employment. Olivetti and Petrongolo (2008) explain it as follows: “if women who are employed tend to have relatively high‐wage characteristics, low female employment rates may become consistent with low gender wage gaps simply because low‐wage women would not feature in the observed wage distribution.”2
Olivetti and Petrongolo (2008) show that this pattern holds in the data: unadjusted gender wage gaps across countries tend to be negatively correlated with gender employment gaps. That is, the gender pay gaps tend to be smaller where relatively fewer women participate in the labor force.
So, rather than reflect greater equality, the lower wage gaps observed in some countries could indicate that only women with certain characteristics – for instance, with no husband or children – are entering the workforce.

The chart here plots the proportion of women in senior and middle management positions around the world. It shows that women all over the world are underrepresented in high-profile jobs, which tend to be better paid.

The next chart provides an alternative perspective on the same issue. Here we show the share of firms that have a woman as manager. We highlight world regions by default, but you can add specific countries by using the option ‘ Add country ’.
As we can see, all over the world firms tend to be managed by men. And, globally, only about 19% of firms have a female manager.
Firms with female managers tend to be different to firms with male managers. For example, firms with female managers tend to also be firms with more female workers.

Despite having fallen in recent decades, there remains a substantial pay gap between the average wages of men and women.
But what does gender inequality look like if we focus on the very top of the income distribution? Do we find any evidence of the so-called ‘glass ceiling’ preventing women from reaching the top? How did this change over time?
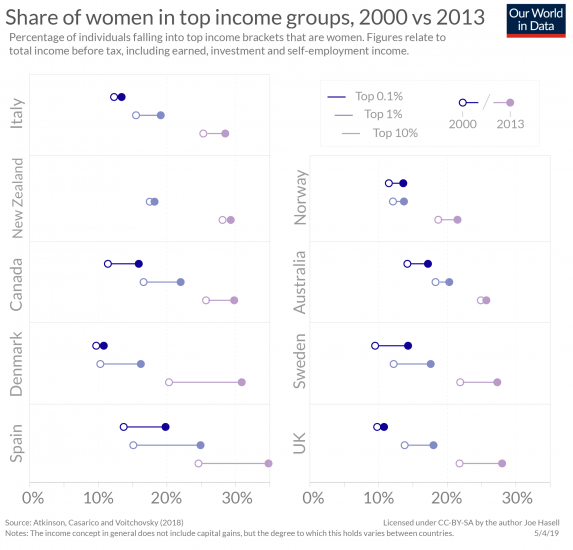
Answers to these questions are found in the work of Atkinson, Casarico and Voitchovsky (2018). Using tax records, they investigated the incomes of women and men separately across nine high-income countries. As such, they were restricted to those countries in which taxes are collected on individual basis, rather than as couples.3
In addition to wages they also take into account income from investments and self-employment.
Whilst investment income tends to make up a larger share of the total income of rich individuals in general, the authors found this to be particularly marked in the case of women in top income groups.
The two charts present the key figures from the study.
One chart shows the proportion of women out of all individuals falling into the top 10%, 1% and 0.1% of the income distribution. The open circle represents the share of women in the top income brackets back in 2000; the closed circle shows the latest data, which is from 2013.
The other chart shows the data over time for individual countries. You can explore data for other countries using the “Change country” button on the chart.
The two charts allow us to answer the initial questions:
- Women are greatly under-represented in top income groups – they make up much less than 50% across each of the nine countries. Within the top 1% women account for around 20% and there is surprisingly little variation across countries.
- The proportion of women is lower the higher you look up the income distribution. In the top 10% up to every third income-earner is a woman; in the top 0.1% only every fifth or tenth person is a woman.
- The trend is the same in all countries of this study: Women are now better-represented in all top income groups than they were in 2000.
- But improvements have generally been more limited at the very top. With the exception of Australia, we see a much smaller increase in the share of women amongst the top 0.1% than amongst the top 10%.
Overall, despite recent inroads, we continue to see remarkably few women making it to the top of the income distribution today.

Above we show that women all over the world are underrepresented in high-profile jobs, which tend to be better paid. As it turns out, in many countries women are at the same time overrepresented in low-paying jobs.
This is shown in the chart here, where ‘low-pay’ refers to workers earning less than two-thirds of the median (i.e. the middle) of the earnings distribution.
A share above 50% implies that women are ‘overrepresented’, in the sense that among those with low wages, there are more women than men.
The fact that women in rich countries are overrepresented in the bottom of the income distribution goes together with the fact that working women in these countries are overrepresented in low-paying occupations. The chart shows this for the US.


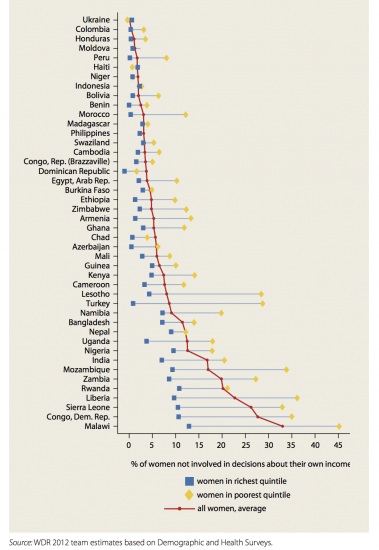
The chart plots cross-country estimates of the share of women who are not involved in decisions about their own income. The line shows national averages, while the dots show averages for rich and poor households (i.e. averages for women in households within the top and bottom quintiles of the corresponding national income distribution).
As we can see, in many countries, particularly in Sub-Saharan Africa and Asia, a large fraction of women are not involved in household decisions about spending their personal earned income. And this pattern is stronger among low-income households within low-income countries.
Percentage of women not involved in decisions about their own income – World Development Report (2012)5
Above we focus on whether women get to choose how their own personal income is spent. Now we look at women’s influence over total household income.
In the next chart we plot the share of currently married women who report having a say in major household purchase decisions, against national GDP per capita.
We see that in many countries, notably in Sub-Saharan Africa and Asia, an important number of women have limited influence over major spending decisions.
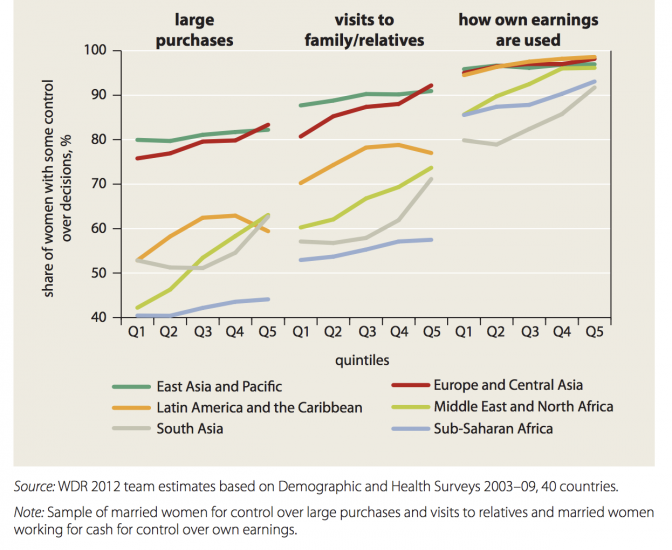
The chart above shows that women’s control over household spending tends to be greater in richer countries. In the chart we show that this correlation also holds within countries: Women’s control is greater in wealthier households. Household’s wealth is shown by the quintile in the wealth distribution on the x-axis – the poorest households are in the lowest quintiles (Q1) on the left.
There are many factors at play here, and it’s important to bear in mind that this correlation partly captures the fact that richer households enjoy greater discretionary income beyond levels required to cover basic expenditure, while at the same time, in richer households women often have greater agency via access to broader networks as well as higher personal assets and incomes.

Percentage of women with some control over decisions, by regions and household income quintiles – World Development Report (2012)6
Economic inequalities between men and women manifest themselves, not only in terms of wages earned, but also in terms of assets owned. For example, as the chart shows, in nearly all low and middle-income countries with data, men are more likely to own land than women.
Women’s lack of control over important household assets, such as land, can be a critical problem in case of divorce or the husband’s death.
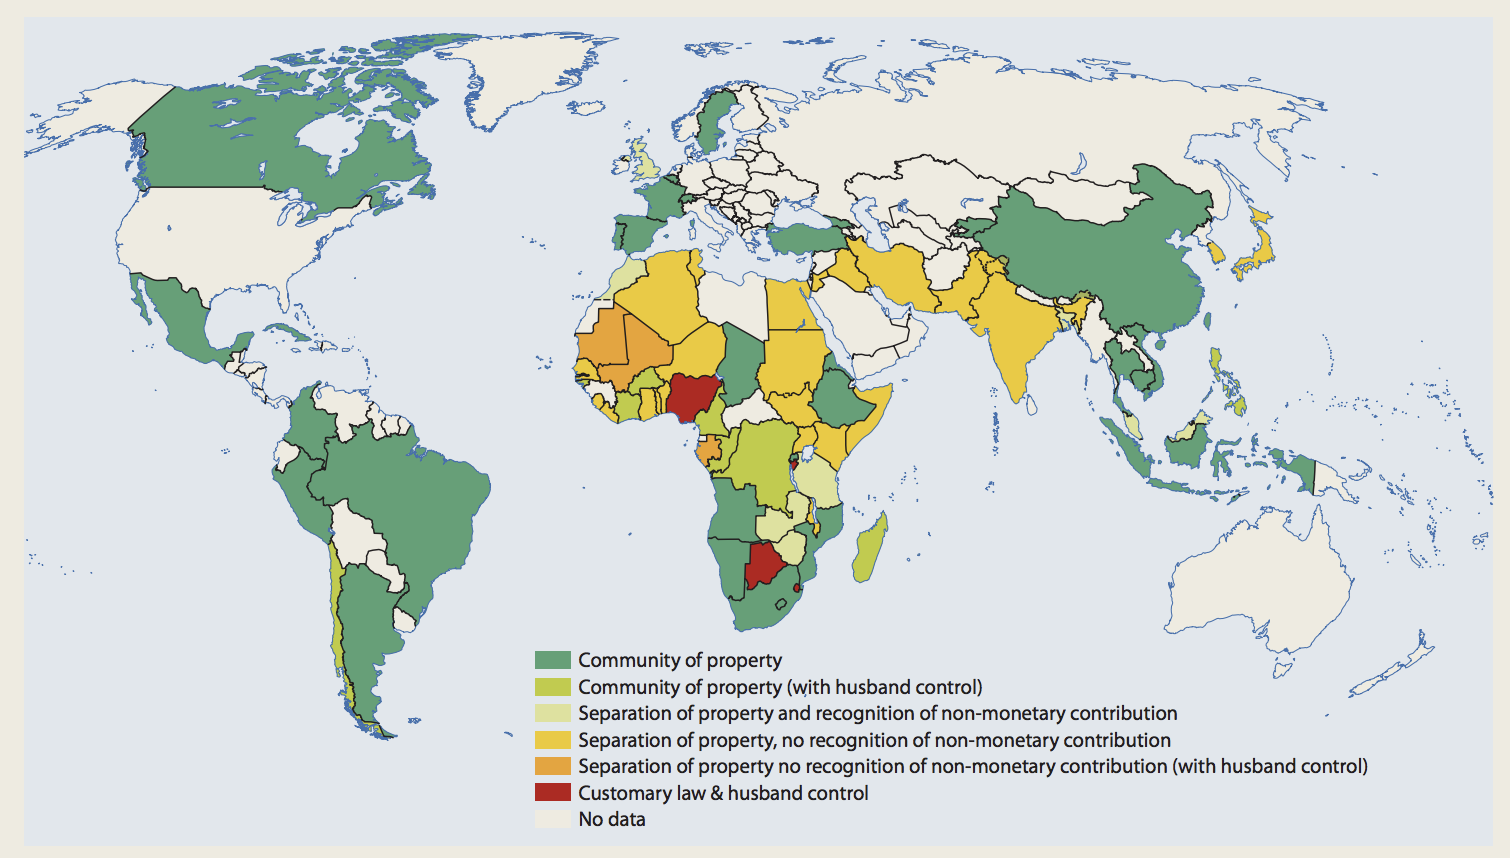
Closely related to the issue of land ownership is the fact that in several countries women do not have the same rights to property as men. These countries are highlighted in the map.
(This map from the World Development Report (2012) provides a more fine-grained overview of different property regimes operating in different countries.)


Inheritance is one of the main mechanisms for the accumulation of assets. In the map we provide an overview of the countries that do, and do not have gender-equal inheritance systems.
If you move the slider to 1920, you will see that while gender equal inheritance systems were very rare in the early 20th century, today they are much more common. And still, despite the progress achieved, in many countries, notably in North Africa and the Middle East, women and girls still have fewer inheritance rights than men and boys.

Above we show that there are large gender gaps in land ownership across low-income countries. Here we show that there are also large gaps in terms of access to borrowed capital.
The chart shows the percentage of men and women who report borrowing any money in the past 12 months to start, operate, or expand a farm or business.
As we can see, almost everywhere, including in many rich countries, women are less likely to get borrowed capital for productive purposes.
This can have large knock-on effects: In agriculture and entrepreneurship, gender differences in access to productive inputs, including land and credit, can lead to gaps in earnings via lower productivity.
Indeed, studies have found that, when statistical gender differences in agricultural productivity exist, they often disappear when access to and use of productive inputs are taken into account.7

The previous discussion focused on particularly aspects one by one. What is the the picture on economic inequality in the aggregate?
Tracking progress across multiple dimensions of gender inequalities can be difficult, since changes across dimensions often go in different directions and have different magnitudes. Because of this, researchers and policymakers often construct synthetic indicators that aggregate various dimensions.
The Women’s Economic Opportunity Index (WEO) published by The Economist Intelligence Unit, is one such effort to aggregate various aspects of female economic empowerment into a single metric.
The WEO index defines women’s economic opportunity as “a set of laws, regulations, practices, customs and attitudes that allow women to participate in the workforce under conditions roughly equal to those of men, whether as wage-earning employees or as owners of a business.” It is calculated from 29 indicators drawing on data from many sources, including the UN and the OECD.
Here is a map showing scores on this index (higher scores denote more economic opportunities for women).

The Human Development Report produced by the UN includes a composite index that captures gender inequalities across several dimensions, including economic status.
This index, called the Gender Inequality Index, measures inequalities in three dimensions: reproductive health (based on maternal mortality ratio and adolescent birth rates); empowerment (based on proportion of parliamentary seats occupied by females and proportion of adult females aged 25 years and older with at least some secondary education); and economic status (based on labour market participation rates of female and male populations aged 15 years and older).
The map shows scores, country by country.

The Gender Inequality Index from the Human Development Report only has data from 1995. Considering this, Sarah Carmichael, Selin Dilli and Auke Rijpma, from Utrecht University, produced a similar composite index of gender inequality, using available data for the period 1950-2000, in order to make aggregate comparisons over the long run.
This index covers four dimensions:
- (i) Health, measured by sex rations in life expectancy;
- (ii) Socio-economic resources, measured by sex ratios in average years of education and labour force participation;
- (iii) Gender disparities in the household, captured by sex ratios in marriage ages; and
- (iv) Gender disparities in politics, measured by sex rations in parliamentary seats.
The results from this study are shown in the chart.
As we can see, the second half of the 20th century saw global improvements, and the regions with the steepest increase in gender equality were Latin America and Western Europe.
Interestingly, this chart also shows that in Eastern Europe there was important progress in the period 1950-1980, but there was a reversal after the fall of the Soviet Union.

In almost all countries, if you compare the wages of men and women you find that women tend to earn less than men. These inequalities have been narrowing across the world. In particular, over the last couple of decades most high-income countries have seen sizeable reductions in the gender pay gap.
How did these reductions come about and why do substantial gaps remain?
Before we get into the details, here is a preview of the main points.
- An important part of the reduction in the gender pay gap in rich countries over the last decades is due to a historical narrowing, and often even reversal of the education gap between men and women.
- Today, education is relatively unimportant to explain the remaining gender pay gap in rich countries. In contrast, the characteristics of the jobs that women tend to do, remain important contributing factors.
- The gender pay gap is not a direct metric of discrimination. However, evidence from different contexts suggests discrimination is indeed important to understand the gender pay gap. Similarly, social norms affecting the gender distribution of labor are important determinants of wage inequality.
- On the other hand, the available evidence suggests differences in psychological attributes and non-cognitive skills are at best modest factors contributing to the gender pay gap.
Differences in human capital
Differences in earnings between men and women capture differences across many possible dimensions, including education, experience and occupation.
For example, if we consider that more educated people tend to have higher earnings, it is natural to expect that the narrowing of the pay gap across the world can be partly explained by the fact that women have been catching up with men in terms of educational attainment, in particular years of schooling.
Indeed, since differences in education partly contribute to explain differences in wages, it is common to distinguish between ‘unadjusted’ and ‘adjusted’ pay differences.
When the gender pay gap is calculated by comparing all male and female workers, irrespective of differences in worker characteristics, the result is the raw or unadjusted pay gap. In contrast to this, when the gap is calculated after accounting for underlying differences in education, experience, and other factors that matter for the pay gap, then the result is the adjusted pay gap.
The idea of the adjusted pay gap is to make comparisons within groups of workers with roughly similar jobs, tenure and education. This allows us to tease out the extent to which different factors contribute to observed inequalities.
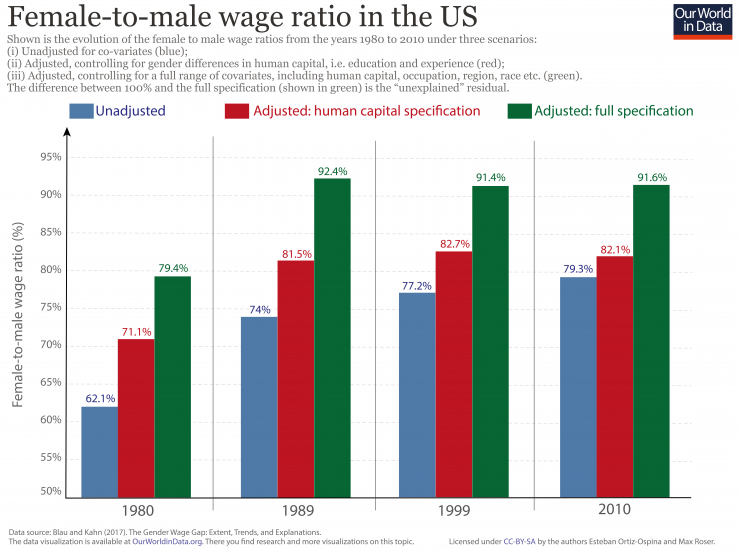
The chart here, from Blau and Kahn (2017) shows the evolution of the adjusted and unadjusted gender pay gap in the US.8
More precisely, the chart shows the evolution of female to male wage ratios in three different scenarios: (i) Unadjusted; (ii) Adjusted, controlling for gender differences in human capital, i.e. education and experience; and (iii) Adjusted, controlling for a full range of covariates, including education, experience, job industry and occupation, among others. The difference between 100% and the full specification (the green bars) is the “unexplained” residual.9
Several points stand out here.
- First, the unadjusted gender pay gap in the US shrunk over this period. This is evident from the fact that the blue bars are closer to 100% in 2010 than in 1980.
- Second, if we focus on groups of workers with roughly similar jobs, tenure and education, we also see a narrowing. The adjusted gender pay gap has shrunk.
- Third, we can see that education and experience used to help explain a very large part of the pay gap in 1980, but this changed substantially in the decades that followed. This third point follows from the fact that the difference between the blue and red bars was much larger in 1980 than in 2010.
- And fourth, the green bars grew substantially in the 1980s, but stayed fairly constant thereafter. In other words: Most of the convergence in earnings occurred during the 1980s, a decade in which the “unexplained” gap shrunk substantially.
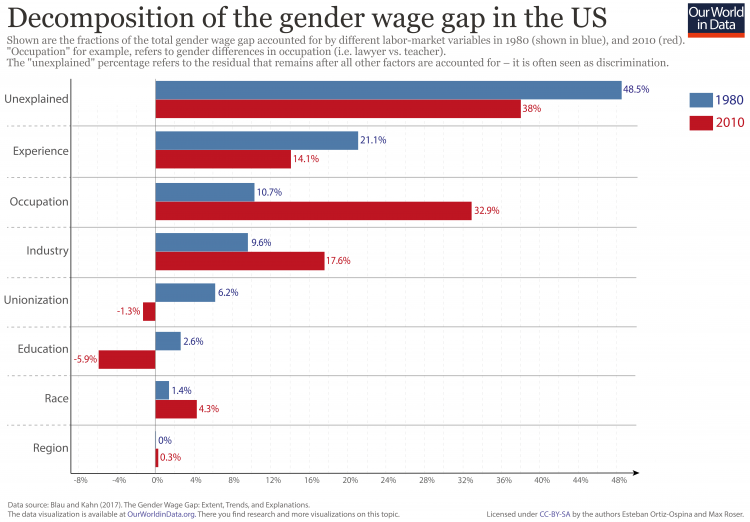
The chart here shows a breakdown of the adjusted gender pay gaps in the US, factor by factor, in 1980 and 2010.
When comparing the contributing factors in 1980 and 2010, we see that education and work experience have become much less important in explaining gender differences in wages over time, while occupation and industry have become more important.10
In this chart we can also see that the ‘unexplained’ residual has gone down. This means the observable characteristics of workers and their jobs explain wage differences better today than a couple of decades ago. At first sight, this seems like good news – it suggests that today there is less discrimination, in the sense that differences in earnings are today much more readily explained by differences in ‘productivity’ factors. But is this really the case?
The unexplained residual may include aspects of unmeasured productivity (i.e. unobservable worker characteristics that cannot be controlled for in a regression), while the “explained” factors may themselves be vehicles of discrimination.
For example, suppose that women are indeed discriminated against, and they find it hard to get hired for certain jobs simply because of their sex. This would mean that in the adjusted specification, we would see that occupation and industry are important contributing factors – but that is precisely because discrimination is embedded in occupational differences!
Hence, while the unexplained residual gives us a first-order approximation of what is going on, we need much more detailed data and analysis in order to say something definitive about the role of discrimination in observed pay differences.
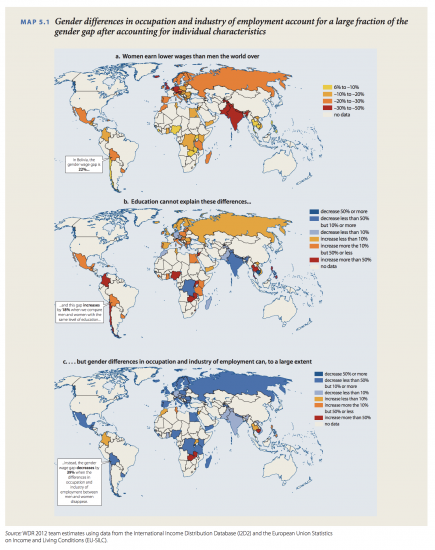
The set of three maps here, taken from the World Development Report (2012), shows that today gender pay differences are much better explained by occupation than by education. This is consistent with the point already made above using data for the US: as education expanded radically over the last few decades, human capital has become much less important in explaining gender differences in wages.
This blog post from Justin Sandefur at the Center for Global Development shows that education also fails to explain wage gaps if we include workers with zero income (i.e. if we decompose the wage gap after including people who are not employed).
Gender pay gap after adjusting for education and occupation – WDR (2012)11
Looking beyond worker characteristics
All over the world women tend to do more unpaid care work at home than men – and women tend to be overrepresented in low paying jobs where they have the flexibility required to attend to these additional responsibilities.
The most important evidence regarding this link between the gender pay gap and job flexibility is presented and discussed by Claudia Goldin in the article ‘A Grand Gender Convergence: Its Last Chapter‘, where she digs deep in the data from the US.12 There are some key lessons that apply both to rich and non-rich countries.
Goldin shows that when one looks at the data on occupational choice in some detail, it becomes clear that women disproportionately seek jobs, including full-time jobs, that tend to be compatible with childrearing and other family responsibilities. In other words, women, more than men, are expected to have temporal flexibility in their jobs. Things like shifting hours of work and rearranging shifts to accommodate emergencies at home. And these are jobs with lower earnings per hour, even when the total number of hours worked is the same.
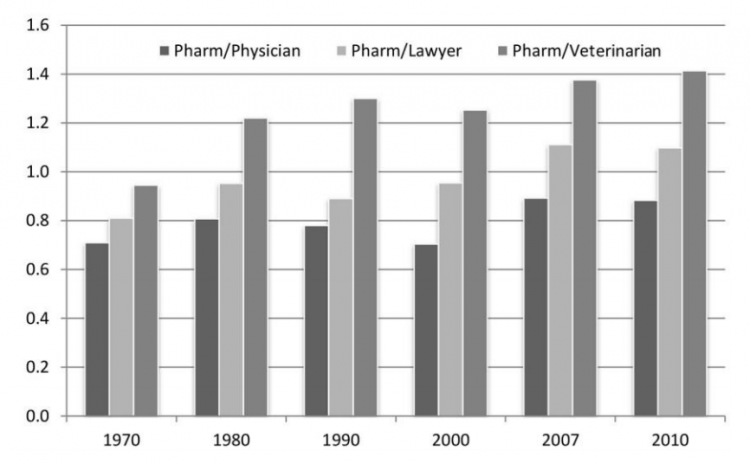
The importance of job flexibility in this context is very clearly illustrated by the fact that, over the last couple of decades, women in the US increased their participation and remuneration in only some fields. In a recent paper, Goldin and Katz (2016) show that pharmacy became a highly remunerated female-majority profession with a small gender earnings gap in the US, at the same time as pharmacies went through substantial technological changes that made flexible jobs in the field more productive (e.g. computer systems that increased the substitutability among pharmacists).13
The chart here shows how quickly female wages increased in pharmacy, relative to other professions, over the last few decades in the US.
Female median earnings of full-time, year-round pharmacists relative to other professions, 1970-2010, US – Goldin and Katz (2016)14
Closely related to job flexibility and occupational choice, is the issue of work interruptions due to motherhood. On this front there is again a great deal of evidence in support of the so-called ‘motherhood penalty’.
Lundborg, Plug and Rasmussen (2017) provide evidence from Denmark – more specifically, Danish women who sought medical help in achieving pregnancy.15
By tracking women’s fertility and employment status through detailed periodic surveys, these researchers were able to establish that women who had a successful in vitro fertilization treatment, ended up having lower earnings down the line than similar women who, by chance, were unsuccessfully treated.
Lundborg, Plug and Rasmussen summarise their findings as follows: “Our main finding is that women who are successfully treated by [in vitro fertilization] earn persistently less because of having children. We explain the decline in annual earnings by women working less when children are young and getting paid less when children are older. We explain the decline in hourly earnings, which is often referred to as the motherhood penalty, by women moving to lower-paid jobs that are closer to home.”
The fact that the motherhood penalty is indeed about ‘motherhood’ and not ‘parenthood’, is supported by further evidence.
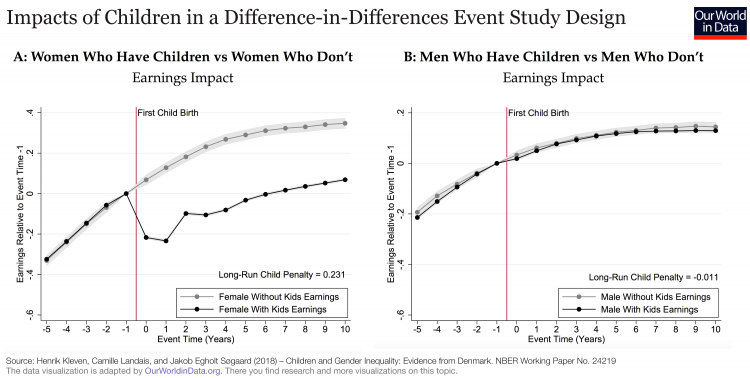
A recent study, also from Denmark, tracked men and women over the period 1980-2013, and found that after the first child, women’s earnings sharply dropped and never fully recovered. But this was not the case for men with children, nor the case for women without children.
These patterns are shown in the chart here. The first panel shows the trend in earnings for Danish women with and without children. The second panel shows the same comparison for Danish men.
Note that these two examples are from Denmark – a country that ranks high on gender equality measures and where there are legal guarantees requiring that a woman can return to the same job after taking time to give birth.
This shows that, although family-friendly policies contribute to improve female labor force participation and reduce the gender pay gap, they are only part of the solution. Even when there is generous paid leave and subsidized childcare, as long as mothers disproportionately take additional work at home after having children, inequities in pay are likely to remain.
The discussion so far has emphasised the importance of job characteristics and occupational choice in explaining the gender pay gap. This leads to obvious questions: What determines the systematic gender differences in occupational choice? What makes women seek job flexibility and take a disproportionate amount of unpaid care work?
One argument usually put forward is that, to the extent that biological differences in preferences and abilities underpin gender roles, they are the main factors explaining the gender pay gap. In their review of the evidence, Francine Blau and Lawrence Kahn (2017) show that there is limited empirical support for this argument.16
To be clear, yes, there is evidence supporting the fact that men and women differ in some key attributes that may affect labor market outcomes. For example standardised tests show that there are statistical gender gaps in maths scores in some countries; and experiments show that women avoid more salary negotiations, and they often show particular predisposition to accept and receive requests for tasks with low promotion potential. However, these observed differences are far from being biologically fixed – ‘gendering’ begins early in life and the evidence shows that preferences and skills are highly malleable. You can influence tastes, and you can certainly teach people to tolerate risk, to do maths, or to negotiate salaries.
What’s more, independently of where they come from, Blau and Kahn show that these empirically observed differences can typically only account for a modest portion of the gender pay gap.
In contrast, the evidence does suggest that social norms and culture, which in turn affect preferences, behaviour and incentives to foster specific skills, are key factors in understanding gender differences in labor force participation and wages. You can read more about this in our blog post dedicated to answer the question ‘How well do innate gender differences explain the gender pay gap?’.
Independently of the exact origin of the unequal distribution of gender roles, it is clear that our recent and even current practices show that these roles persist with the help of institutional enforcement. Goldin (1988), for instance, examines past prohibitions against the training and employment of married women in the US. She touches on some well-known restrictions, such as those against the training and employment of women as doctors and lawyers, before focusing on the lesser known but even more impactful ‘marriage bars’ which arose in the late 1800s and early 1900s. These work prohibitions are important because they applied to teaching and clerical jobs – occupations that would become the most commonly held among married women after 1950. Around the time the US entered World War II, it is estimated that 87% of all school boards would not hire a married woman and 70% would not retain an unmarried woman who married.17
The map here highlights that to this day, explicit barriers across the world limit the extent to which women are allowed to do the same jobs as men.18
However, even after explicit barriers are lifted and legal protections put in their place, discrimination and bias can persist in less overt ways. Goldin and Rouse (2000), for example, look at the adoption of “blind” auditions by orchestras, and show that by using a screen to conceal the identity of a candidate, impartial hiring practices increased the number of women in orchestras by 25% between 1970 and 1996.19
Many other studies have found similar evidence of bias in different labor market contexts. Biases also operate in other spheres of life with strong knock-on effects on labor market outcomes. For example, at the end of World War II only 18% of people in the US thought that a wife should work if her husband was able to support her. This obviously circles back to our earlier point about social norms.20

Strategies for reducing the gender pay gap
In many countries wage inequality between men and women can be reduced by improving the education of women. However, in many countries gender gaps in education have been closed and we still have large gender inequalities in the workforce. What else can be done?
An obvious alternative is fighting discrimination. But the evidence presented above shows that this is not enough. Public policy and management changes on the firm level matter too: Family-friendly labor-market policies may help. For example, maternity leave coverage can contribute by raising women’s retention over the period of childbirth, which in turn raises women’s wages through the maintenance of work experience and job tenure.21
Similarly, early education and childcare can increase the labor force participation of women — and reduce gender pay gaps — by alleviating the unpaid care work undertaken by mothers.22
Additionally, the experience of women’s historical advance in specific professions (e.g. pharmacists in the US), suggests that the gender pay gap could also be considerably reduced if firms did not have the incentive to disproportionately reward workers who work long hours, and fixed, non-flexible schedules.23
Changing these incentives is of course difficult because it requires reorganizing the workplace. But it is likely to have a large impact on gender inequality, particularly in countries where other measures are already in place.24
Implementing these strategies can have a positive self-reinforcing effect. For example, family-friendly labor-market policies that lead to higher labor-force attachment and salaries for women, will raise the returns to women’s investment in education – so women in future generations will be more likely to invest in education, which will also help narrow gender gaps in labor market outcomes down the line.25
Nevertheless, powerful as these strategies may be, they are only part of the solution. Social norms and culture remain at the heart of family choices and the gender distribution of labor. Achieving equality in opportunities requires ensuring that we change the norms and stereotypes that limit the set of choices available both to men and women. It is difficult, but the evidence shows that social norms, too, can be changed.
Gender pay gap
The gender pay gap (or the gender wage gap) is a metric that tells us the difference in pay (or wages, or income) between women and men. It’s a measure of inequality and captures a concept that is broader than the concept of equal pay for equal work.
Differences in pay between men and women capture differences along many possible dimensions, including worker education, experience and occupation. When the gender pay gap is calculated by comparing all male workers to all female workers – irrespective of differences along these additional dimensions – the result is the ‘raw’ or unadjusted pay gap. On the contrary, when the gap is calculated after accounting for underlying differences in education, experience, etc., then the result is the adjusted pay gap.
Discrimination in hiring practices can exist in the absence of pay gaps – for example, if women know they will be treated unfairly and hence choose not to participate in the labor market. Similarly, it is possible to observe large pay gaps in the absences of discrimination in hiring practices – for example, if women get fair treatment but apply for lower-paid jobs.
The implication is that observing differences in pay between men and women is neither necessary nor sufficient to prove discrimination in the workplace. Both discrimination and inequality are important. But they are not one and the same.
How is the unadjusted gender pay gap measured?
The gender wage gap is often measured as the difference between average earnings of men and average earnings of women expressed as a percentage of average earnings of men. By this measure the gender wage gap can be negative. This is the definition used by the ILO. (We explore the ILO data above.)
Comparisons of averages can often be misleading because averages are very sensitive to extreme data points. Hence, it is also common to measure gender gaps by comparing earnings for the individuals at the median — or middle — of the earnings distribution. This is the definition used by the OECD. (We explore the OECD data above.)
In addition to percent differences, it is also common to express the gender pay gap as a simple ratio between wages. This is the measure adopted by the United States Census Bureau.
By this measure, the gender wage gap is expressed as a percent (median earnings of women as share of median earnings of men) and it is always positive. Here, values below 100% mean that women earn less than men, while values above 100% mean than women earn more. Values closer to 100% reflect a lower gap.
- Data Source: Multiple sources
- Description of available measures: Several gender indicators are included in this database. Here are some that we cover in this entry: Laws mandating equal remuneration for females; Firms with female top managers; Participation of women in purchase decisions; Percentage of men and women (age 15-49) who solely own a land which is legally registered with their name or cannot be sold without their signature; Ownership rights by gender; Percentage of men and women (ages 15+) who report borrowing any money in the past 12 months (by themselves or together with someone else) to start, operate, or expand a farm or business
- Geographical coverage: Global, by country
- Link: https://datacatalog.worldbank.org/dataset/gender-statistics
- Data Source: Multiple sources
- Description of available measures: Minimum Set of Gender Indicators, as agreed by the United Nations Statistical Commission in its 44th Session in 2013.
- Geographical coverage: Global, by country
- Link: https://genderstats.un.org
- Data Source: Multiple sources
- Description of available measures: This data hub covers cross-country measures of discrimination against women in social institutions (formal and informal laws, social norms, and practices) across 160 countries.
- Geographical coverage: 160 countries
- Link: www.genderindex.org
- Data Source: Multiple sources
- Description of available measures: The OECD Gender Data Portal includes selected indicators shedding light on gender inequalities in education, employment, entrepreneurship, health and development, showing how far we are from achieving gender equality and where actions is most needed. The data cover OECD member countries, as well as partner economies including Brazil, China, India, Indonesia, and South Africa.
- Link: http://www.oecd.org/gender/data/
- Data Source: Multiple sources
- Description of available measures: This data hub links several external resources, including the OECD’s Gender, Institutions and Development Database, as well as the OECD’s Gender data portal
- Geographical coverage: Global by country
- Link: www.wikigender.org/statistics/
- Data Source: Multiple sources
- Description of available measures: The World Economic Forum’s data explorer compiles country rankings and profiles according to their Global Gender Gap Index scores. The index is made up of four sub-components including economic participation, education, health, and political empowerment as well as providing a selection of contextual variables – broken down by gender and their combined total – relating to each of the four sub-categories. The explorer enables users to directly compare two countries across all the indicators available.
- Geographical coverage: Global by country
- Link: http://reports.weforum.org/global-gender-gap-report-2020/dataexplorer/
- Data Source: ILO
- Description of available measures: Unadjusted gender gap in average hourly wages, Female share of low pay earners
- Time span: 1990-2016
- Geographical coverage: Global by country
- Link: http://www.ilo.org/ilostat/
- Data Source: Multiple sources
- Description of available measures: Several gender indicators are included in this database. Here are some that we cover in this entry: Laws mandating equal remuneration for females, Firms with female top managers, Participation of women in purchase decisions.
- Geographical coverage: Global, by country
- Link: http://data.worldbank.org/data-catalog/world-development-indicators
- Data Source: Multiple sources
- Description of available measures: Gender Development Index, Gender Inequality Index,
- Geographical coverage: Global, by country
- Link: http://hdr.undp.org/en/data#