Summary
- Over the past decade, terrorists killed an average of 21,000 people worldwide each year.
- The global death toll from terrorism over the past decade ranged from 8,000 in 2010 to a high of 44,000 in 2014.
- In 2017, terrorism was responsible for 0.05% of global deaths.
- Terrorism tends to be very geographically-focused: 95% of deaths in 2017 occurred in the Middle East, Africa or South Asia.
- In most countries terrorism accounts for less than 0.01% of deaths, but in countries of high-conflict, this can be as much as several percent.
- Airline hijackings were once common but are very rare today.
- Public concern about terrorism is high – in many countries more than half say they are concerned about being a victim.
- Media coverage of terrorism is often disproportionate to its frequency and share of deaths.
All our charts on Terrorism
In our overview of terrorism, we try to understand how the number of terrorist acts varies around the world and how it has changed over time. To do this, we need a clear and consistent definition of what terrorism is, and how it’s different from any other form of violence. This is not straightforward.
Terrorism is defined in the Oxford Dictionary as “the unlawful use of violence and intimidation, especially against civilians, in the pursuit of political aims.” We quickly see that this definition is unspecific and subjective.1 The issue of subjectivity in this case means that there is no internationally recognised legal definition of terrorism. Despite considerable discussion, the formation of a comprehensive convention against international terrorism by the United Nations has always been impeded by the lack of consensus on a definition.2
The key problem is that terrorism is difficult to distinguish from other forms of political violence and violent crime, such as state-based armed conflict, non-state conflict, one-sided violence, hate crime, and homicide. The lines between these different forms of violence are often blurry. Here, we take a look at standard criteria of what constitutes terrorism, as well as how it might be distinguished from other forms of violence.
Violent actions are usually categorised according to the perpetrator, the victim, the method, and the purpose.3 Different definitions emphasise different characteristics, depending on the priorities of the agency involved.
In our coverage of terrorism, we rely strongly on data from the Global Terrorism Database (GTD), which defines terrorism as “acts of violence by non-state actors, perpetrated against civilian populations, intended to cause fear, in order to achieve a political objective.”4,5 Its definition excludes violence initiated by governments (state terrorism) and open combat between opposing armed forces, even if they’re non-state actors. In our definitions section we provide the GTD’s more detailed definition, in addition to others such as that of the United Nations.
A few key distinguishing factors are common to most definitions of terrorism, with minor variations. The following criteria are adapted from the definition given by Bruce Hoffman in Inside Terrorism.6
To be considered an act of terrorism, an action must be violent, or threaten violence. As such, political dissent, activism, and nonviolent resistance do not constitute terrorism. There are, however, many instances around the world of authorities restricting individuals’ freedom of expression under the pretext of counter-terrorism measures. Human rights groups, such as Amnesty International and Human Rights Watch, publish reports on such cases of censorship.
The inclusion of damage to private and public property in the definition of terrorism is a point of contention, but it is generally accepted in legal and statistical contexts.
An action must also be carried out for political, economic, religious, or social purposes to count as terrorism. For example, the terrorist organisation Islamic State of Iraq and the Levant (ISIL) has clearly stated its political goal to establish itself as a caliphate. Likewise, attacks perpetrated by white extremists have discernable sociopolitical motivations, and so are considered acts of terrorism. By contrast, violent acts committed without a political, economic, religious or social goal are not classified as terrorism, but instead as ‘violent crimes’
To be classified as terrorism, actions must be designed to have far-reaching psychological repercussions beyond the immediate victim or target. In other words, an action must aim to create terror through “its shocking brutality, lack of discrimination, dramatic or symbolic quality and disregard of the rules of warfare”.7
Additionally, targetting noncombatant, neutral, or randomly chosen people – generally, people not engaged in hostilities – is a necessary but not sufficient condition to constitute terrorism. The US State Department includes in the definition of ‘noncombatant’, “military personnel who at the time of the incident are unarmed and/or not on duty.” They “also consider as acts of terrorism attacks on military installations or on armed military personnel when a state of military hostilities does not exist at the site.”8 As such, actions during open combat, where a state of military hostility exists, do not constitute terrorism.
Terrorist actions must be also conducted either by an organization with an identifiable chain of command or conspiratorial cell structure (whose members wear no uniform or identifying insignia), or by individuals or a small collection of individuals directly influenced by the logical aims or example of some existent terrorist movement and its leaders (typically referred to as a ‘lone wolf’ attack).
Finally, the action must be perpetrated by a subnational group or non-state entity. Equivalent actions perpetrated by the armed forces of nation states are given different classifications, such as ‘war crime’ or one-sided violence.
Based on the criteria above, we can begin to separate terrorism from other types of violence based on some very simplified distinctions:
- killings perpetrated by non-state actors against civilians, which are not ideological in nature i.e. not motivated by a particular political, economic or social goal, are classified as homicide;
- violence perpetrated by non-state actors against civilians, specifically based on ethnicity, sexuality, gender, or disability, without political or social intent to cause widespread fear, is classified as a hate crime;
- violence involving open combat between opposing armed forces is classified as state-based armed conflict, if at least one of the parties is the government of a state;
- if, in the scenario above, none of the parties is the government of a state, this is classified as a non-state conflict;
- violence perpetrated by governments against civilians is classified as one-sided violence.9
But even with these distinctions in mind, there is not always a clear-cut boundary between terrorism and other forms of conflict like civil war and violence targeting civilians.
The GTD codebook notes this: “there is often definitional overlap between terrorism and other forms of crime and political violence, such as insurgency, hate crime, and organized crime”. Given the difficulty of excluding such cases in a systematic way, this database includes them wherever they meet the basic criteria that form the definition of terrorism. However, it also flags up instances where the coders had doubts whether the event would be better characterised by one of these ‘alternative designations’. You can explore this by downloading the full GTD dataset at their website. As such, there is a partial overlap between common definitions of terrorism and certain other types of conflict.
Another way in which conflict researchers distinguish between different types of violent acts is in terms of the number of victims. The Uppsalla Conflict Data Program (UCDP), for instance, only includes events involving at least 25 deaths – a requirement not present in GTD. Therefore many, but not all, of the events recorded in GTD will also be counted in the UCDP data, which are the basis of our charts of non-state and one-sided violence.
As an example, the September 11 attacks on the World Trade Centre in New York City are included as both a terrorist attack in the GTD, and an episode of one-sided violence in the UCDP data, because the perpetrators were members of the organised group Al-Qaida, and it resulted in more than 25 deaths. However, the Norway attacks on 22 July 2011, in which a right-wing extremist killed or injured more than 100 people, is included in GTD as a terror attack, but is not present in UCDP data, since the attacker was acting independently, and did not represent the government of a state.
We are therefore aware that there can be overlap between the data we present on terrorism and that which we present on conflict. This fact is a crucial point in understanding the definition of terrorism and what the term means to people. Many of the terrorist attacks that take place today are events which many people would think of as a different form of violence or conflict. In fact, most terrorism actually happens in countries of high internal conflict, because ultimately terrorism is another form of conflict.
How many people are killed by terrorists worldwide?
In 2017, an estimated 26,445 people died from terrorism globally.
Over the previous decade the average number of annual deaths was 21,000. However, there can be significant year-to-year variability. Over this decade the global death toll ranged from its lowest of 7,827 in 2010 to the highest year of 44,490 in 2014.

What share of deaths are from terrorism?
Terrorism often dominates media coverage. We are informed about attacks as soon as they happen and many attacks claim the headlines. Whilst our attention is drawn to these events – just as the terrorists intend – such intense coverage can make it difficult to contextualize the true extent of terrorism. This is because the availability heuristic: our perceptions are heavily influenced by the most recent examples of it. We’re biased to recent events in the news because we can recall them quickly.
How many people die from terrorism relative to other causes?
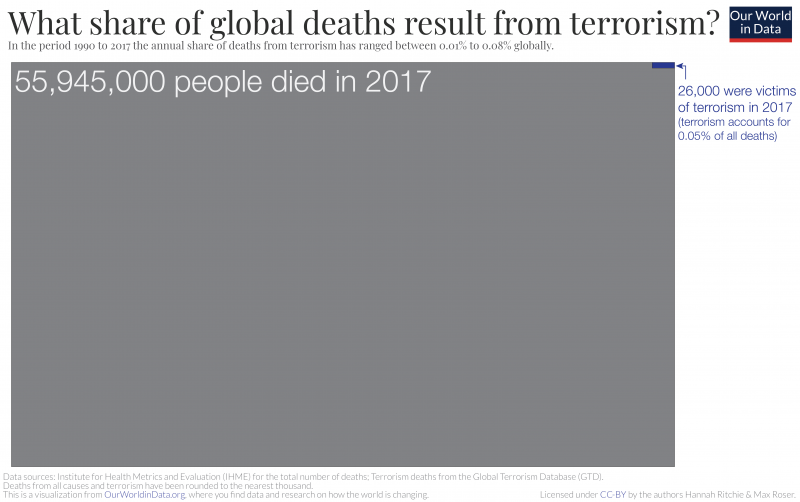
In this chart we see global terrorism deaths in the context of deaths from all causes. The size of the big rectangle corresponds to the number of deaths in 2017. The share of deaths from terrorism are shown in red. A very small fraction.
Close to 56 million people died in 2017; just over 26,000 of them from terrorism.10 Every 2000th death – 0.05% – were from terrorism.11
But terrorist activity can vary a lot from year-to-year. Maybe 2017 was a particularly low or high year. When we look at the trend – also shown in chart form – over the past few decades we see it hovered from 0.01% to 0.02% over the 1990s and early 2000s; increased to 0.08% in 2014; before falling to 0.05% in 2017. It was therefore a relatively high year for terrorist deaths, but not the peak.

Global distribution of terrorism
Globally, over 26,000 people died in terrorist attacks in 2017. Where in the world did terrorists kill most people?
In this chart we see the number of deaths from terrorism by region in 2017. Of the 26,445 global deaths from terrorism included in the Global Terrorism Database, 95% occurred in the Middle East, Africa or South Asia. Less than 2% of deaths were in Europe, the Americas and Oceania combined.
This is also true when we look at the number of incidents, rather than the number of deaths. As we will see in the following section, not only is there a strong regional focus but this is also heavily concentrated in only a few countries within these regions.
Most victims of terrorism die in the Middle East, Africa and South Asia. This hasn’t always been the case. Guerrilla movements in Central and South America, for example, dominated terrorism in the 1980s.

Terrorism is often regionally-focused. But within these regions it’s also concentrated within specific countries. The Middle East and North Africa had by far the largest number of deaths in 2017; but not all countries were affected.
We see the number of terrorism deaths by country in this map.12 Iraq – the country with the most fatalities in 2017 – accounted for 60% of deaths in the Middle East & North Africa. This was one-in-four terrorism deaths globally. Combined, Iraq and Syria accounted for nearly 80% in the region, and one-in-three globally.
The same is true for South Asia and Sub-Saharan Africa which also had high death tolls in 2017. In South Asia, most deaths occurred in Afghanistan, with high numbers in Pakistan and India too. But some countries in the region – such as Nepal – had almost none.
Looking at the where in the world terrorism happens highlights an important point: it tends to be in countries with high levels of internal conflict. Here we discuss in detail the challenges of separating terrorism from other forms of conflict such as civil war or homicide. This proves difficult because often there is a strong overlap.
If we look at a recent list of terrorist incidents across the world – take June 2019 as an example – we see the majority are events that most people would understand to be terrorism: roadside bombings; car detonations; attacks on religious or political institutions. Although usually performed by one or a small group of individuals, most are affiliated with well-known terrorist groups, such as Islamic State, Taliban, Boko Haram, and Al-Shabaab. Again, most people would clearly associate these with terrorism violence.
But where the lines become blurred is that many of these groups are rebel or insurgency groups in various domestic conflicts. Islamic State, for example, is a key instigator in the Syrian civil war; Al-Shabaab in internal Somalian conflict.
This means that most terrorism occurs in countries of high conflict because the internal conflict is – to a certain extent – terrorism.

The map below which shows terrorism as a share of total deaths for each country. In most countries – particularly across Europe, the Americas and Oceania – deaths from terrorism accounted for less than 0.01%. They are rare in most countries of the world today.
This is not true everywhere. In a number of countries across the Middle East and Africa, terrorist deaths reach up to several percent. Iraq was the most affected 4.3% of all deaths were due to terrorism in 2017, followed by Afghanistan, Syria and Somalia which each had over 1%. These are countries where overall conflict – of which terrorist activity is a part – is high. In fact, as we discuss here, the boundary between terrorism, conflict, one-sided violence or civil war is not always clear-cut.
This map shows an overview for 2017. The extent of terrorism in most countries is very low. But – as we mentioned in the global-level data – this can change from year to year [you can see this on the map above using the timeline on the bottom of the chart]. Attacks can be non-existent for many years before an unexpected rise or spike. What effect does this have?
The United States provides an important example. Terrorism deaths in most years are very few: typically below 0.01% of all deaths. This unexpectedly spiked with the 9/11 attacks – the world’s most fatal terrorist event of recent times. It claimed 3000 lives, accounting for 0.12% of all deaths in the US in 2001. Every 800th death in the US in 2001 was from 9/11. We should therefore be aware of this volatility: having few deaths from terrorism in one year is not a predictor for the next.
Overall we see that terrorism deaths globally – and in most parts of the world – are relatively rare. Much more common risks – often ones that we can influence – kill many more people. An estimated 7 million deaths each year result from smoking; 4.7 million from obesity; and 3 million from outdoor air pollution. The dominance of terrorism in the daily news cycle can mean that we lose perspective of this.

Has terrorism increased in Western Europe?
When things become increasingly visible in the media, it’s easy to assume that they’re becoming more common – psychologists refer to this phenomenon as the availability heuristic.13 It can be difficult to separate a rise in attention from a rise in frequency. Increasing attention on terrorism can therefore make it seem like it’s always getting worse. But is this really true?
Has terrorism in Western Europe been increasing?
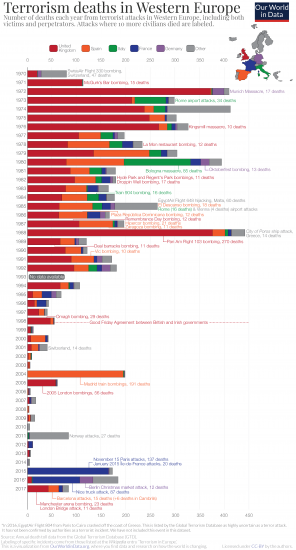
In this visualization we shown terrorism deaths in Western Europe since 1970. Here we use data from the most comprehensive database to date: the Global Terrorism Database (GTD). Another useful resource which cross-references well with this database for Western Europe is the Wikipedia entry: you can find further context of particular events there.
The 1970s and 1980s were dominated by ‘The Troubles’ in Northern Ireland. Here we see annual deaths from terrorism in the order of hundreds, and reaching over 400 deaths in some years. The United Kingdom was home to the largest share of deaths for much of the 70s, 80s, and 90s.
We see quite a marked decline post-1998 with the Good Friday Agreement between British and Irish governments. Since the Millennium the annual death toll has been below 50 deaths in most years, and often below 10. For context, compare that to how many people die on the roads: in 2017 around 70 people died every day in road incidents.14 Road accidents kill more people in Western Europe every day than terrorism in an average year.
The year to year changes are nonetheless volatile. Large terrorist attacks – such as the Madrid train bombings in 2004; 2005 London bombings; 2011 Norway attacks; 2015 Paris attacks; the truck attacks in Nice and the Berlin Christmas market attack in 2015; and the Manchester and Barcelona attacks in 2017 – have occurred since the turn of the century.
This trend is also reflected when we look at the number of terrorist attacks.
With exception of the 1970s, terrorism data in Western Europe can be hard to see when bundled with other regions. This in itself is an important point: terrorist deaths in Western Europe are very low within the global context.
During the 1970s Western Europe was home to the most terrorist deaths globally: in many years 70% to 80% of recorded deaths from terrorism. This has changed dramatically since then. In 2017, only 0.3% of terrorism deaths occurred in the region.15
Between 2000 and 2017 – over almost two decades – there were just under 1000 deaths in Western Europe from terrorism. This is equal to the death toll of only two to three years during the 1970s.
Has terrorism increased in the United States?
The Global Terrorism Database (GTD) – the most comprehensive database of terrorist incidents to date – was founded and is currently maintained from programmes in the United States. This, combined with the fact that terrorist incidents would have been covered extensively in the US media dating back to the 1970s makes it likely that it has the most complete record of terrorist attacks in recent decades.
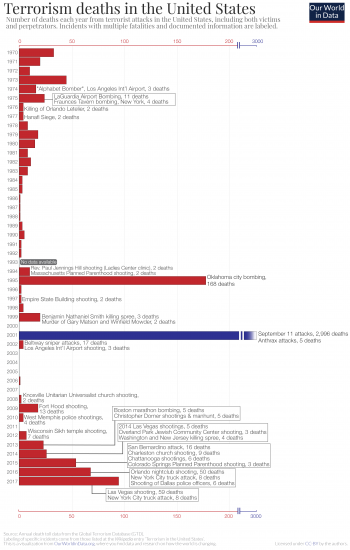
In this visualization we show the annual death toll from terrorism in the US since 1970. The September 11 attacks in New York stand out as the most fatal terrorist event in the world in recent history. In fact, claiming the lives of nearly 3000 people, the death toll in 2001 was almost four times higher than the combined deaths from terrorism in the US since 1970.
Based on fatalities we see terrorism was relatively high in the 1970s, then comparably ‘quiet’ – with exception of major outlying years, 1995 and 2001 – in the decades which followed. Over the last five years there has been a small but steady increase in terrorist deaths in the US.
In most years terror attacks caused fewer than 50 deaths per year, and in many years no one died from attacks. With exception of 2001, terrorism accounted for less than 0.01% of all deaths in the US in every year since 1970. For comparison, around 120 people die in road accidents in the United States every day.16 This means the annual death toll from terrorism in most years is equivalent to half a day or less on the country’s roads.
When we look at the number of terrorist attacks we see a marked decline since the early 1970s.
How often are airlines hijacked?
Airline hijackings are a very visible form of terrorism. The 9/11 attacks in New York were the most prominent example. But whilst hijackings can seem like a modern form of terrorism, they have a long history: in fact, hijackings today are very rare and much less frequent than the past.
Airline hijacking – sometimes termed ‘skyjacking’ – is the unlawful seizure of an aircraft, either by an individual or an organized group. Most commonly, hijackers would demand the pilot fly to a specific location, or sometimes hijackers would attempt to fly the aircraft themselves.
Incidents of hijacking have been around almost as long as human flight itself with suspected hijacks dating as far back as 1919, and the first recorded hijacking in 1931. But they were still relatively rare until the 1950s.
In this chart we see the annual number of hijacking incidents and fatalities globally from 1942 onwards. This data is sourced from the Aviation Safety Network, which provides up-to-date and complete information on airliner accidents across the world. Here we see very few incidents in the 1940s, with a small rise through the 1950s and 1960s. Until 1968, there were never more than 10 incidents in a year.
But from 1968 to 1972, there was a sharp rise in hijackings – particularly in the United States. This is often called the “Golden Age of hijacking” where hijackers would frequently demand to be taken to a specific location (often Cuba) or demand large amounts of money as ransom. Over this 5-year period there were 305 hijackings globally. Most ended in no fatalities: 46 were killed, 25 of which happened in 1972.
The “Golden Age” was brought to an end in 1973 when the Federal Aviation Administration (FAA) in the US introduced rules which required the screening of all passengers and carry-on luggage before boarding passenger aircraft. This is a measure we take for granted today.
Over the period from 1973 until 2001, hijacking incidents across the world were fairly consistent, in the range of around 20 to 40 per year. In most years there were very few fatalities, although these were interspersed with fatal events which would kill tens of passengers.
2001 is the major outlier. Despite there being a relatively small number of events – just 11, which was low by historic standard – the events of 9/11 made it the most fatal. Four airliners were hijacked, two of which were flown into the Twin Towers of the World Trade Center. 2,996 people died as a result of the 9/11 attacks, making it the most fatal terrorist incident in recorded history.
Regulation was quickly tightened. This resulted in a sudden decline in hijacking following the 9/11 attacks, with very few incidents and almost no fatalities. Cockpit doors on many aircraft are now bulletproof and reinforced; security checks are now standard in most countries, including domestic flights (at the time, many countries had no or random checks for domestic travel); and levels of airport screening have been tightened significantly.
They’ve been successful. Fatalities from hijackings are now very rare.

Many people are worried about flying because of the perceived risk of terrorism. Some may avoid flying completely.
But it’s important to put the risk of hijacking (and flying in general) in perspective. Aviation, especially commercial air travel, is very safe. If we put it in perspective of the number of the number of people flying, in 2017 there were only 0.01 deaths per million passengers: that’s one death per 100 million. This has improved significantly since the 1970s when there was around 5 deaths per million passengers.
Hijacking deaths are then only a very small fraction of the total from aviation. In this chart we see the annual deaths from commercial airliners, and the number specifically from hijackings. This again highlights that hijacking fatalities are rare: with increased safety measures post-2001 there have been almost none.

Half of Americans are worried about being a victim of terrorism
Spreading widespread fear is a key aim of terrorism.
How effective have terrorists been in this regard? How many of us are actually worried about terrorism?
Many of the most comprehensive surveys on public opinion on terrorism have been conducted in the United States.
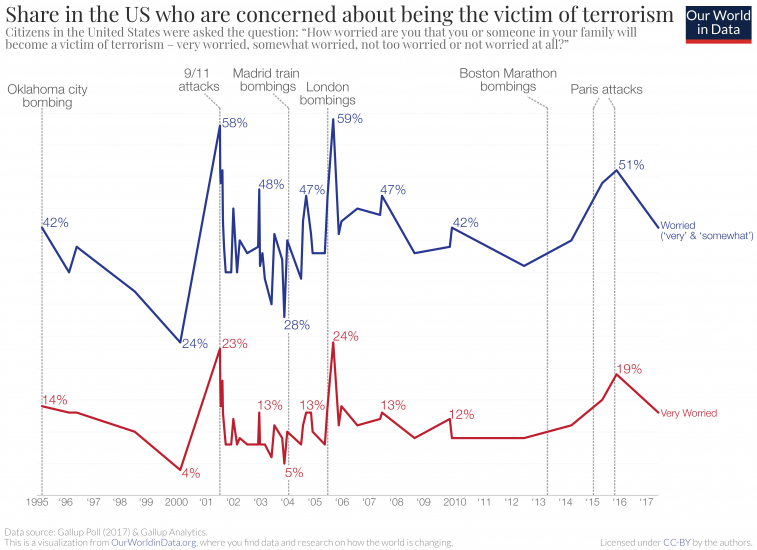
This visualization shows public concern for terrorism in the US since 1995. The data, from Gallup Polls, here shows the share of respondents who said they were “worried” (the sum of those who said they were ‘very’ or ‘somewhat worried’) and those who said they were “very worried” about them or a family member becoming the victim of terrorism.17
Overall, around half said they were worried, of which around 10-20% were “very worried” of becoming a victim of terrorism. Throughout this period – with the exception of 2001 – less than 0.01% of deaths in the United States resulted from terrorist attacks. The average over the period from 1996 to 2017 was 0.006%.
We also see that concerns were spiking after large terrorist attacks in the US or European countries.18 There was an immediate spike following the 9/11 attacks in New York and the 2005 London bombings; and a rise after the Boston Marathon bombings, and succession of attacks in Paris. When we see a recent attack in the news, we become more worried it will also happen to us or family members.
We should treat these results with some caution. It’s not entirely clear what someone means when they ask the question: “How worried are you that you or someone in your family will become a victim of terrorism?”. Is this asking about how likely we think this scenario is? The level of risk? Or simply whether we’d be worried if there was a chance it could happen to us? People may interpret it differently. Many people might think the probability of this happening is low, but upon consideration they’d be worried that a family member could be a victim.
Because of this we should study how people change their behaviors based on this fear. Here we find more evidence that many people in the US are worried about terrorism.
There are certain locations and activities that are often the target of terrorist attacks: busy public spaces or countries around the world where attacks are more frequent.19 Especially in the US in the aftermath of 9/11, aeroplanes and skyscrapers will also be seen as a potential target for terrorism, even if the evidence suggests that plane hijackings are now incredibly rare.
The same survey as that referenced above also asked respondents if they were or weren’t less willing to do certain activities after terrorist events in recent years.
The chart shows the share of respondents who said they were less willing to do such activities. Here we see that a large share was willing to change their behaviors: over 40% said they were less willing to travel abroad; around a third were less likely to fly and go to crowded events; and one-quarter to go into skyscrapers.
Do we see these claims when we look at actual patterns of behaviour?
A range of studies have looked at the impact of major terrorist incidents on airline demand, travel and tourism. Following 9/11 there was an immediate reduction in US airline demand – given as the number of passengers – of over 30%.20 This large fall did not persist at that level, but in the months and few years which followed, there was an ongoing reduction in demand of 7.4%. Although passenger demand later increased again, analyses suggest that domestic air travel did not return to the levels which would have been projected in the absence of the attacks.21 This was also true of tourism to the United States in the years which followed 9/11.22
These studies didn’t look at the distribution of reduced travel demand – whether it was people who stopped flying completely or just less often – so we can’t directly tie it together with the Gallup survey results. But both seem to report the same finding: 9/11 had a negative impact on the willingness of people in the US to fly.23

Which countries are most worried about terrorism?
In a separate post we looked at levels of concern about terrorism in the US. What about the rest of the world? Is it just as worried about terrorism?
To better understand the global picture we can draw upon data from the World Values Survey (WVS). The WVS is a global research project running for decades, which assesses public opinion on a wide range of values and beliefs. For a range of questions it provides comparable data from across the world.
In its surveys from 2010 to 2014, it asked the question: “To what degree are you worried about the following? A terrorist attack.” Unfortunately not all countries were included in this particular question in the surveys. But the data is complete enough to provide perspectives across the world regions.
In the map we see the share of respondents who said they worry “very much” or “a great deal” about a terrorist attack. Similar to the results we presented above, 52% of US respondents said they were worried. But, compared to other countries this was relatively low. In some countries almost everyone said they were worried: Rwanda, Tunisia, Georgia, Malaysia and Haiti had over 90%. Across many countries in the Middle East, Southeast Asia, Africa and Latin America more than 8-in-10 said they were worried.
Some countries scored much lower: Argentina with 26%; New Zealand and Sweden with 22%; and the lowest was the Netherlands with only 10%.
What becomes clear here is that there is not a clear relationship between concern about and prevalence of terrorism. We see this in the scatter chart which plots the share who are worried about terrorism in a given country, against its share of deaths which result from terrorism. In most countries the probability of being in a terrorist attack is very low: terrorism accounts for less than 0.1% of deaths each year – in many it is less than 0.01%. But even so, concern can range from 10% to over 90% of the population.
In most countries levels of concern are disproportionate to the likelihood of being a victim.


Why do some terrorist attacks receive more media attention than others?
Terrorism receives media attention which is disproportionate to its frequency and share of deaths. This is also the intention of terrorists. Fear and attention is, after all, a core tactic of terrorism: media covering the attack is a key part of the terrorist’s strategy.24 Terrorists are rarely successful at hijacking airplanes anymore. But they are very successful hijacking global news cycles.
But media coverage of terrorism is also highly unequal: some events receive a lot of attention while most receive very little.25
Which are the characteristics that influence whether an attack is covered in the media or not? A previous study which looked at terrorist attacks in the US from 1980 to 2001 found they received more attention if there were fatalities; airlines were a target; it was a hijacking; or organized by a domestic group.26 Incidents received less coverage if they are framed as a crime (akin to homicide rather than terrorism, for which there is not always a clear boundary).27
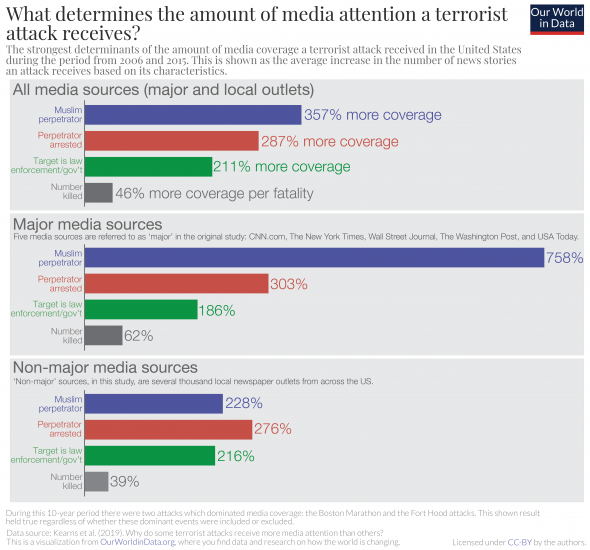
What does this relationship look like post-9/11? In a recent study, researchers looked at the differences in media coverage of terrorist events in the US from 2005 to 2015.28 Kearns et al. (2019) focused on three key characteristics: who the perpetrator was; the target of the attack; and the number of people killed. They assessed how these factors affected the amount of coverage attacks received in the US media.
We’ve summarized the results of their analysis in this visualization. It’s presented in three panels: for all media outlets (top); for major national news sources only (middle); and ‘non-major’ sources (bottom). In this study the authors define five major news sources as CNN.com, the New York Times, Wall Street Journal, the Washington Post and USA Today. ‘Non-major’ sources are thousands of local news outlets.
What’s striking is the much larger coverage if the perpetrator was Muslim. Across all media sources, attacks received on average 357% greater coverage if the attacker was Muslim; for major outlets this was higher still at 758%. It appeared to play less of a role for local outlets. From this analysis we also see that media coverage was higher when the perpetrator was arrested (partly because an arrest is a reportable event in itself); the target of the attack was law enforcement or government; and when people were killed in the attack. One additional fatality meant an average increase of coverage by 46%.
Which events do and do not receive media coverage matter: evidence shows that media plays a defining role in shifting public opinion; perceptions of the importance of particular issues; and national policy conversations.29 It can have a significant impact on how the public perceives terrorism and its associations.
In particular, increased coverage when a perpetrator is Muslim presents an unbalanced overview of US terrorism to the public. In the dataset that this study relied on, Muslims perpetrated 12.5% of attacks in the US, yet received half of the news coverage.
Combined with the fact that terrorism in general gets a disproportionate amount of media attention, the fact that the worst attacks – those that cause the greatest number of deaths – get most attention further exacerbates public fear. But it does mean that it’s not just terrorism that receives a lot of attention; it’s the rare but most extreme events that become easiest for us to recall.
Terrorism is over-represented relative to its share of deaths in media coverage
One of the primary motivations for our work at Our World in Data is to provide a fact-based overview of the world we live in — a perspective that includes the persistent and long-term changes that run as a backdrop to our daily lives. We aim to provide the complement to the fast-paced reporting we see in the news. The media provides a near-instantaneous snapshot of single events; events that are, in most cases, negative. The persistent, large-scale trends of progress never make the headlines.
But is there evidence that such a disconnect exists between what we see in the news and what is reality for most of us?
One study attempted to look at this from the perspective of what we die from: is what we actually die from reflected in the media coverage these topics receive?30
To answer this, Shen and his team compared four key sources of data:
- the causes of deaths in the USA (statistics published by the CDC’s WONDER public health database)
- Google search trends for causes of deaths (sourced from Google Trends)
- mentions of causes of deaths in the New York Times (sourced from the NYT article database)
- mentions of causes of deaths in The Guardian newspaper (sourced from The Guardian article database)
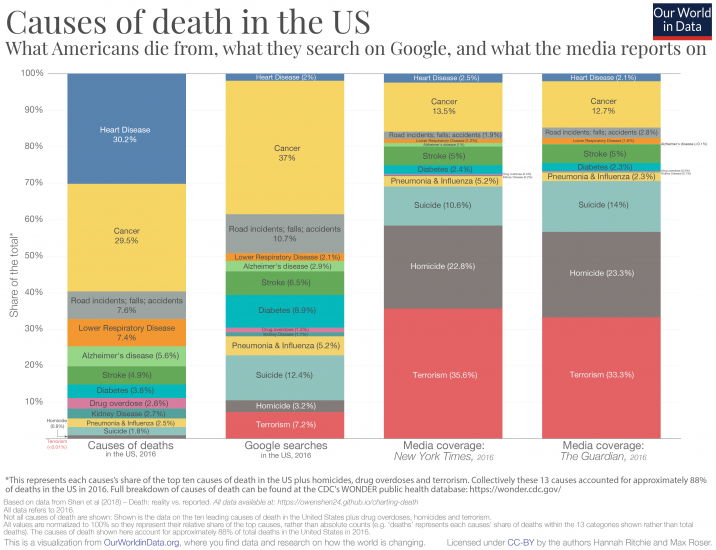
For each source the authors calculated the relative share of deaths, share of Google searches, and share of media coverage. They restricted the considered causes to the top 10 causes of death in the US and additionally included terrorism, homicide, and drug overdoses. This allows for us to compare the relative representation across different sources.31
So, what do the results look like? In the chart below I present the comparison.
The first column represents each cause’s share of US deaths; the second the share of Google searches each receives; third, the relative article mentions in the New York Times; and finally article mentions in The Guardian.
The coverage in both newspapers here is strikingly similar. And the discrepancy between what we actually die from and what we get informed of in the media is what stands out:
- around one-third of the considered causes of deaths resulted from heart disease, yet this cause of death receives only 2-3 percent of Google searches and media coverage;
- just under one-third of the deaths came from cancer; we actually Google cancer a lot (37 percent of searches) and it is a popular entry here on our site; but it receives only 13-14 percent of media coverage;
- we searched for road incidents more frequently than their share of deaths; however, they receive much less attention in the news;
- when it comes to deaths from strokes, Google searches and media coverage are surprisingly balanced;
- the largest discrepancies concern violent forms of death: suicide, homicide and terrorism. All three receive much more relative attention in Google searches and media coverage than their relative share of deaths. When it comes to the media coverage on causes of death, violent deaths account for more than two-thirds of coverage in the New York Times and The Guardian but account for less than 3 percent of the total deaths in the US.
What’s interesting is that what Americans search on Google is a much closer reflection of what kills us than what is presented in the media. One way to think about it is that media outlets may produce content that they think readers are most interested in, but this is not necessarily reflected in our preferences when we look for information ourselves.
[Clicking on the visualization will open it in higher resolution; The chart shows the summary for the year 2016, but interactive charts for all available years are available at the end of this blog.32]
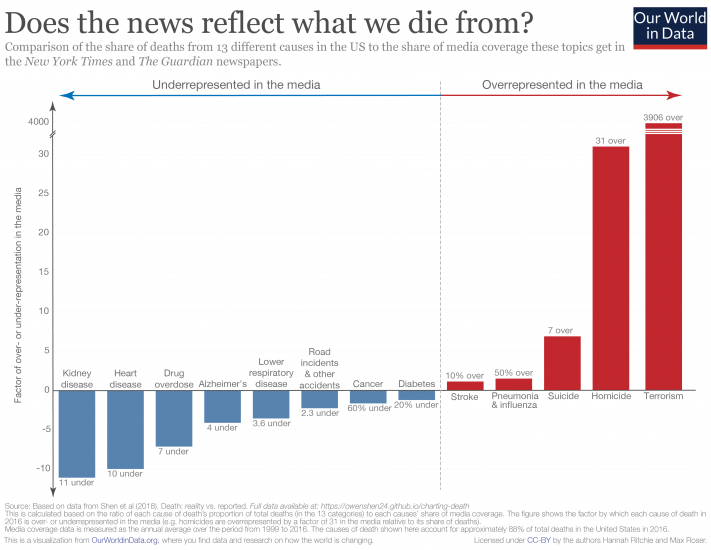
As we can see clearly from the chart above, there is a disconnect between what we die from, and how much coverage these causes get in the media. Another way to summarize this discrepancy is to calculate how over- or underrepresented each cause is in the media. To do this, we simply calculate the ratio between the share of deaths and share of media coverage for each cause.
In this chart, we see how over- or underrepresented each cause is in newspaper coverage.33 Causes shown in red are overrepresented in the media; those in blue are underrepresented. Numbers denote the factor by which they are misrepresented.
The major standout here – I had to break the scale on the y-axis since it’s several orders of magnitude higher than everything else – is terrorism: it is overrepresented in the news by almost a factor of 4000.
Homicides are also very overrepresented in the news, by a factor of 31. The most underrepresented in the media are kidney disease (11-fold), heart disease (10-fold), and, perhaps surprisingly, drug overdoses (7-fold). Stroke and diabetes are the two causes most accurately represented.
[Clicking on the visualization will open it in higher resolution].
From the comparisons above, it’s clear that the news doesn’t reflect what we die from. But there is another important question: should these be representative?
There are several reasons we would, or should, expect that what we read online, and what is covered in the media wouldn’t correspond with what we actually die from.
The first is that we would expect there to be some preventative aspect to information we access. There’s a strong argument that things we search for and gain information on encourages us to take action which prevents a further death. There are several examples where I can imagine this to be true. People who are concerned about cancer may search online for guidance on symptoms and be convinced to see their doctor. Some people with suicidal thoughts may seek help and support online which later results in an averted death from suicide. We’d therefore expect that both intended or unintended exposure to information on particular topics could prevent deaths from a given cause. Some imbalance in the relative proportions therefore makes sense. But clearly there is some bias in our concerns: most people die from heart disease (hence it should be something that concerns us) yet only a small minority seek [possibly preventative] information online.
Second, this study focused on what people in the USA die from, not what people across the world die from. Is media coverage more representative of global deaths? Not really. In another blog post, ‘What does the world die from?‘, I looked in detail at the ranking of causes of death globally and by country. The relative ranking of deaths in the USA is reflective of the global average: most people die from heart disease and cancers, and terrorism ranks last or second last (alongside natural disasters). Terrorism accounted for 0.06 percent of global deaths in 2016. Whilst we’d expect non-US events to feature in the New York Times, global news shouldn’t substantially affect representative coverage of causes.
The third relates to the very nature of news: it focuses on events and stories. Whilst I am often critical of the messages and narratives portrayed in the media, I have some sympathy for what they choose to cover. Reporting has become increasingly fast-paced. As news consumers, our expectations have quickly shifted from daily, to hourly, down to minute-by-minute updates of what’s happening in the world. Combine this with our attraction to stories and narratives. It’s not surprising that the media focuses on reports of single (inadvertently negative) events: a murder case or a terrorist attack. The most underrepresented cause of death in the media was kidney disease. But with an audience that expects a minute-by-minute feed of coverage, how much can possibly be said about kidney disease? Without conquering our compulsion for the latest unusual story, we cannot expect this representation to be perfectly balanced.
Media and its consumers are stuck in a reinforcing cycle. The news reports on breaking events, which are often based around a compelling story. Consumers want to know what’s going on in the world — we are quickly immersed by the latest headline. We come to expect news updates with increasing frequency, and media channels have clear incentives to deliver. This locks us into a cycle of expectation and coverage with a strong bias for outlier events. Most of us are left with a skewed perception of the world; we think the world is much worse than it is.34
The responsibility in breaking this cycle lies with both media producers and consumers. Will we ever stop reporting and reading the latest news? Unlikely. But we can all be more conscious of how we let this news shape our understanding of the world.
And journalists can do much better in providing context of the broader trends: if reporting on a homicide, for example, include context of how homicide rates are changing over time.35
As media consumers we can be much more aware of the fact that relying on the 24/7 news coverage alone is wholly insufficient for understanding the state of the world. This requires us to check our (often unconscious) bias for single narratives and seek out sources that provide a fact-based perspective on the world.
This antidote to the news is what we try to provide at Our World in Data. It should be accessible for everyone, which is why our work is completely open-access. Whether you are a media producer or consumer, feel free to take and use anything you find here.
Additional information


What we can and can’t know about terrorism from the Global Terrorism Database
In our research on terrorism we rely on the Global Terrorism Database (GTD) as a key source of data on incidents and fatalities from terrorism across the world. It’s the most comprehensive database of incidents to date. It does, however, have limitations which we think should be clear before making inferences from trends or signals represented by the data.
In summary, this is our assessment of what the GTD should and should not be used for:
- Recent data – particularly over the past decade – is likely to be sufficiently complete to infer the distribution of incidents and fatalities across the world, and how they have changed in recent years;
- The complete series, dating back to 1970, for North America and Western Europe we expect to be sufficiently complete to infer trends and changes in terrorism over time;
- GTD data – as its authors acknowledge – undercounts events in the earlier period of the database – the 1970s and 1980s in particular. We would caution against trying to infer trends in terrorism globally since the 1970s;
- We would also caution against trying to infer trends in terrorism across most regions – with the exception of North America and Western Europe – in the earlier decades of this dataset.
In the area of terrorism research, there are now multiple databases available which attempt to record and detail terrorist incidents across the world. Some of the most well-known databases include International Terrorism: Attributes of Terrorist Events (ITERATE); RAND Database of Worldwide Terrorism Incidents (RDWTI) and the Global Terrorism Database (GTD). We take a more detailed look at the differences in estimates from these three databases here.
In our research on terrorism we rely mostly on the Global Terrorism Database for multiple reasons: it’s an open-access resource made available for researchers; it is the most up-to-date database available (RAND, in contrast, only extends to 2009); and is the most comprehensive in terms of the number of incidents covered.36
Since 2006 the database has been curated and maintained by the National Consortium for the Study of Terrorism and Responses to Terrorism (START), at the University of Maryland. In 2007 it was officially published as an academic output in the journal Terrorism and Political Violence, and since then has been one of the widely used resources within academic research on terrorism.37 A large body of peer-reviewed literature on topics ranging from global or regional trends in terrorism; its link to poverty and socioeconomic factors; governance; and counter-terrorism strategy rely on it as the most detailed catalogue of terrorist incidents.38,39,40 The GTD also forms the basis of the Global Terrorism Index published by the Institute for Economics & Peace (IEP).
The GTD is therefore well-respected and highly-regarded as a comprehensive data source on global terrorism. It does, however, have limitations which we think should be clear before making inferences from trends or signals represented by the data.
There are two main limitations or challenges with any long-term dataset on terrorism:
- The completeness of the database over time;
- how the concept of ‘terrorism’ is defined, which affects which incidents are or aren’t included in the dataset.
The GTD – as with other terrorism databases – are curated through records and analysis of print and electronic media.41 This process has undoubtedly become easier over time. We expect that the collation of incidents across the world today and in the recent past is sufficiently complete to understand the global distribution of terrorist incidents and how they have changed over time. A valuable resource which also provides impressive accounts of terrorist incidents across the world is the many detailed entries in Wikipedia by year, by region or by country. Using this as a cross-reference with the GTD, we have high confidence in the completeness of global data in recent years.
Where we have less confidence is the completeness of the data for inferring longer-term changes. The GTD extends back to 1970. In their accounts of the GTD, the authors of the database acknowledge that data for this earlier period most likely undercounts the number of terrorist incidents and victims.42 This is understandable: it seems unlikely that all terrorist incidents in the world in the 1970s were (1) reported in print media; and (2) that all print reports across the world could be traced, collected and analysed. The shift to digital media in recent years has made this process much easier.
Global records of terrorist incidents – at least in the first half of the dataset – are therefore likely to be an underestimate. We have found no research which attempts to quantify the extent of this underestimate, so we cannot say by how much.
We do think some countries or regions – most notably the US and Western Europe – have a high degree of completeness over these decades. Since 1970, the GTD has been maintained by four organizations, all of them US-based. Until 1997 the GTD was collated by Pinkerton Global Intelligence Service (PGIS) which trained US researchers to identify terrorist incidents from reports, governmental records and international media to assess the risk of terrorism for clients. We would expect that this mandate would mean records are skewed towards more complete coverage of incidents in the US and countries with better reporting and records of incidents, such as Western Europe.
In researching our posts: “Has terrorism increased in Western Europe?” and “Has terrorism increased in the United States?” we cross-referenced GTD records with the detailed accounts of these entries on Wikipedia.43 The GTD contains a much higher number of incidents since those listed on Wikipedia for Europe are limited to attacks with ten or more civilians deaths. But for major incidents, there are closely matched.
For other regions we would caution against inferring trends over this complete time period. One key reason we have reservations about the completeness of earlier data is that there are several incidents we would have expected to have featured in the GTD which are not included.
The other limitation to inferring particular trends in terrorism are changes in methodology and shifting – or unclear – definitions of terrorism over time. As we discuss in our post ‘What is terrorism?’ there is no clear consensus on a definition of terrorism. Even within the research community there are differences in its scope, and there are often blurry lines between what constitutes terrorism as opposed to other forms of violence such as homicide and civil war.
We discuss the definition of terrorism used by the GTD here and how its methodology differs from other well-known databases here. But an additional question when trying to understand changes, is whether the GTD had a consistent definition and methodology over time.
As previously mentioned, the GTD has been maintained by four organizations since 1970. With time – and particularly with the shift towards maintenance by an academic organization – the criteria for a terrorist incident improved and refined over time. Whilst researchers have attempted to retrospectively revise estimates (particularly of the period from 1970 to 1997) based on updated criteria, the authors caution that there will inevitably be issues in data consistency over this period. This inconsistency will, most likely, be expressed in an underestimate of terrorist incidents earlier in the dataset.
For this reason, again, we would be cautious about trying to infer changes in the prevalence of terrorism globally and across most regions since 1970.
How (and why) do estimates of deaths from terrorism vary?
In terrorism research, there are multiple databases available which attempt to record and detail terrorist incidents across the world. Some of the most well-known databases include International Terrorism: Attributes of Terrorist Events (ITERATE); RAND Database of Worldwide Terrorism Incidents (RAND/RDWTI) and the Global Terrorism Database (GTD).
In our research on terrorism we present data from the Global Terrorism Database (GTD) for several reasons: it’s the most comprehensive in terms of the number of incidents covered; it is the most up-to-date; and is open-access, so widely used in academic research.44 RAND, for example, only extends to the year 2009; and ITERATE is copyrighted, and not open-access for external users.
Nonetheless, estimates of the number of terrorist incidents and fatalities vary across these databases. Understanding why these differences exist is important for how this data is interpreted, and what we can conclude about the prevalence, causes and consequences of terrorism. Our understanding of the sources and frequency of terrorism can have a significant impact on many areas of society and policy, including immigration, counterterrorism efforts, and international relations.
In the chart we see a comparison between estimates of terrorism fatalities from the GTD and RAND datasets. Both sources go back as far as 1970 (RAND to 1968), with GTD extending to 2017 whilst RAND was discontinued in 2009.
Here we see large differences between the sources until the late 1990s/Millennium, after which they appear to more closely converge. Why is this the case?
In a study published in the Journal of Peace Research, Sandler (2014) looked at the differences in methodology, estimates, and conclusions from the various terrorism databases in detail.45 Sandler found that the largest differentiator between the databases was whether they recorded domestic, transnational, or both forms of terrorism. Domestic terrorist incidents are those where the venue, perpetrators and victims are all from the same country: for example, a terrorist attack committed in the United States by a US citizen against victims from the US. If an attack involves more than one country – if the venue or victims of the attack are not the same country as the perpetrators – then it is classified as transnational.
The largest difference between the datasets is therefore that:
- GTD includes both domestic and transnational incidents across its entire dataset from 1970 onwards;
- RAND includes only transnational incidents until 1997; thereafter it included both domestic and transnational;
- ITERATE includes only transnational incidents.
If we look again at the comparison of the GTD and RAND datasets in the chart below, this starts to make more sense. In the period prior to 1997, GTD consistently records more fatalities than RAND. During this time it included domestic incidents, whilst RAND did not. Since 1997 – when RAND also included domestic attacks – their figures have converged.
A very clear example of this is seen if we look at figures in the United Kingdom. You can do this using the “Change country” button in the bottom-left of the interactive chart below. Here we see that during the 1970s and 1980s, RAND almost no fatalities compared to the GTD. During the 1970s and 1980s, terrorism in the UK – and Western Europe – was dominated by ‘The Troubles’ in Northern Ireland. Most deaths would have been classified as ‘domestic terrorism’, hence why they are included in the GTD but not the RAND figures.
Understanding the reasons for variations in the estimates of terrorist deaths may have a substantial impact on research and resource allocation. The root causes of transnational and domestic terrorism can be very different. The economic impacts – whether in the form of counterterrorism strategies; defence measures; or tourism impacts – can also vary significantly.46 Understanding the prevalence and extent of both is therefore very important.
Beyond differences in the inclusion of domestic and transnational events, some differences in estimates exist. Most databases used in terrorism research are curated and maintained from media reports, whether print or digital media. Differences in the completeness and choices of media sources can lead to further variation between databases. This is because media sources do not always report, or accurately report terrorist events; this can lead to absent or conflicting estimates.47
The GTD notes this limitation in its Data Collection Methodology. It states that “while the database developers attempt, to the best of their abilities, to corroborate each piece of information among multiple independent open sources, they make no further claims as to the veracity of this information”, meaning that inconsistencies are entirely possible. Therefore, even when databases use the same definition of terrorism, the reported number of deaths depend on which media sources the database uses.

The data visualisations in this page are generated using the Global Terrorism Database (GTD), and so it is important to understand the definition used in their construction. The GTD database uses the following definition of a terrorist attack:
The threatened or actual use of illegal force and violence by a non-state actor to attain a political, economic, religious, or social goal through fear, coercion, or intimidation. In practice this means in order to consider an incident for inclusion in the GTD, all three of the following attributes must be present:
- The incident must be intentional – the result of a conscious calculation on the part of a perpetrator.
- The incident must entail some level of violence or immediate threat of violence -including property violence, as well as violence against people.
- The perpetrators of the incidents must be sub-national actors. The database does not include acts of state terrorism.
In addition, at least two of the following three criteria must be present for an incident to be included in the GTD:
- Criterion 1: The act must be aimed at attaining a political, economic, religious, or social goal. In terms of economic goals, the exclusive pursuit of profit does not satisfy this criterion. It must involve the pursuit of more profound, systemic economic change.
- Criterion 2: There must be evidence of an intention to coerce, intimidate, or convey some other message to a larger audience (or audiences) than the immediate victims. It is the act taken as a totality that is considered, irrespective if every individual involved in carrying out the act was aware of this intention. As long as any of the planners or decision-makers behind the attack intended to coerce, intimidate or publicize, the intentionality criterion is met.
- Criterion 3: The action must be outside the context of legitimate warfare activities. That is, the act must be outside the parameters permitted by international humanitarian law (particularly the prohibition against deliberately targeting civilians or non-combatants).
Their definition is closed tied to Bruce Hoffman’s definition48:
We may therefore now attempt to define terrorism as the deliberate creation and exploitation of fear through violence or the threat of violence in the pursuit of political change. All terrorist acts involve violence or the threat of violence. Terrorism is specifically designed to have far-reaching psychological effects beyond the immediate victim(s) or object of the terrorist attack. It is meant to instill fear within, and thereby intimidate, a wider “target audience” that might include a rival ethnic or religious group,an entire country, a national government or political party, or public opinion in general. Terrorism is designed to create power where there is none or to consolidate power where there is very little. Through the publicity generated by their violence, terrorists seek to obtain the leverage, influence, and power they otherwise lack to effect political change on either a local or an international scale.
One important point of departure in many legal definitions of terrorism is computer hacking. The ‘interference with or disruption to an electric system’ is explicitly stated in UK terrorism law; this does not fit into the definitions above which centre on violence. The UK the Terrorism Act 2000 defines terrorism as:
The use or threat of action designed to influence the government or an international governmental organisation or to intimidate the public, or a section of the public; made for the purposes of advancing a political, religious, racial or ideological cause; and it involves or causes:
- serious violence against a person;
- serious damage to a property;
- a threat to a person’s life;
- a serious risk to the health and safety of the public; or
- serious interference with or disruption to an electronic system.
- Data: Terrorist attacks with 45-120 variables for each, including number of fatalities, injuries, weapons used, and perpetrators
- Geographical coverage: Global by country
- Time span: 1970-2016
- Available at: http://www.start.umd.edu/gtd/
- Data: Date and location of the attack, weapons used, injuries, fatalities and description
- Geographical coverage: Global by country
- Time span: 1968-2009
- Available at: http://www.rand.org/nsrd/projects/terrorism-incidents.html
- Data: High casualty terrorist bombings
- Geographical coverage: Global by country
- Time span: 1989-2014
- Available at: http://www.systemicpeace.org/inscrdata.html
- Data: International terrorist incidents
- Geographical coverage: Global by country
- Time span: 1978-2011
- Available at: https://libcms.oit.duke.edu/data/sources/iterate, restricted to Duke University members