On this page we provide an overview of excess mortality along with charts to explore the data. You can learn in more depth about different measures of excess mortality, their strengths and limitations, and their comparability across countries in our work with John Muellbauer and Janine Aron.
What is ‘excess mortality’?
Excess mortality is a term used in epidemiology and public health that refers to the number of deaths from all causes during a crisis above and beyond what we would have expected to see under ‘normal’ conditions.1 In this case, we’re interested in how the number of deaths during the COVID-19 pandemic compares to the deaths we would have expected had the pandemic not occurred — a crucial quantity that cannot be known but can be estimated in several ways.
Excess mortality is a more comprehensive measure of the total impact of the pandemic on deaths than the confirmed COVID-19 death count alone. It captures not only the confirmed deaths, but also COVID-19 deaths that were not correctly diagnosed and reported2 as well as deaths from other causes that are attributable to the overall crisis conditions.3
We further discuss the relationship between confirmed COVID-19 deaths and excess mortality in the section ‘Excess mortality during COVID-19: background.’
How is excess mortality measured?
Excess mortality is measured as the difference between the reported number of deaths in a given week or month (depending on the country) in 2020–2021 and an estimate of the expected number of deaths for that period had the COVID-19 pandemic not occurred.
The baseline of expected deaths can be estimated in several different ways.
As of 20 September 2021, we use an estimate produced by Ariel Karlinsky and Dmitry Kobak as part of the World Mortality Dataset (WMD). To produce this estimate, they first fit a regression model for each region using historical deaths data from 2015–2019;4 they then use the model to project the number of deaths we might normally have expected in 2020.5 Their model can capture both seasonal variation and year-to-year trends in mortality.
For more details on this method, see the article Karlinsky and Kobak (2021) Tracking excess mortality across countries during the COVID-19 pandemic with the World Mortality Dataset.6
Before 20 September 2021, we used a different expected deaths baseline: the average number of deaths over the years 2015–2019.7 We made this change because using the five-year average has an important limitation — it does not account for year-to-year trends in mortality and thus can misestimate excess mortality.8 The WMD projection, on the other hand, does not suffer from this limitation because it accounts for these year-to-year trends. Our charts using the five-year average are still accessible in links in the sections below.
For reported deaths, we source our data from both WMD and the Human Mortality Database.
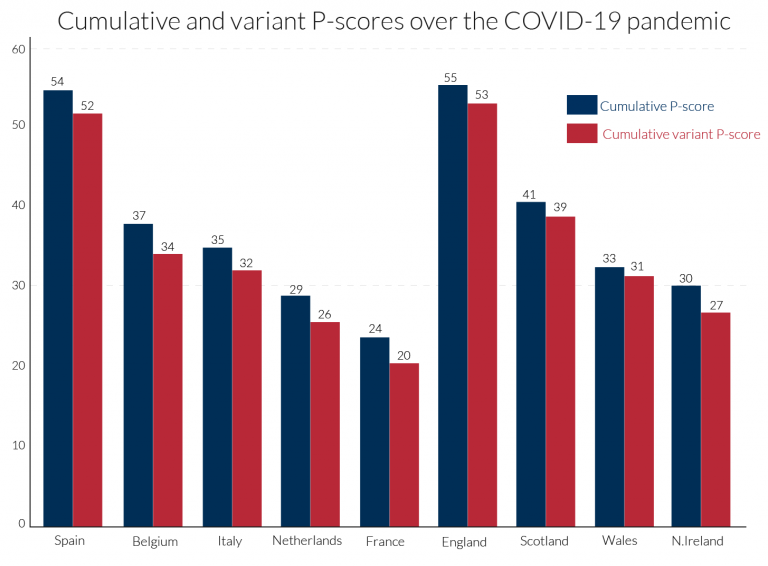
The raw number of excess deaths gives us a sense of scale, but it is less comparable across countries due to large differences in population. To better enable comparisons across countries, we measure excess mortality as the percentage difference between the reported and projected number of deaths. This metric is called the P-score and we calculate it as:9
For example, if a country had a P-score of 100% in a given week in 2020, that would mean the death count for that week was 100% higher than — that is, double — the projected death count for that week.
Excess mortality P-scores
The chart here shows excess mortality during the pandemic for all ages using the P-score. To see the P-scores for other countries click Add country on the chart.
Important points about excess mortality figures to keep in mind
The reported number of deaths might not count all deaths that occurred. This is the case for two reasons:
- First, not all countries have the infrastructure and capacity to register and report all deaths. In richer countries with high-quality mortality reporting systems, nearly 100% of deaths are registered. But in many low- and middle-income countries, undercounting of mortality is a serious issue. The UN estimates that, in “normal” times, only two-thirds of countries register at least 90% of all deaths that occur, and some countries register less than 50% — or even under 10% — of deaths. During the pandemic the actual coverage might be even lower.10
- Second, there are delays in death reporting that make mortality data provisional and incomplete in the weeks, months, and even years after a death occurs — even in richer countries with high-quality mortality reporting systems.11 The extent of the delay varies by country. For some, the most recent data points are clearly very incomplete and therefore inaccurate — we do not show these clearly incomplete data points.12
The date associated with a death might refer to when the death occurred or to when it was registered. This varies by country. Death counts by date of registration can vary significantly irrespectively of any actual variation in deaths, such as from registration delays or the closure of registration offices on weekends and holidays. It can also happen that deaths are registered, but the date of death is unknown — this is the case for Sweden.13
The dates of any particular reporting week might differ slightly between countries. This is because countries that report weekly data define the start and end days of the week differently. Most follow international standard ISO 8601, which defines the week as from Monday to Sunday, but not all countries follow this standard.14 In the charts on this page we use the ISO 8601 week end dates from 2020–2021.15
Deaths reported weekly might not be directly comparable to deaths reported monthly. For instance, because excess mortality calculated from monthly data tends to be lower than the excess calculated from weekly data.16
For more discussion and detail on these points, see our article with John Muellbauer and Janine Aron as well as the metadata from our data sources: the Human Mortality Database and World Mortality Dataset.


Excess mortality P-scores by age group
The chart here shows P-scores broken down by age groups: ages 0–14, 15–64, 65–74, 75–84, and 85+. The mortality risk from COVID-19 increases with age.17
Countries for which the reported deaths data is sourced from the World Mortality Dataset are not included in this chart because the data is not broken down by age. Though WMD does provide the projected baselines used for calculating P-scores by age in this chart.18
Why is it informative to look at P-scores for different age groups?
The chart in the previous section showed P-scores for all ages — these are impacted by differences in both mortality risk by age and countries’ age distributions. For example, countries with older populations — which have a higher mortality risk, including from COVID-19 — will tend to have higher all-age P-scores by default. Looking at the P-scores for different age groups is therefore informative when comparing countries.


Excess mortality using raw death counts
Besides visualizing excess mortality as a percentage difference as we have with the P-scores, we can also look at the raw death count as shown in the chart here. The raw death count gives us a sense of scale: for example, the US suffered roughly 470,000 excess deaths in 2020, compared to 352,000 confirmed COVID-19 deaths during that year.
However, this measure is less comparable across countries due to large differences in populations. You can still see the death counts for other countries by clicking “Change country” on the chart.


Excess mortality: our data sources
In our presentation of excess mortality figures we rely on the all-cause mortality data from the Human Mortality Database and the World Mortality Dataset. We have calculated P-scores from the reported death data provided by these sources, and from the projections provided by WMD. We make the data used in our charts downloadable as a complete and structured .csv file here on our GitHub site.
The Human Mortality Database (HMD) is maintained by a team of researchers based at the University of California, Berkeley, USA and the Max Planck Institute for Demographic Research in Rostock, Germany. HMD has been publishing updates on all-cause mortality for currently 38 countries as part of its Short-term Mortality Fluctuations (STMF) project since May 2020.19
HMD updates its data weekly. The data is sourced from Eurostat and national statistical agencies — a full list of sources and detailed information for each country’s data series can be found in the HMD metadata file. HMD was our sole source of data until 20 February 2021.
You can read more about HMD’s STMF project in the article by Németh, Jdanov, and Shkolnikov (2021) An open-sourced, web-based application to analyze weekly excess mortality based on the Short-term Mortality Fluctuations data series.20
The World Mortality Dataset (WMD) is maintained by the researchers Ariel Karlinsky and Dmitry Kobak. WMD has been publishing updates on all-cause mortality for currently 109 countries and regions since January 2021. We do not use the data from some of these countries because they fail to meet the following quality criteria: 1) at least three years of historical data;21 and 2) data published either weekly or monthly.22 The data is not broken down by age so we only include it in our all-age charts.23
As of 20 September 2021, we use WMD’s projected deaths for 2020 as our baseline for the expected deaths had the COVID-19 pandemic not occurred. We use this baseline for all countries and regions, including for deaths broken down by age group.
WMD updates its data weekly. The data is sourced from the Human Mortality Database — we use the reported deaths data directly from HMD and not WMD — Eurostat, and national statistical agencies. A full list of sources and information for each country’s data series can be found on WMD’s GitHub site.
You can read more about WMD in the article by Karlinsky and Kobak (2021) Tracking excess mortality across countries during the COVID-19 pandemic with the World Mortality Dataset.24
Source information country by country
International organizations are not publishing an international database on excess mortality
Unlike statistics on confirmed COVID-19 deaths — for which several organizations such as the WHO, ECDC, and Johns Hopkins University are collating data for all countries — there is no single source of data on excess mortality. And no data source will have data for all countries, because excess mortality statistics will only be available for a minority of countries.
This is a major problem for policymakers, researchers, and the general public that have a need to understand the ongoing pandemic.
Several media publications and regional data sources are publishing public databases
In addition to the Human Mortality Database and the World Mortality Dataset, several media publications and regional data sources have been publishing excess death data for some countries.
- The Economist published the first database on excess mortality on GitHub. Its reporting on the topic can be found here.
- The New York Times publishes its dataset on excess mortality on GitHub. Its reporting on the topic can be found here.
- The Financial Times publishes its dataset on excess mortality on GitHub. Its reporting on the topic can be found here.
- The Washington Post publishes its dataset on excess mortality in the US on GitHub. The GitHub page also contains links to the Post’s reporting on the topic.
- Eurostat publishes downloadable data for European countries on its website.
Excess mortality during COVID-19: background
In our work on the Coronavirus pandemic we visualize the data on the confirmed number of deaths from COVID-19 for all countries. We update this data daily based on figures published by Johns Hopkins University (JHU).
But these confirmed deaths figures may differ from the excess mortality figures, which better capture the total impact of the pandemic on deaths, for several reasons:
- Some (but not all) countries only report COVID-19 deaths that occur in hospitals — people that die from the disease at home may not be recorded;
- Some countries only report deaths for which a COVID-19 test has confirmed that a patient was infected with the virus — untested individuals may not be included;
- Death reporting systems may be insufficient to accurately measure mortality — this is particularly true in poorer countries;
- The pandemic may result in increased deaths from other causes for a number of reasons including weakened healthcare systems; fewer people seeking treatment for other health risks; or less available funding and treatment for other diseases (e.g. HIV/AIDS, malaria, tuberculosis);
- The pandemic may also result in fewer deaths from other causes. For example, the mobility restrictions during the pandemic might lead to fewer deaths from road accidents. Or there might be fewer deaths from the flu because of interventions to stop the spread of COVID-19, or because COVID-19 now causes deaths that would have otherwise been caused by the flu.
Because COVID-19 “competes” with other causes of death like the flu, this means that COVID-19 deaths are not by default excess deaths. It is possible for there to be more confirmed COVID-19 deaths than excess deaths, and in fact for there to be confirmed COVID-19 deaths without any excess deaths.
This all makes clear that the two statistics — confirmed deaths due to COVID-19 and excess mortality — can be related in ways that are not straightforward.
This is because they are giving a perspective on different questions: The confirmed deaths often undercount the total impact of the pandemic on deaths, but in contrast to excess mortality they contain information about the cause of death. The excess mortality includes not only those who have died from COVID-19, but also those from all other causes — and these numbers may also be changing due to the overall pandemic conditions. This means both metrics are needed to understand the total impact of the pandemic on deaths.
Excess mortality data is unfortunately not available for many countries, and because the required data from previous years is lacking this will continue to be the case. When the goal is to monitor a global pandemic, this is a major limitation of this metric.
Excess mortality can only be calculated on the basis of accurate, high-frequency data on mortality from previous years. But few countries have statistical agencies with the capacity and infrastructure to report the number of people that died in a given month, week or even day-to-day. For most low- and middle-income countries, such data is not available for previous years.
As we saw from the available excess mortality estimates discussed previously, this data is most often only available for richer countries that can afford high-quality data reporting systems.
Researchers can draw on some other sources to estimate excess mortality — such as funeral or burial records — or on data from subnational regions of poorer countries (often the capital). But in many cases no information at all can be obtained.