Feeding the world in a sustainable way is one of our most pressing challenges in the coming decades. Meat plays a pivotal role in this.
Meat is an important source of nutrition for many people around the world. Global demand for meat is growing: over the past 50 years, meat production has more than tripled. The world now produces more than 340 million tonnes each year.
But the production of meat has large environmental impacts – increasing greenhouse gas emissions, agricultural land and freshwater use. One of the world’s most pressing challenges is to produce and consume meat, dairy and other protein products in a way that reduces its environmental impacts.
Summary
- The world now produces more than three times the quantity of meat as it did fifty years ago. In 2018, production was around 340 million tonnes.
- Pigmeat is the most popular meat globally, but the production of poultry is increasing most rapidly.
- 80 billion animals are slaughtered each year for meat.
- The average person in the world consumed around 43 kilograms of meat in 2014. This ranges from over 100kg in the US and Australia to only 5kg in India.
- Meat consumption increases as the world is getting richer.
- The world now produces around 800 million tonnes of milk each year – more than double the amount fifty years ago.
- Richer countries tend to consume more milk per person.
- The amount of meat produced for a given animal varies significantly across the world based on production systems.
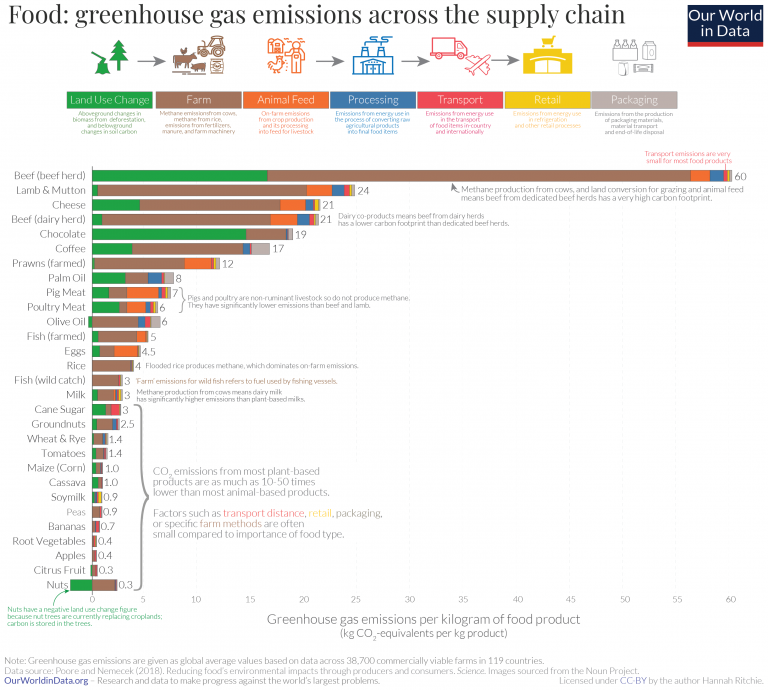
- Livestock production has large environmental impacts on greenhouse gas emissions, land and water use. Beef and lamb have much larger environmental impact than pigmeat and poultry.
All our charts on Meat and Dairy Production
Related research entries
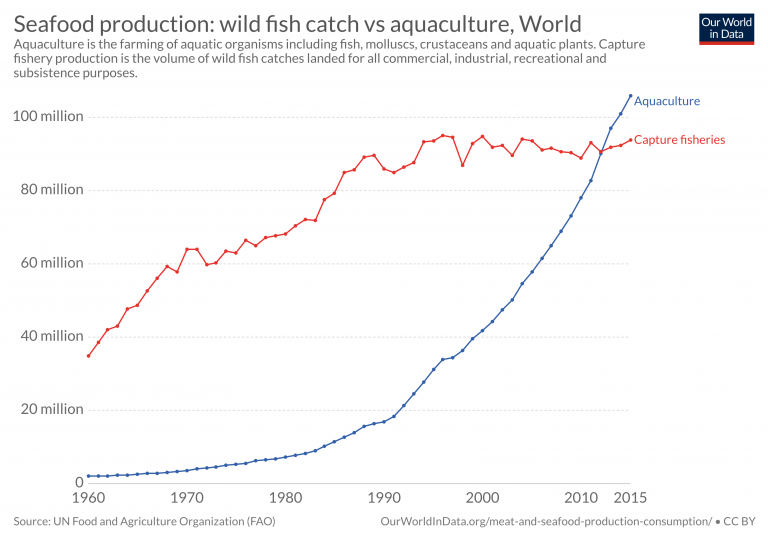
Seafood production – fish and seafood is another key source of protein and nutrition for populations across the world. How much fish do people eat, and what are the environmental impacts?
Diet compositions – varied diets are essential for good health and nutrition. But the quality and diversity of diets varies significantly across the world. What do people eat?
Micronutrient deficiency – poor dietary diversity means many people lack the essential vitamins and minerals they need for good health. How common is micronutrient deficiency and who is most at risk?
Land use – half of the world’s habitable land is used for agriculture, and more than three-quarters of this is used for livestock. In this entry we look in detail at land use across the world.
Global meat production
Global meat production has increased rapidly over the past 50 years – as we see, total production has more than quadrupled since 1961. The chart shows global meat production by region, measured in tonnes.
Regionally, Asia is the largest meat producer, accounting for around 40-45 percent of total meat production. This regional distribution has changed significantly in recent decades. In 1961, Europe and North America were the dominant meat producers, accounting for 42 and 25 percent, respectively. In 1961, Asia produced only 12 percent. By 2013, Europe and North America’s share had fallen to 19 and 15 percent, respectively.
This reduction in production share was despite a large increase in production in absolute terms: Europe’s meat output has approximately doubled over this period, whilst North American output has increased 2.5-fold. Production increases in Asia, however, have been staggering: meat production has increased 15-fold since 1961.
Absolute increases in production in other regions have also been substantial, with output in all regions (with exception to the Caribbean which approximately tripled) growing more than 5-fold over this period.


Meat production by animal
In the chart we see how meat production has changed by livestock type since 1961.
At a global level we see that the dominant livestock types are poultry, cattle (which includes beef and buffalo meat), pig, and sheep & goat to a lesser extent. However, the distribution of meat types varies significantly across the world; in some countries, other meat types such as wild game, horse, and duck can account for a significant share of total production.
Although production of all major meat types have been increasing in absolute terms, in relative terms the share of global meat types have changed significantly over the last 50 years. In 1961, poultry meat accounted for only 12 percent of global meat production; by 2013 its share has approximately tripled to around 35 percent. In comparison, beef and buffalo meat as a share of total meat production has nearly halved, now accounting for around 22 percent. Pigmeat’s share has remained more constant at approximately 35-40 percent.

In the chart we see the global production of cattle (beef and buffalo) meat. Globally, cattle meat production has more than doubled since 1961 – increasing from 28 million tonnes per year to 68 million tonnes in 2014.
The United States is the world’s largest beef and buffalo meat producer, producing 11-12 million tonnes in 2014. Other major producers are Brazil and China, followed by Argentina, Australia and India.

Global production of poultry meat has increased rapidly over the last 50 years, growing more than 12-fold between 1961-2014. Global trends in poultry production are shown in the chart.
Like cattle production, the United States is the world’s largest producer, producing more than 20 million tonnes in 2014. China and Brazil are also large poultry producers at 18 and 13 million tonnes, respectively. Collectively, Europe is also a major poultry producer with an ouput in 2014 of approximately 19 million tonnes – just below output of the United States.

Since 1961, global pigmeat production has grown 4-5 fold to 112 million tonnes in 2014.
China dominates global output, producing just short of half of total pigmeat in 2014. Increases in Chinese pigmeat production have been rapid, growing around 35-fold from 1.5 million tonnes in 1961 to 54 million tonnes in 2014. The other major producers include the United States, Germany and Spain and Brazil.

Which countries eat the most meat?
Global population has undergone rapid growth, especially in the second half of the 20th century; we may therefore also expect the rapid growth in total meat production as explored in the sections above. But how has meat consumption changed on a per capita basis?
In the chart we see a global map of per capita meat (excluding seafood and fish) consumption, measured in kilograms per person per year. These trends can also be viewed as a time-series in the “chart” tab. As a global average, per capita meat consumption has increased approximately 20 kilograms since 1961; the average person consumed around 43 kilograms of meat in 2014. This increase in per capita meat trends means total meat production has been growing at a much faster than the rate of population growth.
The direction and rate of change across countries has highly variable. Growth in per capita meat consumption has been most marked in countries who have underwent a strong economic transition – per capita consumption in China has grown approximately 15-fold since 1961; rates in Brazil have nearly quadrupled. The major exception to this pattern has been India: dominant lactovegetarian preferences mean per capita meat consumption in 2013 was almost exactly the same as in 1961 at less than 4 kilograms per person.1
Meat consumption is highest across high-income countries (with the largest meat-eaters in Australia, consuming around 116 kilograms per person in 2013). The average European and North American consumes nearly 80 kilograms and more than 110 kilograms, respectively. However, changes in consumption in high-income countries have been much slower – with most stagnating or even decreasing over the last 50 years.
Consumption trends across Africa are varied; some countries consume as low as 10 kilograms per person, around half of the continental average. Higher-income nations such as South Africa consume between 60-70 kilograms per person.

Meat consumption tends to rise as we get richer
One of the strongest determinants of how much meat people eat is how rich they are. This is at least true when we make cross-country comparisons.
In the scatterplot we see the relationship between per capita meat supply (on the y-axis) and average GDP per capita (on the x-axis). What we see is a strong positive relationship: the richer a country is, the more meat the average person typically eats.
If you press ‘play’ on the interactive chart you can see the trajectory of each country over time. Overall, countries tend to shift upwards and to the right: getting richer and eating more meat.

What types of meat do people eat?
What preferences do we have in terms of the types of meat we eat? As a global average, per capita consumption of pigmeat is the highest of meat commodities; in 2013 the average person consumed around 16 kilograms of pigmeat; followed by 15 kilograms of poultry; 9 kilograms of beef/buffalo meat; 2 kilograms of mutton & goat; and only a fraction of other meat types.
Consumption trends vary significantly across the world. In China, pigmeat accounts for around two-thirds of per capita meat consumption. In Argentina, beef and buffalo meat dominates, accounting for more than half of consumption. New Zealanders have a much stronger preference for mutton & goat meat relative to the global average.
In the charts here we see the per capita consumption of different meat types by country.


The visualization details the total number of livestock animals slaughtered for meat in the given year.
This is shown across various types of livestock. Here these figures represent the total number slaughtered for meat production (which does not include those use primarily for dairy or egg production which are not eventually used for meat).
In 2018, an estimated 69 billion chickens; 1.5 billion pigs; 656 million turkeys; 574 million sheep; 479 million goats; and 302 million cattle were killed for meat production.

The figures represent ‘livestock counts’ — these represent the total number of live animals at a given time in any year. This is not to be confused with figures above which represent the total number of livestock animals slaughtered or used for meat in any given year.


Milk production across the world

Per capita milk consumption

Total egg production

Per capita egg consumption


The UN Food and Agricultural Organization (FAO) prepare ‘Food Balance Sheets’ (FBS) across all food commodities at global, regional and national levels. Food Balance Sheets map the quantity of food commodities (measured as their primary equivalents, for example, “wheat and products” represents the sum of all products derived from wheat) from the production level through to the remaining quantity left for human food. This is measured in mass quantities – such as tonnes or kilograms.
These sheets account for losses and allocations in the food system, including imports, exports, stock variations, seed, animal feed, other (industrial uses), and food losses. The remaining commodities after correction for these diversions is defined as ‘food supply’. To derive the average per capita food supply, this total figure is divided by the population size. This figure can be considered to be the average level of food intake however it does not account for food wastage at the consumer level (i.e. in households or restaurants).
Conversion ratios or conversion efficiency are used to measure the ratio of feed inputs (either in the form of food crops, or pasture/grazing land) to output in the form of food product.2
Feed conversion ratio (FCR) is used to measure the mass quantity of feed required to produce one kilogram of animal product (e.g. meat). For example, on average, we have to feed cattle 25 kilograms of feed to produce one kilogram of beef or buffalo meat – this would give us an FCR value of 0.04 (calculated as output (1 kilogram) / input (25 kilograms).
Protein and energy efficiency are calculated as the quantity of protein/energy in animal feed which are effectively converted into protein/energy in the resultant animal products. For example, if we feed a chicken 500 grams of protein and only get 100 grams out in chicken meat, we define this protein conversion efficiency as 20 percent (calculated as output (100 grams) / input (500 grams)). The same calculation process applies for energy conversion efficiency using caloric inputs and outputs.
Environmental footprints, such as those defined as land use requirements or greenhouse gas emissions per unit mass, protein or calorie of food products are calculated using a process called life-cycle analysis (LCA). LCA methods are used to try to fully capture all environmental impacts across the value chain, and can include those up and downstream of production.
Standard food footprints – and those referenced in this entry – often set boundary conditions called ‘cradle-to-farmgate’ which means that all impacts in terms of pre-farm and on-farm activities are included.3
This includes food chain inputs such as fertilizer production and application, seed production, energy use on-farm, feed production, manure production (if used as fertilizer), manure management, farm infrastructure construction.
Life-cycle analyses (LCAs) attempt to fully quantity all such inputs necessary for the production of a food production. For example, a greenhouse gas emissions LCA for beef can include: emissions from fertilizer production, and application used for the production of animal feed; on-farm energy use associated with tilling, irrigation (if needed), transport of feed from field to livestock area, and enteric fermentation emissions produced from cattle, and barn/housing energy requirements. By deriving then summing the emissions associated with each stage and dividing by the total output (in kilograms of meat, units of protein or kilocalories), we can calculate the total emissions per unit mass/protein/kilocalorie.
- Data: Covers Production-level data in terms of kilograms of meat & seafood by type; livestock numbers and yields; and per capita food supply of animal products
- Geographical coverage: Global – by country and world region
- Time span: 1961 onwards
- Available at: Online at FAOSTAT here.
- Data: Livestock counts over the long-term
- Geographical coverage: Global, United States, Canada and continental regions
- Time span: 1890-1998
- Available at: Online here.
- Data: Capture fishery and aquaculture production and consumption data by country and species
- Geographical coverage: Global, Regional and by country
- Time span: 1961 onwards
- Available at: Online here.