The ratio between the number of males and females in a society is referred to as the gender ratio. This ratio is not stable but instead shaped by biological, social, technological, cultural, and economic forces. And in turn the gender ratio itself has an impact on society, demography, and the economy.
In this entry we provide an overview of the variation and the changes of the gender ratio across the world. We study how it changes from birth to late life; the forces that change the ratio of men to women.
Many argue persuasively that the terms ‘gender’ and ‘sex’ are not to be used interchangeably.1
In this context here we have however decided to make an exception: we speak of the ‘gender ratio’ because it’s the established term and it will help all those who want to be informed about this topic and search this term. But we also speak of the ‘sex ratio’ because this is arguably the more accurate term and it is increasingly used within the academic literature.
Summary
- The sex ratio at birth is not equal: in every country births are male-biased. There are biological reasons why there are slightly more boys born every year than girls. The ‘natural’ sex ratio at birth is around 105 boys per 100 girls (ranging from around 103 to 107 boys).
- In some countries, the sex ratio at birth is much more skewed than would occur naturally. Today and in the recent past this is particularly common across Asia and North Africa. Here there is clear evidence of gender selection through prenatal sex determination and selective abortion.
- In countries where there is a clear son preference, the sex ratio at birth becomes increasingly skewed with birth order (the third or fourth born children are more likely to be boys than the first or second child).
- In nearly every country, boys are more likely to die in childhood than girls. There are biological reasons for this: boys are more susceptible to birth complications and infectious diseases.
- In countries where there is strong son preference, mortality rates for girls are higher than would be expected: this can occur either through direct infanticide, but also through neglect and unequal treatment.
- The sex ratio tends to decrease over the life course (from becoming male-biased to female-biased). This is because women tend to live longer than men.
- It’s estimated that today there are over 130 million ‘missing women’ in the world as a result of selective abortion and excess female deaths.
- The banning of sex determination scanning and gender-selective abortion may have limited the increase in sex ratio at birth in some countries, but did not fully address the problem.
- Development can have opposing impacts on sex ratio: there is evidence that the son preference declines with education, but this often goes hand-in-hand with declining fertility rates and increased access to selective technologies (which can increase the sex ratio).
All our charts on Gender Ratio
What share of the population is male and female?
The sex ratio – the share of the population that is female – varies across the world. And globally in 2017 the share of women in the world was 49.6%.
There are three reasons why the sex ratio of populations varies and is rarely equal:
- differences in mortality rates and life expectancy for women and men. Women, on average, live longer than men. This means that all else being equal, we would expect females to account for slightly more than half of the total population.
- sex ratios at birth are not equal. In all countries, there are more male than female births (the extent of which varies by country as we will see below). This means that all else being equal, we would expect males to account for slightly more than half of the total population.
- migration can also affect the sex ratio of the population. If in some countries there is a significant amount of imported male-dominant labour, all else being equal, we would expect males to account for more than half of the total population.
The magnitude and balance of these factors determines the sex ratio of the total population.
In the map we see the sex ratio of populations: this is shown as the percentage of the total population which is female. Countries over 50 percent (shown in blue) have more females than males; those below 50 percent (shown in red) have fewer females.
Most countries have a female share of the population between 49 and 51 percent (within one percentage point of parity).
There are however a few notable outliers:
- across several countries in South and East Asia – most notably India and China – there are significantly fewer females than males. These are countries where there are large differences in sex ratio at birth.
- in several countries across the Middle East there are many more males than females: in Oman, women are outnumbered 3-to-1; in the United Arab Emirates (UAE) it’s almost 4-to-1. If we look at how this has changed over time (click on the country to see this), we see the share of the population that is female has declined from a ratio close to parity decades ago. The primary reason for this is a large male migrant stock: in 2017, 45 percent of the Oman and 88 percent of the UAE population were from immigration.2 The UN reports that only 16 and 25 percent of international migrants to Oman and UAE, respectively, were female.
- there are significantly more females than males in Eastern Europe. Populations in Eastern Europe have some of the largest gaps in life expectancy between men and women: in Russia, for example, the average life expectancy at birth was only 65 years compared to 76 years for women.

How does the sex ratio at birth vary across the world?
Across the world there are differences in the sex ratio at different life stages. This imbalance in the male and female population can in some cases be traced back to birth: in some countries the number of boys and girls born each year is significantly skewed.
In the map we see the differences in sex ratio at birth across the world. Here the sex ratio is measured as the number of male births for every 100 female births; a value greater than 100 indicates there are more boys than girls born that year. A figure of 110 would indicate that there are 110 male births for every 100 female births.
The first striking point is that in every single country of the world there are more boys born than girls. This has been true for all years for which we have data (as far back as 1962) in all countries of the world, as you can when you move the timeslider below the map further back.
Does this mean every country selects for boys prior to birth; for example, through induced abortion practices which preferentially select for boys? Not necessarily.
In the absence of selective abortion practices, births in a given population are typically male-biased – the chances of having a boy are very slightly higher than having a girl.

For most countries, there are around 105 males per 100 female births. This is what the World Health Organization (WHO) estimates as the ‘expected’ sex ratio at birth: in the absence of gender discrimination or interference we’d expect there to be around 105 boys born per 100 girls, although this can range from around 103 to 107 boys per 100 girls. Why is this?
In the most comprehensive study of its kind, Orzack et al. (2015) monitored the trajectory of sex ratio from conception through to birth across five different methods.3
This produced the largest dataset available on the sex ratio throughout the stages of pregnancy.
A key result from this study was that the sex ratio at conception is equal: there is no difference in the number of males and females conceived. For births to be consistently male-biased, there must be gender differences in the probability of miscarriage through pregnancy.
The study found that although the probability of miscarriage varies between genders across the course of a pregnancy, female mortality is slightly higher than male mortality over the full period:
- there is a higher probability that an embryo with chromosomal abnormalities4 is male – in the first week of pregnancy, excess male mortality therefore means pregnancy is female-biased;
- in the next 10-15 weeks of pregnancy female mortality is higher, which increases the ratio in favor of males;
- male and female mortality is approximately equal around week 20;
- between weeks 28-35 of pregnancy, there is higher male mortality.
Overall, a male-biased sex ratio at birth is the result.
Some male-bias in births is what we expect with no deliberate gender selection through parents or society more broadly. There are, however, some key outliers in the world today: in countries including China, India, Vietnam, Pakistan, and Azerbaijan this ratio is very skewed. Here it’s likely that deliberate selection practices explain part of the high sex ratio as we explore here.
The sex ratio varies with birth order
Most countries have a sex ratio at birth which is around the expected range of 105 boys born for every 100 girls. There are exceptions to this: there are countries – most notably in Asia – with highly skewed sex ratios in favor of males.
The preference in some countries for a son is seen in the overall sex ratio at birth figures above. But this bias is even stronger when we look at how this ratio is affected by the birth order of children.
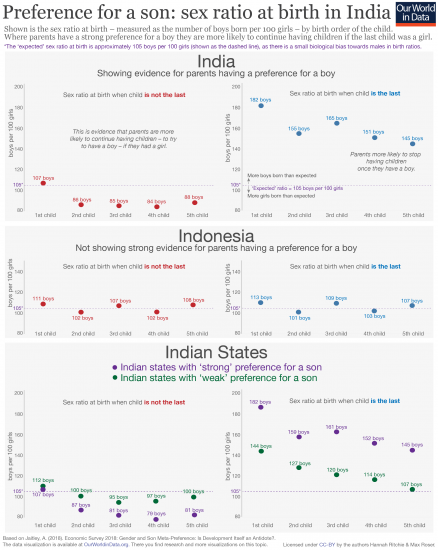
In this visualization we look at the case of India and how sex ratios change from the 1st child in a family through to the 2nd, 3rd, 4th, and 5th born children. This is adapted from the Economic Survey 20185 and based on data from the DHS and National Family Health Surveys in India. It presents this data in two cases:
- when the child is not the last child born (i.e. the parents have additional children afterwards) – this is shown in the charts on the left;
- when the child is the last child born in the family (i.e. the parents stop having children afterwards) – this is shown on the right.
Let’s first focus on the top row, which presents the data for India as a whole. On the left-hand side we have the sex ratio at birth when the child is not the last. For the 1st children, the sex ratio is very close to what we would expect ‘naturally’: a ratio of around 105 boys per 100 girls. But we see that for the 2nd, 3rd, 4th and 5th born children, this ratio is skewed towards girls. Remember again that this is the case when it’s not the last child i.e. the parents go on to have another. In other words this shows us that when a girl is born, parents are more likely to have another child. It is evidence that parents are continuing to have children until they get a son.
Compare this to the right-hand side where we see the sex ratio when the child is the last. These ratios are much more skewed towards boys. Parents whose 1st child is a son are much more likely to stop having children. The sex ratio here is 182 boys per 100 girls. This is consistent across the birth order: whether it’s the 2nd, 3rd, 4th or 5th child, a family is much more likely to stop having children when they have a boy.
Combined we see a strong preference for a son in India: parents are more likely to continue having more children when the child is a girl and they are more likely to stop having children when they have a boy.
Now compare these ratios to that of Indonesia in the second row below. Sex ratios here do not diverge strongly from the expected ratio of 105, and there is no clear difference when the child is or isn’t the last to be born. Parental choices do not point to a strong preference for a son or a daughter.
In the third row we see that within India there are large differences in son preference across different states. The data shows that there are states with ‘weaker’ and ‘stronger’ preference for a son.
From the study presented above we see that the sex of a child can, in some countries, be an important deciding factor for when parents stop having children.
But birth order also influences the likelihood of prenatal sex selection (PSS) i.e. sex-selective abortion. We see evidence of this across several countries.
Researchers looked at Indian national survey data from 1976 to 2005 to see how the sex of children and birth order affects the use of prenatal selection.6 They found a significant and increasing skew in the sex ratio since the 1980s – a time when the average woman in India had five children. This was mainly a result of male selection for the 2nd or 3rd child within a family. When the firstborn or the first- and second-born siblings were female then a boy was much more likely the 2nd or 3rd child. This skewed ratio can only be explained from prenatal sex selection in favor of boys.
At a local level, a study of a large Delhi hospital known for maternal care showed very similar results.7 The overall sex ratio was male-biased with only 806 girls per 1000 boys. But this got significantly worse when the family already had a daughter: 720 girls per 1000 boys if there was one previous girl and only 178 girls per 1000 boys for two previous daughters. Even for women who had not practiced sex-selection abortion, more mothers who had previously had a girl reported taking traditional medicines (which were ineffective) for sex selection purposes.
These examples are of course not restricted to India. Many countries across Asia in particular have similar findings. In this chart we see how the sex ratio in South Korea was affected by birth order. Here we see a very steep rise in the sex ratio of third-, fourth- and later children through the 1980s. By the early 1990s there were more than 200 boys per 100 girls for third-born children; for fourth-born or higher, the ratio was close to 250:100. This occurred at a time the number of children per woman was falling quickly: in 1970 its fertility rate was 4.3 children per woman; by 1990 this had fallen to 1.6. South Korea’s sex ratio has fallen back to close to natural levels over the past few decades.
You can also view the data for China, by using the “change country” button in the bottom-left of the chart. Clearly sex ratios in China have also been affected by birth order.8 Here we see that since 1980 –a period in the middle of a rapid reduction from 4 to 2 children per woman – there has been some rise in the male bias for first-born children (rising from the expected 105 boys to 114 boys per 100 girls). But we see a much more significant skew in the ratio for second or third-born children. For third-born children, the ratio was 158 boys per 100 girls, suggesting a high prevalence of sex selection abortions.
South Korea provides an important example where the male bias can be successfully addressed. But for several countries across Asia this looks like a major challenge: the data shows that many parents still strongly prefer a son.

Sex ratio in childhood
Sex ratios – the ratio of males and females – at birth is male-biased across every country in the world; in our section on this, we explain why biologically we’d expect this to be the case. The so-called ‘expected’ sex ratio at birth was around 105 males per 100 females. But how does this ratio look later in childhood? Does it change from newborns to five-years-olds?
In the two charts here we see two perspectives: firstly a global map of the sex ratio at five years old. Just as with the sex ratio at birth, we see the highest ratios in several Asian countries where the share of boys is higher than we would expect. In China, there is close to 117 boys per 100 girls at age five; in India, there are more than 111 boys per 100 girls.
Secondly we see a scatterplot comparison of the sex ratio at birth (on the y-axis) versus the ratio at five years old (on the x-axis). The grey line here represents parity: a country which lies along this line has the same ratio at five years old as it does for birth. As we see, most countries lie above this line: this means the sex ratio for newborns is higher than for 5-year-olds.
In other words, the male-bias tends to weaken through the first years of childhood. Why is this the case? As we explore in the next section of this entry: across most countries infant and child mortality rates are higher for boys than for girls. This means fewer boys survive the first few years of life. For most countries this results in a decline in the sex ratio.
Overall we see that despite higher child mortality in boys, the sex ratio at age five in the majority of countries is over 100: this means boys still outnumber girls in childhood.


Why do boys die more often than girls?
From life expectancy to mental health; substance use to cancer rates; there are important differences in health outcomes between the sexes. In a related post, my colleague Esteban Ortiz-Ospina looks at the evidence to answer the question “Why do women live longer than men?“
Here we focus on the youngest, asking, why do young boys die more often than girls?
Child mortality measures the share of newborns who die before reaching their 5th birthday. In the chart below we see the comparison of child mortality by sex.
Here, the mortality rate for boys is shown on the y-axis, and the mortality rate for girls on the x-axis. The grey line running diagonally across the chart marks where the mortality rate for both sexes is equal. In countries which lie above the grey line, the rate for boys is higher than for girls.
What’s striking is that with exception of two countries – India and Tonga – child mortality is more common for boys in all countries of the world. This is also true for infant mortality, which is the share of newborns who die within their 1st year of life. We study why India and Tonga are outliers here.
Over the past half-century in particular, child mortality has been falling rapidly across the world. This has been true for boys and girls alike.
It has been known for a long time that the mortality of boys is higher. As early as 1786 the physician, Dr Joseph Clarke, read a paper to the Royal Society of London on his observations that “mortality of males exceeds that of females in almost all stages of life, and particularly the earliest stages”.9

Why is it the case that boys die more often than girls? First of all, it’s important to understand what young children die from.
In this chart we see global mortality rates in infants across different causes in 2017. This data comes from the IHME’s Global Burden of Disease study, which provides estimates by sex – on the y-axis I have plotted mortality rates in boys, and on the x-axis for girls. Just like the charts above, causes which lie above the grey line are more common in boys.
The chart shows that for all major causes of death, mortality is higher in boys. The sex differences in the causes of infant deaths were already documented almost a century ago: in an impressive paper published in 1929, Bawkin explores the mortality sex ratio of specific diseases from countries across the world.10
There are some causes – HIV/AIDS, nutritional deficiencies, whooping cough, among others – for which the mortality rates are higher in girls. But overall, infant boys are more likely to die in childhood than girls.111213
Boys are more vulnerable in two key ways: they are at higher risk of birth complications, and infectious disease. We explore the possible reasons for this below.

From comparison of mortality rates in infant boys and girls, it becomes clear that boys are at higher risk of complications in the first few days of life: preterm births, asphyxia, birth defects and heart anomalies. But why?
First of all, boys are more likely to be born prematurely: the share of boys born before full-term pregnancy is higher than for girls.14 This occurs naturally, but is exacerbated by the rate of induced preterm births. Boys tend to have a higher birthweight than girls – which can increase the risk of waiting to term to deliver – meaning that more boys are induced before the end of the pregnancy term.15 The chart above shows that more boys die from preterm births. The fact that preterm births are more common for boys contributes to this.
Although boys are, on average, heavier than girls at birth, they are less physiologically mature at birth. This means they are at higher risk of having delayed physiological function (such as lung function) and adverse neurological outcomes.1617 For example, poorer lung function in newborn boys has been shown for both term and preterm infants.1819 Studies have suggested that even in the case of straightforward pregnancies, lung maturation in boys lags that of girls by approximately one week.20 These differences in maturity at birth are not restricted to lung function.21
The reason for this difference has been an important question for decades – the answer is still not clear. But there are some leading hypotheses: surfactant production for lung function has been observed earlier in female fetuses, leading to improved airway flow in the lungs; estrogen has been shown to affect lung development positively in females; males, on average, have a higher birthweight meaning they may trade-off increased size for functional development; and the uterus may be less hospitable to male fetuses – the introduction of a Y chromosome in females can create and immunoreactive response to the central nervous system.2223
This, combined with a higher risk of premature birth may explain why boys have higher rates of asphyxia, respiratory infections and birth defects.
Boys are also at higher risk of infectious diseases such as syphilis, malaria, respiratory infections, tetanus and diarrheal diseases. This is more generally true for a broad range of infections, spanning person-to-person, vector-borne, blood-borne, and food and water borne diseases.24
We see this clearly when we compare mortality rates for boys and girls in the earlier chart. But why are boys more susceptible to infection?
Overall, boys have weaker immune systems. There are two key hypotheses for why.
The Y-chromosome in boys increases their vulnerability. Biologically, males and females are differentiated by chromosomes: females have two X chromosomes (XX) and males one X and one Y chromosome (XY). Having two X chromosomes means that the newborn has a stronger immune system because X chromosomes contain a larger number of immune-related genes.2526 This means that, since females have two X chromosomes, they have a stronger immune response; boys on the other hand, are more vulnerable to X-linked infections.27
This makes males more vulnerable to many infectious diseases. They are also more susceptible to specific genetic diseases where the defective genes are carried on either the X or Y chromosomes; this is because boys have only one X chromosome so a single recessive gene on that X chromosome results in the disease.
But the stronger immune response of females comes with a cost. It’s the reason why women are more susceptible to autoimmune disorders such as HIV/AIDS.28
Sex hormones may be another key reason for weaker immune systems in males. Males have much higher amounts of testosterone which seem to inhibit two major parts of the immune system – B and T-lymphocytes.29
Estrogen, on the other hand, acts as an effective regulator of this. Overall, male hormones weaken the immune system relative to females.
The male disadvantage
The fact that boys are more susceptible than girls to a range of health conditions is often summarized as the “male disadvantage”. This is not restricted to childhood: the female advantage carries into adulthood. It’s part of the reason why women tend to live longer than men.
The leading explanations for the “male disadvantage” lie in the biological differences between the sexes. More specifically, differences in maturity, sex chromosomes, and hormones.
In circumstances where both sexes are treated equally, we would therefore expect infant and child mortality rates to be slightly higher for boys.
Sex ratio through adulthood
The sex ratio – the number of males relative to females – at birth and in childhood are male-biased in almost every country.
In previous discussion we covered why we’d expected this to be the case biologically.
How does the sex ratio change throughout adulthood?
In this chart we see the sex ratio – measured as the number of males per 100 females – at different ages through adolescence and adulthood.
In the global average for adolescents and young adults we see the result of both the male-bias in birth ratios and the large impact of populous countries such as China and India with very skewed sex ratios: At age 15 and 20, males outnumber females by 106 to 100.
But as we move through adulthood we see that this ratio is lower and lower. For 50-year-olds the ratio is close to 1-to-1; for 70-year-olds there are only 89 males per 100 females; and in the very oldest age bracket (100-year-olds) there are only 25 men per 100 women.
You can explore this data for any country of region of the world using the “change country” button in the bottom-left of the chart. You will see that for some countries this decline in the sex ratio with age is even more extreme: in Russia, for example, by age 50 there are only 88 males per 100 females; by 70 years old there are almost twice as many women as men.
In every country in the world women tend to live longer than men. Whilst this is true today, it hasn’t always been the case. In his text ‘Why do women live longer than men?‘ my colleague Esteban takes a look at the evidence and explanations for why this is the case.

Why do women live longer than men?
On average, women live longer than men – this is true for every country in the world. This fact plays an important role in how the sex ratio changes with age through adulthood.
A detailed discussion of why this is the case is available in our explainer on ‘Why do women live longer than men?‘.
Biology or discrimination: which countries have skewed sex ratios at birth?
Today, and at several points historically, the sex ratio at birth in some countries is too skewed to be explained by biological differences alone. The ‘expected’ sex ratio at birth is around 105 males per 100 females.
In a recent study Chao et. al (2019) re-modelled sex ratios at birth (SRB) across the world based on a range of population sources, including census and household survey data.30 The results are shown in the chart below since 1950. The authors identified 12 countries with strong statistical evidence of a skewed sex ratio: Albania, Armenia, Azerbaijan, China, Georgia, Hong Kong, India, Montenegro, South Korea, Taiwan, Tunisia, and Vietnam.31
Most of these countries are in Asia. Why is this the case? Is there a biological or environmental difference, or is it the result of discrimination?
Hepatitis B was proposed then later debunked
Amartya Sen was the first scholars to publicly bring attention to the concept of “missing women” as a result of sex selective abortion, unequal treatment and infanticide of girls.32
The reason for this skew in sex ratio has been previously challenged. One of the leading hypotheses was put forward by economist Emily Oster. In a 2005 paper she argued that a large proportion – approximately 45%, around 75% in China, 20-50% in Egypt and western Asia, and under 20% in India, Bangladesh, Pakistan, and Nepal – of the overrepresentation of men could be explained by the high rates of hepatitis B carriers in Asia.33 The rationale was that (1) hepatitis B carriers have an offspring sex ratio much more in favour of boys (1.5 boys per girl), and (2) that hepatitis B carrier rates were notably higher in Asian cultures than in the West. The combination of these two observations Oster calculated could account for a large proportion of the “missing women”.
A few years later, Oster debunked her own hypothesis on the role of hepatitis B in a paper titled “Hepatitis B does not explain male-biased sex ratios in China”. In a study of 67,000 people in China – 15% of which were hepatitis B carriers – Oster and colleagues found no link between hepatitis B status and offspring sex ratio.34 The hepatitis carrier status of neither the mother or the father had an effect on the offspring sex: carriers were not more likely to have a boy than non-carriers. The authors concluded that hepatitis B rates could not explain the skewed sex ratio in China.
Other studies – such as that by Lin and Luoh (2008) in Taiwan – have also found minimal to no effect of hepatitis B on the sex ratio.3536
Sex-selective abortions and discrimination against girls
After the hepatitis B hypothesis was debunked, no clear evidence of a biological factor in such skewed sex ratios has emerged. There is some variability in the “expected” sex ratio which may result from biological or environmental factors – a figure of 105 boys per 100 girls is usually adopted, but often this can vary from 103 to 107 boys per 100 girls. But the natural variability of the sex ratio is too small to explain the high ratios in some countries.
The evidence for sex-selective abortion and discrimination against girls is now strong across several countries. Not only does the increase in sex ratios coincide with the availability of prenatal sex determination technologies, there is also clear evidence from studies investigating the use and promotion of such methods.
In India, for example, prenatal diagnosis (PD) became available in the 1970s, shortly after legalization of medical abortion in 1971.37 Whilst its use was intended for detection of abnormalities, it was soon used and promoted by the Indian medical profession for sex determination.38 Even after its use for sex determination was prohibited, studies suggest many gynecologists did not consider sex-selection abortion to be unethical and argued that it was an important intervention to balance population control with the desire for sons.39
Results from some of the earliest studies on abortions following the availability of prenatal sex determination are striking. Over the year from 1976 to 1977, at an urban hospital in India, 96% of the girls who were tested were aborted; in contrast, all of the 250 boys tested – including those with an identified risk of genetic defect – were born.40 At a clinic in Mumbai, all of the 15,914 abortions after sex determination in 1984/85 were girls. Results from another six hospitals in the city found 7,999 of the 8,000 aborted fetuses in 1988 were girls.41
The evidence that highly skewed sex ratios at birth have been largely the result of gender discrimination and selective abortions has been well-established across several countries. We discuss the reasons for this discrimination here.
There are some additional hypotheses as to why the sex ratio at birth is skewed in some countries. Based on Chinese census data, Shi and Kennedy (2016) argue that the skew in China’s sex ratio is not the result of selective abortion practices, but much more the result of administrative anomalies.42 The authors argue that the one-child policy led some parents to postpone the registration of daughters (making them appear “missing”), but that they appear later in Chinese census data. A year later, Cai (2017) challenged the authors’ conclusions in support of the conventional hypothesis that this is not a statistical artefact, but a real demographic and social challenge.43

Infanticide
Sex discrimination can occur prenatally (in the form of sex-selective abortions, as we discuss here) or postnatally when it can lead to the death of a child in the very worst cases. The death of a child due to sex discrimination can be brought about in a deliberate killing of an infant (infanticide) or can be caused by neglect or poor and unequal treatment.
Over time, prenatal discrimination has increased as both abortions and sex determination technologies have become more readily available. Nonetheless, postnatal discrimination still occurs and has a long history.
Infanticide (or infant homicide) – the deliberate killing of newborns and infants – has a long history.4445 From hunter-gatherers to ancient civilizations to the present day: infanticide has spanned all periods of history. In fact, anthropologist Laila Williamson goes as far to say: “Infanticide has been practiced on every continent and by people on every level of cultural complexity, from hunter gatherers to high civilizations, including our own ancestors. Rather than being an exception, then, it has been the rule.”46
And humans are not alone. From birds to rodents; fish to mammals; we find evidence of infanticide across the animal kingdom.47
There are some common misconceptions today surrounding the practice of infanticide. Although the term is now often adopted as a synonym for ‘female infanticide’ – the killing of unwanted girls – the gender specifics and drivers of infanticide depend on context and time in history.48
A number of researchers have studied the demographic, health and cultural profiles of prehistoric societies. In rare cases they can use indirect evidence of the fossil record; but many rely on modern hunter-gatherer societies today.49
Estimates for infanticide in prehistoric societies are very high. Using recent hunter-gatherer societies as a proxy, some studies suggest anywhere from 15% to 50% of newborns were killed in the first year of life.50 Other estimates are lower, but still very high: in the range of 15-20%.51
Hill & Walker (2007) looked at the demographic profiles, death rates and causes of death of recent hunter-gatherers: the Hiwi group of Venezuela. They did this using census and interviews gathered over a seven year period.52 They found very high rates of infant death from violence. Infant mortality rates in the past were very high – most studies suggest around a quarter of newborns did not survive the first year of life. In the Hiwi hunter-gatherers, researchers found homicide to be the second largest cause of death, accounting for 30%. They also found large sex differences: infanticide rates were four times higher for girls than boys.
Other studies of modern hunter-gatherer societies analysed the sex ratio of infants to estimate the prevalence of infanticide. Very skewed sex ratio of infants is suggestive of select infanticide. In studying 86 hunter-gatherer bands across North America, South America, Africa, Asia and Australia, researchers found high levels of female infanticide across 77 of them.53
This is shown in the table, where there were many more young males than females in bands where infanticide was reported as ‘common’ or ‘occasional’.
The practice of infanticide was not just common in prehistoric societies, but was also very common in many – but not all – ancient cultures.54 Evidence for this exists either in the form of preserved burial remains, documented records or writings suggestive of the practice.55
| Infanticide reported as: | Youth sex ratio (males per 100 females) | Adult sex ratio (males per 100 females) | Number of hunter-gathering bands |
|---|---|---|---|
| Common | 138 | 105 | 71 |
| Occasional | 138 | 80 | 6 |
| Not common | 100 | 85 | 3 |
| Not practised | 94 | 83 | 6 |
It’s a common assumption that infanticide relates only to female infanticide: the killing of unwanted girls.56 But the role or direction of gender discrimination – either towards boys or girls – is context-dependent.57
Sometimes here is no clear gender discrimination, and it occurs for both sexes.
There is of course significant evidence of female-selective infanticide throughout history: we see that in the sex ratio of many hunter-gatherer societies above through to skewed ratios in Medieval England.58 Evidence of male-selective infanticide is rarer, but does exist: in a sample of 93 preindustrial culture, 9 showed evidence of female-selective, while 1 showed male-selective infanticide.59
Even today, cases on infanticide still exist, despite being outlawed in most countries.60 Infanticide occurs in Western countries: in some (such as the United States) boys make up a higher share of infant homicides.61 But the most widely prevalent – and selection that has a significant impact on gender ratio – is female infanticide. This remains reported across countries with a strong son preference: India and China are the most documented examples.6263
Infanticide is the most direct case of postnatal sex selection. More often overlooked is the excess mortality which results from neglect and unequal treatment of girls. This is ‘excess female mortality’ is sometimes often referred to as ‘delayed infanticide’.
Excess female mortality
Poor treatment of girls results in increased mortality in childhood
In almost every country young boys are more likely to die in childhood than girls – as we explore here, there are several biological reasons for is. But this is not true in a few counties – India is one notable example today. There, girls die more often than boys.
When we compare infant (under one year old) and child (under-5s) mortality rates between boys and girls in India we see that the difference is bigger for the older age group. While infant mortality rates are approximately the same, the child mortality rate for girls is higher.
Let’s then focus on children rather than infants. In the chart here we see mortality rates for boys (on the y-axis) and girls (on the x-axis) for various causes in India. This data is shown for children aged 1-4 years old in 2017. Here we see that for many, death rates are significantly higher for girls. Some of these – hepatitis, measles or tuberculosis, for example – we expect to be higher for girls. But not for infections, respiratory and diarrheal diseases. Note also the much higher mortality rates for nutritional deficiencies and protein-energy malnutrition for girls.
Poorer health outcomes for girls across some countries – often in Asia and not restricted to India – has been well-documented.6465 Even for some countries where the child mortality rate remains higher in boys than for the girls, death rates for girls are still higher than would be expected.
Social preference for a boy has resulted in unequal treatment of young girls in a number of ways. Studies have shown in some countries:
- poorer nutrition for girls and unequal food distribution;66
- less breastfeeding from mothers for daughters than for sons;67
- lower healthcare utilization for girls;6869
- during pregnancy there is evidence of preferential treatment for boys with more antenatal visits and increased tetanus vaccinations.70
This combination of poorer nutrition and healthcare investment can result in higher mortality rates for girls, but also to excess mortality for women in later stages of life.

How many women are missing?
The term ‘missing women’ was first coined by Indian economist Amartya Sen in a 1990 article; he estimated “more than 100 million women are missing”.71
‘Missing women’ refers to the shortfall of women from the number we would expect in the absence of sex discrimination. It is the sum of women who are missing at birth (as a result of sex-selective prenatal practices such as abortion) and excess female mortality later in life (either through infanticide, child neglect or maltreatment).
Many researchers have tried to calculate the number of missing women. Using sex ratios at birth, and at different ages we can compare the observed and expected values: the difference is then defined as girls and women who are missing.
There are very obvious challenges in calculating this figure. For the observed sex ratio, there is the concern of how accurate the reported number of births, males and females are. The other major issue is knowing exactly what the baseline/expected ratio of males to females would be at each stage in life. For example, the ‘expected’ sex ratio at birth is quoted as 105 male births per 100 female births. But through time and across the world, this can often vary between 103 to 107 male births per 100 female births. The combination of these measurement issues means any estimate of the number of missing women will come with fairly high uncertainty.
In the table here we provide a summary of a range of estimates – note here that the year of the estimate is different for each. Here we see that although there is significant uncertainty in these estimates, all are within the range of over 50 million by 1990, and likely upwards of 100 million today.
In the chart we see some of the most recent estimates of missing women from 1970 through to 2015 from Bongaarts & Guilmoto (2015).72 In 1970 the researchers estimated there were 61 million missing women; by 2015, 136 million. This is more than the population of Mexico. We see that more than 80% are missing from China and India – 68 and 45 million, respectively.
The authors also provided projections of the number of missing women through demographic changes to 2050 which you find here.
| Source | Year estimate is for | Number of missing women |
|---|---|---|
| Sen (1990, 1992) | 1990 | More than 100 million |
| Coale (1991) | 1990 | 60 million |
| Klasen (1994) | 1990 | 92 million |
| Klasen and Wink (2002) | 1990s | 102 million |
| Hudson & Den Boer (2004) | 2000s | 90 million |
| Guilmoto (2012) | 2010 | 117 million |
| Bongaarts & Guilmoto (2015) | 2015 | 136 million |

Above are estimates of the total number of missing women in the world. But how many are ‘missing’ each year?
In this chart we see estimates of (1) the number of ‘missing’ female births from prenatal sex discrimination; and (2) excess female deaths as a result of postnatal discrimination.73
3.3 million women is the estimate fo 2015 – approximately half of which were missing births and half of which are attributed to excess female mortality. After the 1970s sex-selective abortions (shown as missing births) became more common. Until 1980, nearly all missing women were the result of excess female mortality; by 2015 as many were from missing births each year.

In countries where there is a clear imbalance in sex ratio, there’s preference for a boy. But why does this preference exist?
Son preference is most common in countries across East and South Asia, but also in some countries in the Middle East and North Africa.74 Although there are significant cultural, economic and societal differences between these countries there are important parallels which explain strong preference for a boy.
What these countries tend to have in common is a strong logic of ‘patrilineality’: the logic that productive assets move through the male line within the family.75 Although many other countries also have patrilineality to some degree, in countries with a strong preference for a son, researchers find this logic to be much more rigid. The social order of families resides with the males: lineage is passed from father to son. Men within the social order are the fixed points, and women the moving points: when a daughter marries, she leaves the current family to join a new one.
This can produce economic and social benefits to having a son rather than a daughter, including:
- Family name: the lineage within a family stays within the male line. Having a son therefore continues the family name.
- Old age support: sons within a family are often responsible for supporting parents in illness and old age.76 Elderly parents often live with married children and overwhelmingly so with their sons. This provides a strong economic incentive for a son for old age support. It’s a key differentiating factor between countries with and without strong son preference: in Taiwan, it’s rare for parents to live with a married daughter, but in the Philippines (without strong son preference) parents are equally likely to live with the son or daughter.77
- Dowries: a dowry – the transfer of property or money from the bride’s to the groom’s family – is an important economic concern for having a daughter. Studies in India have suggested that a dowry is the most common reason for not wanting a girl.78 Even when parents themselves didn’t have a dowry in their own marriage, many carry the expectation of having to provide one for a daughter, or asking for one from a future daughter-in-law.
- Labor force opportunities: males can bring better economic opportunities for a family. This can be the result of real sex differences in economic opportunities, but also results from undervaluing the work of women. In many countries, unpaid or informal work accounts for a majority share of female employment. In this sense, informal employment is often seen simply as an extension of a women’s domestic work rather than being valued in its own right.79
- Family and societal pressure: it’s not just economic concerns that parents worry about: surveys also reveal persistent pressures from family members and communities. In interviews, women often note pressures from female in-laws and husbands, verbal and physical abuse when they didn’t produce a son or were pregnant with a girl.80
- Religion: in some cultures it’s believed that only a son can light the funeral pyre and carry out death-related rites and rituals needed for salvation.81
Across several countries in Asia, and North Africa we see highly skewed sex ratios in favour of males. Strong preference for sons has led to an increasing number of “missing women” and therefore an “excess of males”.
There are a number of adverse consequences which could result from highly imbalanced numbers of men and women in society. These present a risk to men, women, family structures and society as a whole.
The obvious consequence of gender imbalance is a large number of unmarriageable men.82 A lack of women of marriageable age could have several impacts on marriage dynamics for men:83
- many men will have to delay marriage;
- this will have a knock-on impact on younger men: not only will they be impacted by a skewed sex ratio for their generation, but will also have a ‘backlog’ of men from the previous generation in the ‘marriage market’;
- a significant number of men will have to forego marriage altogether;
- the poorest men will likely be most highly impacted by this – it’s hypothesised that women will “marry up” in society, leaving the men with least resources disproportionately affected;
- one of the most common reasons for son preference is for family lineage (the passing down of the family name through males in the family) – this will likely not occur in families where sons do not marry.
Whilst we might assume that this dynamic would favour women, they could also suffer negative consequences:
- a women’s value may be increasingly lie in her role as a wife, daughter-in-law or mother. This may deny her alternative pathways, such as remaining single or becoming more career-oriented;
- women may feel increased pressure or incentives to marry or have children earlier in life (possibly closing off different economic or labour opportunities);
- women may be at increased risk of violence (emotional, sexual or physical) or trafficking.84
Imbalanced gender ratios could have negative consequences for both men and women. For society more broadly, there are several hypotheses that it will also result in more crime, violence and disorder in communities. The rationale being that not only will there be an excess of men who do not marry and have their own family, but that the most affected will be those of lowest socioeconomic status, the most uneducated and with fewer opportunities.
Hudson and De Boer (2004) propose that this situation will result in significant social stability and security concerns.85 Although studies have found correlation between the prevalence of violence and more imbalanced gender ratios, it’s difficult to disentangle a causal effect.86 Other researchers suggest that the evidence does not support this concern: that rather than showing through aggression and violence, excluded men will be more marginalised, lonely and at risk of psychological problems.87 What’s clear is that the persistence of imbalanced sex ratios means there will be demographic consequences for many decades to come.
Are richer and more educated parents less likely to have gender preference?
If our aim is to address the issue of a skewed sex ratio and female discrimination, an obvious question to ask is: will development fix the problem? Is it the case that son preference is restricted to those at lower incomes, therefore the problem disappear if poverty falls and societies develop?
The evidence to date suggests, no: development on its own does not address it.
Studies which have looked in detail at the extent of sex ratio imbalances by demographic (comparing income level, education, literacy, employment factors amongst others) often conclude the opposite: that richer, urban families tend to discriminate more than the poor.88 For example, in North India higher castes (who tend to be richer) had more skewed sex ratios than lower castes.89 Narrowing in on specific districts and household in India and South Korea suggested that it is richer families who show greater discrimination.90
Despite rising incomes and development across many countries in Asia, North Africa and Eastern Europe, the sex ratio got worse, not better. An important driver which may link the increase in sex ratio with development and rising incomes is fertility rates. As we show in our entry on fertility rates, there is a very strong impact of improving development and falling fertility. And falling fertility rates in turn play a key role in exacerbating gender preference. This is often called the ‘fertility squeeze’.
In smaller families, you’re less likely to have a son by chance
Imagine you have five or six children: there’s a very high chance that at least one of them will be a boy. For five children, there’s around a 98% chance you’ll have a son.91 Now imagine you have only one or two children: the likelihood you have a son is much smaller. If you have only one child, you’re chances of having a son are just over half (52%); if you have two children, the odds are 77%.92
In many countries across the world, this transition happened: in India, average fertility rates fell from almost 6 to 2.3 children per woman; in China from over 6 down to 1.6 children; in South Korea from over 6 to close to only one child per woman. As countries got richer; education levels increased; women gained more rights to education labour participation and healthcare decisions; fertility rates fell rapidly.
But the result is that if you really want a son, your chances of having one naturally are now much lower. For parents of fewer children with a strong son preference, a sex-selective abortion becomes therefore a much more important option.
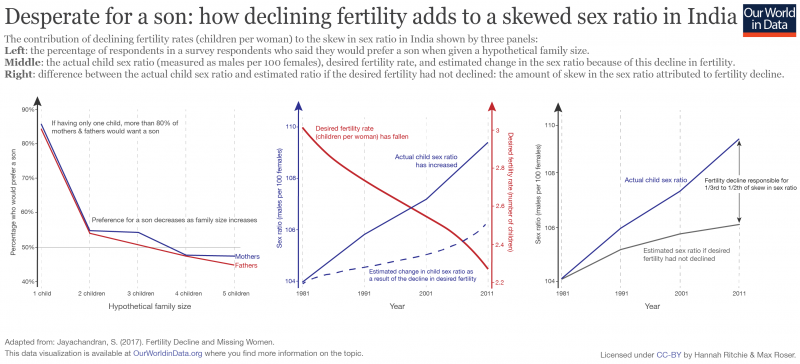
Seema Jayachandran (2017) tried to quantify how much of the skew in sex ratio in India might be attributed to the decline of the fertility rate in the country.93 In this visualization we summarize results from this research, through three charts:
- Left chart: we see the percentage of respondents of a survey in India who said they would prefer a son when given a hypothetical family size (number of children) from one to five i.e. having only one child; two children etc.94 Here we see that if they were having only one child, more than 80% of both mothers and fathers would prefer a son. This preference rapidly declines when they are asked about additional children; in fact, in the scenarios in which parents already have some sons parents preferred to have daughters.95 These results suggest that parents have a very strong preference to have a son if they have a small family.
- Middle chart: in red we see that the desired fertility rate – the number of children a woman desires to have – has declined in India in recent decades. At the same time, the child sex ratio – the number of males per 100 females – increased. The dashed line here shows the estimated change in sex ratio which results from falling fertility rates alone.
- Right chart: the blue line shows how the child sex ratio has increased over time. Shown in grey is the estimated increase in the sex ratio which can be attributed solely to the decline in fertility rates.
Seema Jayachandran (2017) results suggest that between one-third and one-half of the change in sex ratio in India since 1981 can be attributed to the decline in fertility rates. Or in other words: If there had been no change in fertility rates over time, there would still be a skew in the sex ratio. But fertility declines have had a significant impact on exacerbating son preference.
Disentangling a clear relationship between development and changes in the sex ratio is difficult because better education and rising incomes can impact aspects of gender selection in opposing ways.
The reason is that the skewed sex ratio not only the result from the gender preference alone, but crucially also the ability to act upon it – by having a sex-selective abortion, for example. Kashyap and Villavicencio (2016) suggest that sex-selection practices result from three conditions being met:96
- willingness to consider sex selection because you have a gender preference;
- ability to act upon it through access to prenatal sex-determination screening and abortion services;
- readiness to act upon it to get the desired sex preferences within the family.
How these three conditions change with development, education, and rising incomes can be in conflict. For example, research results suggest that higher education of the parents means a lower preference for a son.97 But, increased education is also associated with falling fertility rates and this decline in fertility (the ‘fertility squeeze’) increases son preference, as we explored above. Education therefore has two counteracting effects on the sex ratio: education decreases the willingness for gender preference, but increases the readiness for influencing sex preferences within the family.
Development also affects condition (2): the ability to act upon gender preference. It is often the case that richer, urban families have greater access to technologies which would allow for sex identification during pregnancy, and also a safer abortion. Poorer families in rural areas may not have this opportunity, despite having strong son preference. As they get richer, these opportunities may become available to them.
Kashyap and Villavicencio (2017) tried to model how the changes in willingness, ability, and readiness all affect the change in sex ratio in specific countries.98 They found that even very low levels of son preference can have a significant impact on the sex ratio if sex-selection technology diffuses steadily and fertility declines quickly. This means that in contexts where economic development is fast – meaning fertility rates fall quickly and prenatal screening technologies become widely accessible – even very small levels of son preference across a population can have a significant impact on the overall sex ratio.
The relationship between development and sex ratio is complex and non-linear: what’s clear is that the issue does not quickly disappear through economic development alone.
Does banning prenatal practices reduce sex-selective abortion?
One of the three conditions for sex-selection is the ability to act upon gender practices through access to technology.
Prenatal sex selection (PSS) relies on two technologies: prenatal sex determination (the ability to determine the sex of a foetus during pregnancy) and selective abortion.
This raises the question of whether policies that aim to regulate prenatal sex determination and abortion have an impact on the prevalence of sex selection.
Several governments limited prenatal sex selection through regulation when it became clear that sex selection was common and increasing. South Korea, China and India all implemented sex-selective abortion bans. Were they successful?
Much of the literature on the topic suggests the bans alone were not effective enough to address the problem.99100
Looking at how the sex ratio at birth changed pre- and post-ban in each country also does not suggest that they were very effective. South Korea enacted a ban on prenatal sex identification in 1987/88. At this point the sex ratio at birth was around 110 male per 100 female births – as we see in the chart here. Following the introduction of the ban, the sex ratio continued to increase – reaching over 115 males per 100 female births in 1990 and maintaining a high ratio through the early 1990s.
For China the evidence is similar. in 1994 – as part of its Law on Maternal and Infant Health Care – China introduced a ban of prenatal sex determination. As we see in this chart, the sex ratio at birth continued to increase after the introduction of the ban. In 1993 the ratio was 114 male per 100 female births; by the early 2000s this had increased to 118:100.
India introduced the Pre-Conception and Pre-Natal Diagnostic Techniques Act (PNDT) in 1994 which prohibited sex selection practices, including pre-screening to determine the sex of a fetus. In the decade which followed the introduction of the act, the sex ratio at birth did not improve.
At first glance, this would suggest that the banning of sex-selection practices was unsuccessful. The sex ratio continued to increase after their implementation.
Whilst researchers agree that bans alone were not effective enough to stop the practice, many acknowledge that we don’t know the counterfactual scenario without a ban.101 Without a ban the sex ratio might have increased even further. Some studies have argued that bans were effective in preventing a worsening of gender imbalance, even if they didn’t reduce it.102
These policies may have had some impact on reducing the increase, but they clearly did not come close to ending the practice.
Sex ratio at birth: the number of males born per 100 females.
‘Expected’ sex ratio at birth: the expected sex ratio at birth is not completely equal: under ordinary circumstances we would expect there to be slightly more boys born than girls. This means that in all countries, births are male-biased. The expected sex ratio is approximately 105 boys born per 100 girls. This is the ‘natural’ sex ratio reported by the World Health Organization (WHO). There can be some variability in this expected ratio, ranging from around 102 to 107 boys per 100 girls. Having a male-biased sex ratio at birth therefore doesn’t necessarily represent gender discrimination, although much more skewed ratios (above 107 boys per 100 girls) does suggest the use of gender selection practices.
Prenatal sex selection: prenatal sex selection practices are those which are used to discriminate based on gender during a woman’s pregnancy. This requires the use of prenatal screening practices which can determine the sex of the fetus – this is often referred to as prenatal detection (PD). This is followed by abortion in the case that it isn’t the desired sex.
Postnatal sex selection: postnatal sex selection is the discrimination based on gender after the child has been born. Postnatal sex selection can occur either directly through selective infanticide, or indirectly from the premature death of girls due to maltreatment, neglect or unequal treatment.
Infanticide: infanticide (or infant homicide) is the intentional killing of infants.
- Data Source: UN Population Division (2017 Revision)
- Description of available measures:
- Population, by Five-Year Age Group and Sex
- Population Sex Ratio (males per 100 females)
- Sex ratio at birth
- Time span: 1950-2100
- Geographical coverage: Global, by country
- Link: https://esa.un.org/unpd/wpp/Download/Standard/Population/
- Data Source: World Bank – World Development Indicators
- Description of available measures:
- Population female (% of total)
- Sex ratio at birth
- Child mortality, by sex
- Time span: 1962-2017
- Geographical coverage: Global, by country
- Link: http://data.worldbank.org/data-catalog/world-development-indicators
- Data Source: Chao, F., Gerland, P., Cook, A.R., Alkema, L. (2019). Systematic assessment of the sex ratio at birth for all countries and estimation of national imbalances and regional reference levels. PNAS.
- Description of available measures:
- Sex ratio at birth (modelled estimates)
- Time span: 1950-2017
- Geographical coverage: Global, by country
- Link: https://www.pnas.org/content/early/2019/04/09/1812593116