Indoor air pollution is caused by burning solid fuel sources – such as firewood, crop waste, and dung – for cooking and heating.
The burning of such fuels, particularly in poor households, results in air pollution that leads to respiratory diseases which can result in premature death. The WHO calls indoor air pollution “the world’s largest single environmental health risk.”1
Summary
- Indoor air pollution is a leading risk factor for premature death. The IHME estimates it’s responsible for 1.6 million deaths each year. The WHO puts this figure at 4.3 million.
- 6% of deaths in low-income countries are attributed to indoor air pollution.
- Death rates from air pollution are highest in low-income countries. There’s a greater than 1000-fold difference between low- and high-income countries.
- The world is making progress: global deaths from indoor air pollution have declined by more than one million per year since 1990.
- Death rates from indoor air pollution have declined in almost every country in the world since 1990.
- Indoor air pollution results from a reliance of solid fuels for cooking.
- Only 60% of the world has access to clean fuels for cooking. This share has been steadily increasing.
- The use of solid fuels for cooking has been declining across world regions, but is still high.
All our charts on Indoor Air Pollution
Related research entries
Air pollution – in addition to indoor air pollution, outdoor air pollution is also a major global problem. In this entry we provide an overview of the data and research on both forms of air pollution.
Outdoor air pollution – attributed to 3.4 million deaths each year, outdoor air pollution is one of the world’s largest health problems. How do the health impacts of outdoor air pollution vary across the world?
Energy access – how does access to electricity and clean cooking fuels compare across the world?
Fossil fuels – how is the production and consumption of fossil fuels changing?
Causes of death – what are people across the world dying from?
Indoor air pollution is one of the world’s largest environmental problems – particularly for the poorest in the world who often do not have access to clean fuels for cooking.
The Global Burden of Disease is a major global study on the causes and risk factors for death and disease published in the medical journal The Lancet.2 These estimates of the annual number of deaths attributed to a wide range of risk factors are shown here. This chart is shown for the global total, but can be explored for any country or region using the “change country” toggle.
Indoor air pollution is a risk factor for several of the world’s leading causes of death, including heart disease, pneumonia, stroke, diabetes and lung cancer.3 In the chart we see that it is one of the leading risk factors for death globally.
According to the Global Burden of Disease study 1.6 million people died prematurely in 2017 as a result of indoor air pollution. To put this into context: this was four times the number of homicides – close to 400,000 in 2017.
Because the IHME data is more recent we rely mostly on IHME data in our work on indoor air pollution. But it’s worth noting that the WHO publishes a substantially larger number of indoor air pollution deaths. In 2018 (the latest available data) the WHO estimated 3.8 million deaths.4 We are unfortunately not aware of any detailed explanation for the large discrepancy between these two estimates.
The health impact of indoor air pollution is especially high in low-income countries. If we look at the breakdown for countries with a low sociodemographic index – ‘Low SDI’ on the interactive chart – we see that indoor air pollution is among the worst risk factors.

The Institute for Health Metrics and Evaluation (IHME) estimates that 1.6 million people died prematurely as a result of indoor air pollution in 2017. This was 3% of global deaths. In low-income countries, it accounts for 6% of deaths.
In the map here we see the share of annual deaths attributed to indoor air pollution across the world. In 2017 this ranged from a high of close to 11% in Papua New Guinea – more than 1-in-10 deaths – to less than 0.1% across most of Europe and North America.
When we compare the share of deaths attributed to indoor air pollution either over time or between countries, we are not only comparing the extent of indoor air pollution, but its severity in the context of other risk factors for death. Indoor air pollution’s share does not only depend on how many die prematurely from it, but what else people are dying from and how this is changing.
When we look at the share dying from indoor air pollution, figures are high across the lowest-income countries in Sub-Saharan Africa, but not markedly different from countries across Asia or Latin America. There, the severity of indoor air pollution – expressed as the share of deaths – has been masked by the role of other risk factors at low-incomes, such as low access to safe water, poor sanitation and unsafe sex which is a risk factor for HIV/AIDS.

Death rates from indoor air pollution give us an accurate comparison of differences in its mortality impacts between countries and over time. In contrast to the share of deaths that we studied before, death rates are not influenced by how other causes or risk factors for death are changing.
In this map we see death rates from indoor air pollution across the world. Death rates measure the number of deaths per 100,000 people in a given country or region.
What becomes clear is the large differences in death rates between countries: rates are high in lower-income countries, particularly across Sub-Saharan Africa and Asia. Rates here are often greater than 100 deaths per 100,000 – in Papua New Guinea this was over 200 per 100,000.
Compare this with death rates across high-income countries: across North America rates are below 0.1 deaths per 100,000. That’s a greater than 1000-fold difference.
The issue of indoor air pollution therefore has a clear economic split: it is a problem that has almost been entirely eliminated across high-income countries, but remains a large environmental and health problem at lower incomes.
We see this relationship clearly when we plot death rates versus income, as shown here. There is a strong negative relationship: death rates decline as countries get richer. This is also true when make this comparison between extreme poverty rates and pollution effects.

Whilst indoor air pollution is still one of the leading risk factors for mortality, and the largest risk factor at low incomes, the world has also made significant progress in recent decades.
Globally, the number of annual deaths from indoor air pollution has fallen by more than 1 million since 1990. As we see in the visualization, in 1990 an estimated 2.7 million died prematurely as a result; by 2017 this had fallen to 1.6 million.
This means that despite continued population growth in recent decades, the total number of deaths from indoor air pollution has still declined.

We have seen this progress across a large number of countries. In the scatterplot you see the comparison of the number of deaths from indoor air pollution in 1990 (shown on the y-axis) versus the number in 2017 (on the x-axis). The grey line here marks where the number of deaths would be equal in both years; countries which lie above the line had a higher number of deaths in 1990 than in 2017; and the opposite is true for countries below the line.
Most countries lie above the grey line, meaning most have seen a decline in the number of deaths from indoor air pollution in recent decades.
You can explore data on the number of deaths from indoor air pollution across the world here.

Which countries in the world have made progress on tackling indoor air pollution in recent decades? Almost all countries have.
In the scatterplot here we see the comparison between the death rate from indoor air pollution in 1990 (shown on the y-axis) versus the death rate in 2017 (on the x-axis). The grey line here marks where the number of deaths would be equal in both years; countries which lie above the line had a higher number of deaths in 1990 than in 2017; and the opposite is true for countries below the line.
Almost all countries – with the exception of Zimbabwe – lie above the grey line. This means progress has been made almost everywhere in the world in recent decades.

In 2017, 1.6 million people died prematurely as a result of indoor air pollution – 45% were aged 70 and older. This visualization shows the breakdown of deaths by age group.

Indoor air pollution results from poor access to clean cooking fuels
Indoor air pollution results from the burning of solid fuels such as crop waste, dung, charcoal and coal for cooking and heating in households. Burning these fuels produces particulate matter – a major health risk, particularly for respiratory diseases. The burning of such fuels in enclosed spaces such as small households is a major risk factor for exacerbation of these diseases.
Low-income households tend to rely on solid fuels for cooking because cleaner fuels are either unavailable or too expensive. We therefore see a strong link between death rates from indoor air pollution and access to clean fuels for cooking.
This is shown in the visualization: here we see that countries with the highest death rate from indoor air pollution are those with very low access to clean fuels (i.e. have a high dependence on solid fuels instead). As access to clean fuels and technologies increases, death rates from household air pollution begin and continue to fall.

Poorer households have a higher dependence on solid fuels
Income is a strong determinant of energy access and types of fuel sources.
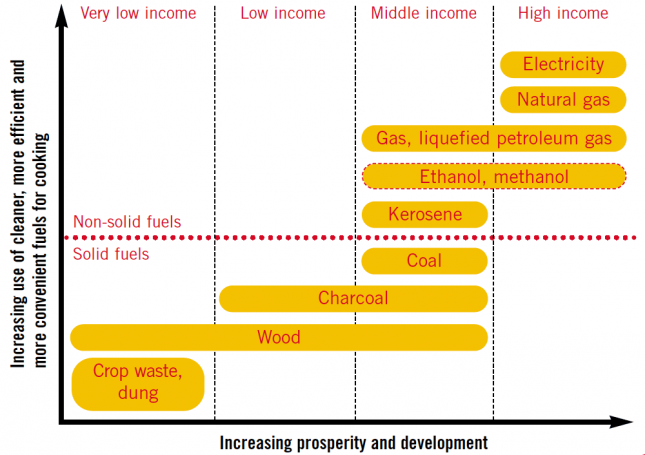
In the figure we see the World Health Organization (WHO)’s depiction of the ‘energy ladder’. It shows how the dominant source of energy changes depending on the level of income.
At low income levels households rely mostly on solid traditional fuel sources such as crop waste, dung, and firewood. As incomes rise, this energy mix tends to transition towards charcoal and coal. Only at higher income levels do households shift from the harmful solid fuels to cleaner non-solid fuels such as ethanol and natural gas. Electricity is only available for households at a high income level.
The latest data on this relationship between fuel type and income is shown in the scatterplot. It shows the percentage of households in countries around the world with access to clean fuels and technologies for cooking (on the y-axis) versus the average income in the country.
The share of households with access to clean energy in countries below a GDP per capita level of $2,000 per year is typically less than 10%. As countries begin to bridge that gap between low and middle incomes, this share begins to increase until a final transition towards high-income where the majority of households have clean fuels and technologies for cooking.

Access to clean fuels for cooking
The obvious way to avoid indoor air pollution from solid fuel burning is for households to transition from traditional ways of cooking and heating towards more modern, cleaner methods. This can, for example, be in the form of transitioning towards non-solid fuels such as natural gas, ethanol or even electric technologies.
‘Clean fuels’ are defined by emission rate targets and recommendations for and against particular fuel use in the World Health Organization’s guidelines for indoor air quality: household fuel combustion.6 The WHO recommends against the use of solid fuels, unprocessed coal and kerosene for indoor cooking since these fuels exceed its emission rate targets. The ‘clean fuels’ is recommends include biogas, ethanol, LPG, natural gas and electricity. Solar cook stoves can also be an important solution where conditions are suitable.
The map here shows the percentage of households with access to clean fuels and technologies for cooking.
Globally, access has been increasing: in 2000, 49% of households had access; by 2016 this was 60%. Still, this means access across the world remains low. Less than two-thirds of households have access to clean cooking fuels.
This share has been increasing for most countries at low-to-middle incomes, however, rates of increase vary by country and region.
Access is lowest across Sub-Saharan Africa where only 14% of households in 2016 had access. Progress has been much more significant in South Asia and East Asia over the last decade, with 18 percent and 16% of additional households gaining access, respectively.

The burning of solid fuels fills the houses and huts in poorer countries with smoke that kills the world’s poor by causing pneumonia, stroke, heart disease, chronic obstructive pulmonary disease, and lung cancer. The solid fuels responsible for this include wood, crop residues, dung, charcoal, and coal. The solution for this problem is straightforward: shift from solid fuels to modern energy sources.
The chart shows that the world is making progress in this direction. In 1980 almost two thirds of the world’s population used solid fuels for their cooking. 30 years later this is down to 41%. The chart also shows that it is a problem associated with poverty: In richer Europe and North America the share is much lower than in the rest of the world; and in the high income countries of the world the use of solid fuels is entirely a thing of the past.
The use of solid fuels is going down in all of the world’s regions. But the success rapidly developing South East Asia is particularly impressive: here the share fell from 95% to 61%.

How are deaths caused by pollution estimated?
Indoor air pollution has a wide range of negative health impacts, which can lead to morbidity but also in many cases, mortality. The table features summary data from the World Health Organization (WHO) on the extent of proven links between indoor air pollution and potential health outcomes. These health outcomes range from respiratory infections to chronic obstruction pulmonary disease (COPD) to lung cancer and have varying effects on the population depending on factors such as age and sex.
Health impacts vary in terms of the strength of evidence linking outcomes with indoor air pollution. The WHO define ‘strong evidence’ based on results from a range of studies on solid fuel using in developing countries with biochemical and laboratory evidence of health impacts; ‘moderate I’ has at least three studies showing strong evidence for specific age and sex groups; and ‘moderate II’ has at least three studies showing potential links but with more limited evidence.
The WHO suggests that the deaths caused by indoor air pollution break down as follows:7
- 27% are due to pneumonia (acute lower respiratory tract infection)
- 18% from stroke
- 27% from ischaemic heart disease
- 20% from chronic obstructive pulmonary disease (COPD)
- 8% from lung cancer.
Health impacts of indoor air pollution – WHO (2006)8
| Health outcome | Evidence | Population | Relative risk | Relative risk (95% confidence interval) | Sufficient or insufficient evidence? |
|---|---|---|---|---|---|
| Acute infections of the lower respiratory tract | Strong | Children aged 0-4 years | 2.3 | 1.9-2.7 | Sufficient |
| Chronic obstructive pulmonary disease | Strong | Women aged ≥ 30 years | 3.2 | 2.3-4.8 | Sufficient |
| Moderate I | Men aged ≥ 30 years | 1.8 | 1.0-3.2 | Sufficient | |
| Lung cancer (coal) | Strong | Women aged ≥ 30 years | 1.9 | 1.1-3.5 | Sufficient |
| Moderate I | Men aged ≥ 30 years | 1.5 | 1.0-2.5 | Sufficient | |
| Lung cancer (biomass) | Moderate II | Women aged ≥ 30 years | 1.5 | 1.0-2.1 | Insufficient |
| Asthma | Moderate II | Children aged 5-14 years | 1.6 | 1.0-2.5 | Insufficient |
| Moderate II | Adults aged ≥ 15 years | 1.2 | 1.0-1.5 | Insufficient | |
| Cataracts | Moderate II | Adults aged ≥ 15 years | 1.3 | 1.0-1.7 | Insufficient |
| Tuberculosis | Moderate II | Adults aged ≥ 15 years | 1.5 | 1.0-2.4 | Insufficient |
- Data: Number of deaths and death rates from household air pollution
- Geographical coverage: Global- by country
- Time span: 1990 onwards
- Available at: http://www.healthdata.org/results/data-visualizations
- Data: Use of solid fuels and burden of disease
- Geographical coverage: Global- by country and region
- Available at: http://apps.who.int/gho/data/node.main.133?lang=en
- Data: Household (indoor) air pollution factsheet
- Available at: http://www.who.int/features/qa/indoor-air-pollution/en/
- Data: Forestry data on wood fuel for countries and world regions since 1961.
- Geographical coverage: Global- by country
- Time span: 1990 onwards
- Available at: http://www.fao.org/faostat/en/#data/FO