Summary
- Unsafe sanitation is responsible for 775,000 deaths each year.
- 5% of deaths in low-income countries result from unsafe sanitation
- 46% of the world do not have access to safely managed sanitation.
- 6% of the world still practice open defecation.
- Unsafe sanitation has a significant impact on childhood stunting.
Unsafe sanitation is one of the world’s largest health and environmental problems – particularly for the poorest in the world.
The Global Burden of Disease is a major global study on the causes and risk factors for death and disease published in the medical journal The Lancet.1 These estimates of the annual number of deaths attributed to a wide range of risk factors are shown here. This chart is shown for the global total, but can be explored for any country or region using the “change country” toggle.
Lack of access to poor sanitation is a leading risk factor for infectious diseases, including cholera, diarrhoea, dysentery, hepatitis A, typhoid and polio.2 It also exacerbates malnutrition, and in particular, childhood stunting. In the chart we see that it ranks as a very important risk factor for death globally.
According to the Global Burden of Disease study 775,000 people died prematurely in 2017 as a result of poor sanitation. To put this into context: this was almost double the number of homicides – close to 400,000 in 2017.

An estimated 775,000 people died prematurely as a result of poor sanitation in 2017. This was 1.4% of global deaths.
In low-income countries, it accounts for 5% of deaths.
In the map here we see the share of annual deaths attributed to unsafe sanitation across the world. In 2017 this ranged from a high of close to 11% in Chad – more than 1-in-10 deaths – to less than 0.01% across most of Europe.
When we compare the share of deaths attributed to unsafe sanitation either over time or between countries, we are not only comparing the extent of sanitation, but its severity in the context of other risk factors for death. Sanitation’s share does not only depend on how many die prematurely from it, but what else people are dying from and how this is changing.

Death rates from unsafe sanitation give us an accurate comparison of differences in its mortality impacts between countries and over time. In contrast to the share of deaths that we studied before, death rates are not influenced by how other causes or risk factors for death are changing.
In this map we see death rates from unsafe sanitation across the world. Death rates measure the number of deaths per 100,000 people in a given country or region.
What becomes clear is the large differences in death rates between countries: rates are high in lower-income countries, particularly across Sub-Saharan Africa and Asia. Rates here are often greater than 50 deaths per 100,000 – in the Central African Republic and Chad this was over 120 per 100,000.
Compare this with death rates across high-income countries: across Europe rates are below 0.1 deaths per 100,000. That’s a greater than 1000-fold difference.
The issue of unsafe water is therefore one which is largely limited to low and lower-middle income countries.
We see this relationship clearly when we plot death rates versus income, as shown here. There is a strong negative relationship: death rates decline as countries get richer.

What share of people use safely managed sanitation facilities?
SDG Target 6.2 is to: “achieve access to adequate and equitable sanitation and hygiene for all and end open defecation” by 2030.
Where are we today? In 2020, just over half (54%) of the world population had access to safely managed sanitation. It is shocking that nearly one-in-two don’t. Around 6% do not have any sanitation facilities at all, and instead have to practice open defecation.
In the chart we see the breakdown of sanitation access globally, and across regions and income groups. We see that in countries at the lowest incomes, less than one-fifth of the population have safe sanitation. Much like safe drinking water, most live in Sub-Saharan Africa.
Are we making progress? The world has made progress in the last five years. But again, this has been far too slow albeit slightly faster than our progress on drinking water. In 2015 only 47% of the global population had safe sanitation. That means we’ve seen an increase of seven percentage points over five years.
The gap between where we are now and universal access is still huge. Our progress is far too slow to achieve this by 2030. If progress continues at these rates, we would only reach 68% by 2030. Almost one-third of the world would miss out. If we’re to meet our target we need almost exactly the same acceleration as our progress on drinking water: rates would need to more than triple (increase 3.3-fold) for the coming decade.3

In the map shown we see the share of people across the world that have access to safely managed sanitation.

How many people do not have access to safe sanitation?
In the map shown we see the number of people across the world that do not have access to safely managed sanitation.

What share of people do not have access to improved sanitation?
‘Improved’ sanitation is defined as facilities which ensure hygienic separation of human excreta from human contact. This includes facilities such as flush/pour flush (to piped sewer system, septic tank, pit latrine), ventilated improved pit (VIP) latrine, pit latrine with slab, and a composting toilet. Note that having access to improved sanitation facilities greatly increases the likelihood – but doesn’t guarantee – that people are use safe sanitation facilities. We look at coverage of safe sanitation here.
In 2020, 68% of the world population had access to improved sanitation facilities. This means almost one-third of people do not have access.
In the map shown we see the share of people across the world that do not have access to improved sanitation.

How many people do not have access to improved sanitation?
In the map shown we see the number of people across the world that do not have access to improved sanitation.

What share of people practice open defecation?
Open defecation refers to the defecation in the open, such as in fields, forest, bushes, open bodies of water, on beaches, in other open spaces or disposed of with solid waste. Open defecation has a number of negative health and social impacts, including the spread of infectious diseases, diarrhoea (especially in children), adverse health outcomes in pregnancy, malnutrition, as well as increased vulnerability to violence — particularly for women and girls.4
In 2020, 6% of the world’s population were still practicing open defecation.
The map shows the share of people practicing open defecation across the world.

Access to sanitation facilities increases with income
The provision of sanitation facilities tends to increase with income. In the chart we see the share of the population with access to improved sanitation versus gross domestic product (GDP) per capita.
Overall, we see a strong relationship between the two: access to improved sanitation increases as countries get richer.

Open defecation is mainly a rural issue
As we see above, rural access to improved sanitation facilities typically lags behind urban areas for most countries. Although having access to improved sanitation facilities does not necessitate open defecation (some households can have very basic or shared sanitation facilities), we also see that open defecation is predominantly a rural issue for most countries.
In the chart we see the prevalence of open defecation in rural areas versus urban areas. For the majority of countries, open defecation in urban areas is typically below 20 percent of the population. For rural populations, however, the share of the population practicing open defecation can range from less than 20 percent to almost 90 percent. Although open defecation in urban areas is still a pressing in many countries, the problem much more strongly concentrated in rural areas.

Stunting — determined as having a height which falls below the median height-for-age WHO Child Growth Standards — is a sign of chronic malnutrition.5
Although, linked to poor nutritional intake (which we cover in our entry on Hunger and Undernourishment), it is linked to a range of compounding factors, including the recurrence of infectious diseases, childhood diarrhea, and poor sanitation & hygeine.
In the chart we see the prevalence of stunting (measured as the share of children under 5-years-old defined as being more than two standard deviations below the median international height) versus the share of the population with improved sanitation facilities. Overall we see a negative correlation: rates of childhood stunting are typically higher in countries with lower access to improved sanitation facilities.

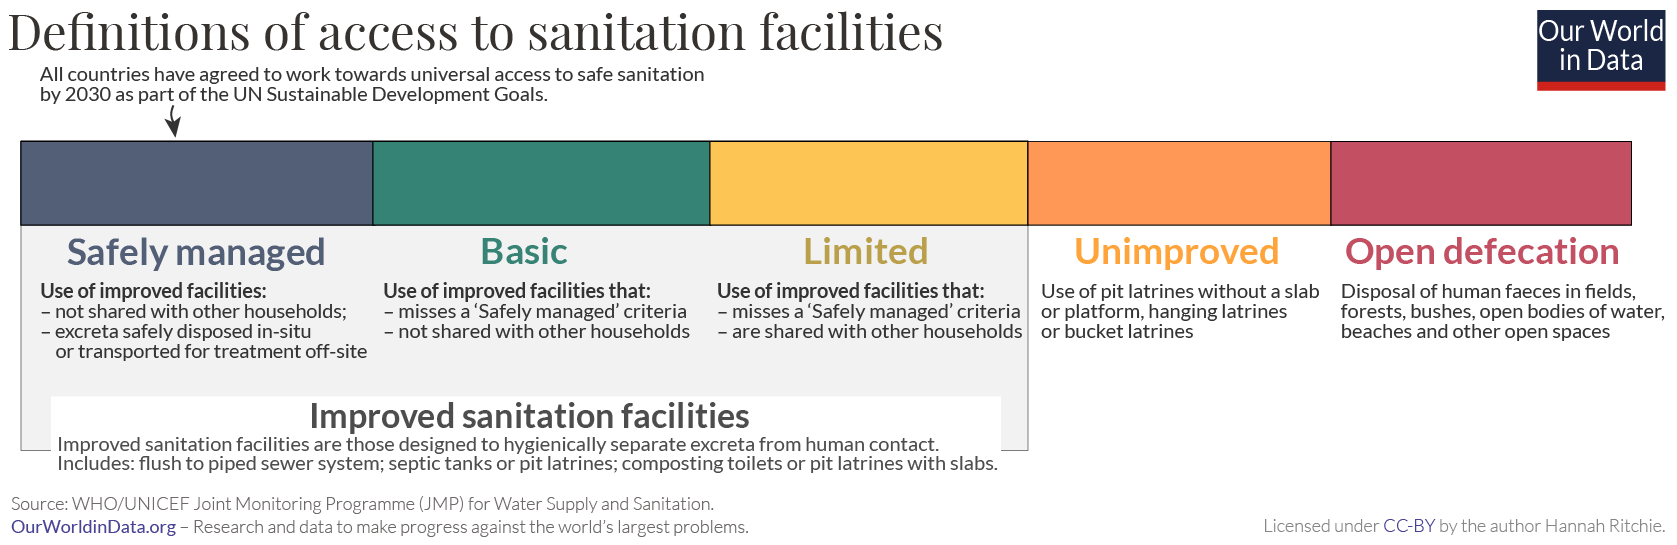
Improved sanitation facilities: “An improved sanitation facility is defined as one that hygienically separates human excreta from human contact. They include flush/pour flush (to piped sewer system, septic tank, pit latrine), ventilated improved pit (VIP) latrine, pit latrine with slab, and composting toilet.
Improved sanitation facilities range from simple but protected pit latrines to flush toilets with a sewerage connection. To be effective, facilities must be correctly constructed and properly maintained.” 6
Safely managed sanitation facilities: “Safely managed sanitation” is defined as the use of an improved sanitation facility which is not shared with other households and where:
• excreta is safely disposed in situ or
• excreta is transported and treated off-site.
The definitions of categories of sanitation facilities coverage include:
- ‘Basic service‘: Private improved facility which separates excreta from human contact;
- ‘Limited service‘: Improved facility shared with other households;
- ‘Unimproved service‘: Unimproved facility which does not separate excreta from human contact;
- ‘No service‘: open defecation.
Open defecation: “People practicing open defecation refers to the percentage of the population defecating in the open, such as in fields, forest, bushes, open bodies of water, on beaches, in other open spaces or disposed of with solid waste.”