Notice: This is only a preliminary collection of relevant material
The data and research currently presented here is a preliminary collection or relevant material. We will further develop our work on this topic in the future (to cover it in the same detail as for example our entry on World Population Growth).
If you have expertise in this area and would like to contribute, apply here to join us as a researcher.
Increases to the quantity of education – as measured for example by mean years of schooling – has, for a long time, been the central focus of policy makers and academic debate. While increasing the access to education is important, the actual goal of providing schooling is to teach skills and transfer knowledge to students in the classroom. This entry focusses on the outcomes of schooling – the quality of education.
While we have good empirical data on the access to education we know much less about the quality of education. Unfortunately, the data on the skills and knowledge of students is sparse and has limited spatial and temporal coverage. This is in part due to the difficulty and cost of creating and implementing standardized assessments that can be compared across borders and time.
Efforts to measure these outcomes are geographically more restricted (often only OECD countries are included) and even less is known about how the performance of students with respect to these outcomes has changed over time. A third limitation is that measures are sometimes not comparable between countries.
Most often these assessment are measuring learning outcomes of one or several of the following three dimensions:
- Reading and language proficiency
- Mathematics and numeracy proficiency
- Scientific knowledge and understanding
The assessments differ in respect to how children are selected. While some assessments select children by their age, there are other assessments which select children by the school grade the child attends. The aim of these studies is to test a representative random sample of the intended population.
The most widely available metric on the outcomes of education is literacy. Data and research on literacy is discussed in detail in our entry on the topic.
All our charts on Quality of Education
The PISA study
The Program for International Student Assessment (PISA) assessment, which is coordinated by the OECD, is the most well known international assessment of learning outcomes. The first PISA study was carried out in 1997 and since then it was repeated every three years.
The study is not select students by grade, but by age and only tests 15-year-olds, whatever their school level. In a two-hour assessment the competencies in reading, mathematics and science of these students are assessed. It is a very substantial undertaking and until 2017 “half a million students representing 28 million 15-year-olds in 72 countries and economies have participated in PISA” according to the OECD. The coverage of PISA can be seen in this map on the results in the reading dimension, it obviously includes the richer OECD countries and unfortunately only few poorer countries. Poorer countries are also not tested regularly and were only participating in one round only and additionally it can be the case that for poorer countries not students from the entire country were selected, but instead only from particular regions.
PISA, as well as TIMSS, are standardizing their results so that the average score of students from OECD countries is 500 and the student standard deviation is 100. Assuming a normal distribution of measurement outcomes this means 68% of OECD students are reaching scores in the range between 400 and 600.
While TIMSS focuses on content that is covered in the school curriculum PISA aims to “assesses the application of skills to real-life problems” and “emphasizes the importance of the context in which students should be able to use their skills (schools, home and society)”.
PISA tests the students in three different dimensions, which they define as follows1:
- “Science literacy is defined as the ability to engage with science-related issues, and with the ideas of science, as a reflective citizen. A scientifically literate person is willing to engage in reasoned discourse about science and technology, which requires the competencies to explain phenomena scientifically, evaluate and design scientific enquiry, and interpret data and evidence scientifically.
- Reading literacy is defined as students’ ability to understand, use, reflect on and engage with written texts in order to achieve one’s goals, develop one’s knowledge and potential, and participate in society.
- Mathematical literacy is defined as students’ capacity to formulate, employ and interpret mathematics in a variety of contexts. It includes reasoning mathematically and using mathematical concepts, procedures, facts and tools to describe, explain and predict phenomena. It assists individuals in recognising the role that mathematics plays in the world and to make the well-founded judgements and decisions needed by constructive, engaged and reflective citizens.”
Cross country comparability of the PISA results
When the PISA study includes non-OECD countries it is often the case that students are not selected from the entire country, but instead only from selected regions within that country. Results reported for China – and labelled as such by the OECD – in fact are only based on four Chinese provinces: Beijing, Shanghai, Jiangsu and Guangdong. These regions are not representative of China as a whole and there is every reason to expect that students from these provinces have access to better education than the average Chinese 15-year-olds. The four regions are among the very richest regions of China and incomes are up to twice that of the national Chines average.
Similarly when PISA reported on “India” in 2009 the assessments were made in two states of India only (Himachal Pradesh and Tamil Nadu).
Results from the PISA study
The three maps show the results for the three subjects in which students are assessed.


The distribution of PISA outcomes within countries
To describe the distribution of proficiency within countries PISA segments the achieved outcomes into levels of proficiency. To achieve higher levels, students need to be able to solve tasks of increasing complexity. The results are then reported as the share of the student population that reached each level.
The cut offs for the levels are the following:
- Below level 1B (below or equal to 262)
- level 1B (higher than 262)
- level 1A (higher than 335)
- level 2 (higher than 407)
- level 3 (higher than 480)
- level 4 (higher than 553)
- level 5 (higher than 626)
- level 6 (higher than 698)
The visualization shows the distribution of students proficiency levels in 2009, 2012, and 2015. It is possible to see the data for other countries by choosing the ‘change country’ option on the chart.

The test scores of the worst and best performing students in each country are correlated as this visualization shows. Countries in which the top students perform better than top students in other countries tend to be the same countries in which the worst students also perform better than the worst students in other countries.

As the name says, TIMSS is an assessment of the mathematics and science knowledge of students. As the closely linked PIRLS it is carried out by the International Association for the Evaluation of Educational Achievement (IEA).
While PISA selects the assessed students by age and focusses on 15-year olds, TIMMS selects students by the grade they attend and tests students in Grades 4, 8, and in their final year.
TIMSS started slightly earlier than PISA. The first TIMSS was conducted in 1995 and covered 45 national educational systems. Later rounds included more countries – the 2011 round included 77 countries/area. The coverage of TIMSS is similar to PISA and includes mostly richer countries which are part of the OECD and only few poorer countries. The coverage of TIMSS can be seen in this map on the results in the science dimension.
Precursors to TIMSS were already conducted from 1964 onwards.

The PIRLS is the other major study carried out by the International Association for the Evaluation of Educational Achievement (IEA). Here the objective is to assess primary school students in reading proficiency. PIRLS only started in 2001.

LLECE is an assessment carried out only in Latin American countries. This map shows the mathematics score of 6th graders. More information on LLECE is published by the UNESCO here.
PASEC, which in the original French refers to Programme d’ Analyse des Systèmes Educatifs, has assessed educational outcomes in 13 countries in Francophone West Africa. Here is a map of outcomes in the dimension of the French language.
EGRA and EGMA are simple, low-cost assessments of literacy and numeracy.
APRESt is a large-scale randomized evaluation in the Indian state of Andra Pradesh that has been carried out since 2004.
ASER is a report that is based on a survey of more than 500,000 children in rural areas across India. It is not a school-based, but instead an in-home assessment of the reading and mathematical skills of children between 3 and 16. The first ASER was carried out in 2005.
UWEZO is an adaptation of ASER carried out in three east African countries (Tanzania, Uganda, and Kenya). It has been done since 2009 and is carried out annually.
An assessment carried out by education ministries from fifteen southern and eastern African countries. The study assesses students in grade 6 in the domains of reading and mathematics. The first study was carried out in 1995. The studies’ website is: www.sacmeq.org
Measuring learning outcomes in a way that enables us to make comparisons across countries and time is difficult. There are several international standardised tests that try to measure learning outcomes in a systematic way across countries; but these tests are relatively new, and they tend to cover only specific geographical areas and skills.
One possible approach to learn from all these overlapping but disparate international and regional tests, is to put them on a consistent scale, and then pool them together across skills to maximize coverage across years and countries. This is exactly what Nadir Altinok, Noam Angrist and Harry Patrinos did in a new working paper: Global Data Set on Education Quality (1965–2015). They collected data from a large set of psychometrically-robust international and regional student achievement tests available since 1965, and they linked them together in a common measurement system.
Here we show some key charts using their data. You can read more about their approach and results in our blog post “Global education quality in 4 charts”.
A comparison of learning outcomes, country by country
This chart plots GDP per capita (after adjusting for differences in prices across countries and time), against average student test scores (after homogenizing and pooling international and regional student assessments across education levels and subjects). Each bubble in this chart is a country, where colours represent regions and bubble sizes denote population.
As we can see, learning outcomes tend to be much higher in richer countries; but differences across countries are very large, even among countries with similar income per capita.
The evolution of learning outcomes over time
This scatter plot compares national average learning outcomes in 1985 and 2015 (or closest years with available data).
Among these countries we see a broad positive trend: Most bubbles are above the diagonal line, which means the majority of countries have seen improvements in learning outcomes over the last couple of decades. This is a great accomplishment! It shows that policies matter and learning outcomes can, and often do improve.
The error margin on these differences is often large, so small deviations from the diagonal line are not significant.
But it is worrying that many low-performing countries are substantially below the diagonal line. Consider the comparison between Chile and Burkina Faso in the center of the chart: Both countries had similar average scores a couple of decades ago, but while Chile has improved, Burkina Faso has regressed.
You can check country by country trends over time in this line chart.
Student achievement beyond average scores
This chart shows the share of students who achieve minimum proficiency (i.e. the proportion who pass a global benchmark for minimum skills), against the share who achieve advanced proficiency (i.e. the proportion who pass a global benchmark for advanced skills).
Here we see that those countries where a larger share of students attain minimum proficiency, tend to also be countries where a larger share of students attain advanced proficiency. Better education lifts all boats.
Low-income, low-performing countries are clustered at the bottom of the global scale: the distribution of test scores within these countries is shifted down, relative to high-performing countries. The challenges are therefore much larger in these countries. Less than half of students in Sub-Saharan Africa reach the minimum global threshold of proficiency; and very, very few students achieve advanced skills.
Rich countries, on the other hand, tend to be less clustered. For example, Belgium and Canada have roughly similar average outcomes; but Canada has a higher share of students that achieve minimum proficiency, while Belgium has a larger share of students who achieve advanced proficiency. This shows that there is significant information that average scores fail to capture. The implication is that it’s not enough to focus on average outcomes to assess challenges in education quality.
You can compare achievement above minimum, intermediate, and advanced benchmarks, country by country and over time, in these three line charts:


The education economists Eric Hanushek and Ludger Wößmann combined the results from educational achievement tests to investigate the question whether the quality of education has a causal influence on the growth of the economy.2
The database the authors published – and which is available on the authors’ websites – includes measure for 77 countries. This map shows their main test score.
They extend earlier efforts by Hanushek and Kimko (2000) published in the American Economic Review.3


For African countries Sandefur (2016) constructed internationally comparable mathematics scores.4
In every country and in every year girls achieved higher PISA test scores in reading. The difference of sometimes more than 50 points is substantial as the test scores are standardized to have a standard deviation of 100 points.
In mathematics the difference between girls and boys is much more mixed than in the reading dimension. While in most countries boys tend to achieve better test scores there are also many countries and years in which girls performed better than boys.


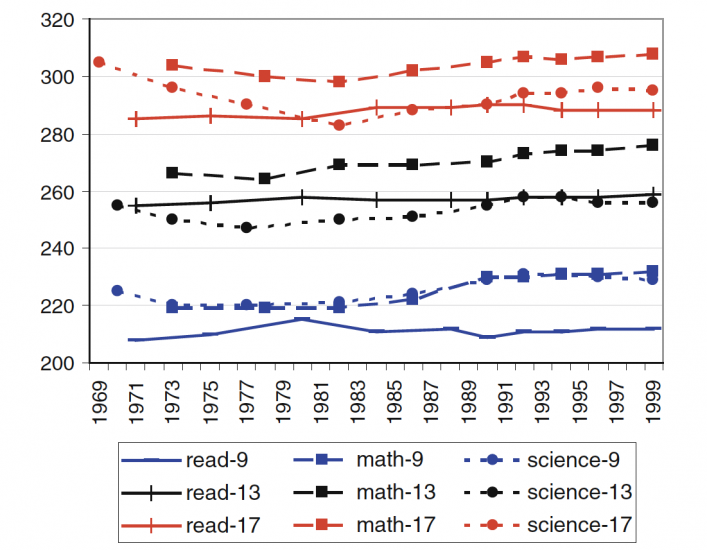
This chart shows student achievement in the US over the course of three decades.
Student Achievement in the United States over Time5
The importance of culture
One interesting aspect of school performance is the effect of family environments and culture on students exam performance. A study by John Jerrim finds that children of East Asian immigrants to Australia outperform their native counterparts in the PISA tests.6 In mathematics, he finds them to be ahead by 100 points representing two and a half years of education. This evidence suggests that the differences highlighted by PISA and the IEA may be driven by cultural or family factors rather than the schooling systems.
Correlation with development indicators
Indicators of skills and knowledge, such as the OECD PISA scores, are highly correlated with indicators of development. The following scatter plot shows the correlation between the PISA reading scores and the United Nations’ Human Development Index (HDI) for a select group of countries.

Competition and School Quality
There exists a substantial literature on the effects of competition on school quality and performance. Whether choice improves school quality remains an open question in economics. In general we might expect that more schools might be better for outcomes through competitive forces, however this relies on both schools and parents responding to the increased competition/choice. On the demand side, parents need some way of observing school quality accurately as well as the ability to change schools. Meanwhile, schools need some incentive to respond to any increase in competition. This is especially important since most public school systems lack any profit motive.
Much of the research into the effects of competition rely on indirect measures of demand for high quality schools such as local rents and house prices. Disaggregating the willingness to pay for better schools from neighbourhood effects and sociodemographic factors is highly technical and relies on models of sorting. For more information on these models see Rothstein (American Economic Review, 2006), Bayer and McMillan (NBER, 2005), and Bayer et al. (NBER, 2007).7
An alternative approach has been to use variables correlated with school competition but independent of the other the demand and supply factors to disaggregate the different effects of choice (instrumental variables approach). For more information on this approach please see Hoxby (American Economic Review, 2000) and Rothstein (American Economic Review, 2007).8
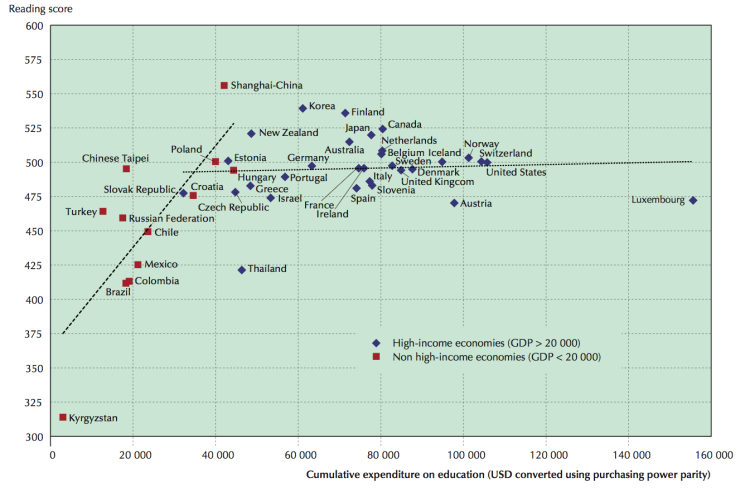
The effect of resources and development
Recent research however suggests that the link between resources and school quality is not simple. The OECD looked into whether money can buy stronger PISA test performance. They concluded that the most important factor in PISA test performance is how resources are used: countries that prioritized the quality of teachers over class sizes performed much better. This view represents a growing consensus in the education literature that inputs such as class size and expenditure per pupil have little to no effect on the returns to schooling in the developed world.9
An argument made by Eric Hanushek and Ludger Woessmann is that the lack of any straightforward relationship between resources and school outcomes indicates a minimum resource requirement.10
Once the resource threshold has been reached, additional expenditure has little or no returns to school quality — instead, teacher quality and other constraints matter far more.
The following scatter shows average spending per student from the age of 6 to 15 against reading test scores in 2009.
Average reading performance in PISA and average spending per student from the age of 6 to 15 – OECD11
Quality of education and prosperity
The education economists Eric Hanushek and Ludger Wößmann combined the results from educational achievement tests to investigate the question whether the quality of education has a causal influence on the growth of the economy.12
The visualization shows the correlation between the quality of education, as measured by Hanushek and Woessmann, and the level of prosperity of the country in 2016.

A detailed discussion of the assessment of learning outcomes is provided by Daniel Koretz in his book Measuring Up: What Educational Testing Really Tells Us.13
- Data: Comprehensive data on enrollments, out-of-school children, repetition, completion, gender, teachers, education expenditures, learning outcomes, educational attainment, education equality, literacy, population, labor, and EMIS.
- Geographical coverage: Global by country
- Time span: since 1999
- Available at: data.uis.unesco.org
- Data: indicators on educational attainment, enrolment, attendance, teachers, financing and more
- Geographical coverage: Global, over 200 countries
- Time span: 1970 to most recent data year; Projections to 2050
- Available at: It is online here
- Data: Standardised assessment scores for mathematics, reading and science
- Geographical coverage: OECD countries and other partners
- Time span: since 2000 (conducted every three years)
- Available at: oecd.org/pisa